VIX Levels I Watch for Market TimingA simple, repeatable framework I use:
• When the VIX spikes into the 28–32 zone, I start adding equities.
• When the VIX sinks back into the 12–14 zone, I trim or take profit.
This range has been reliable all year. Not financial advice—just sharing what’s been working for me.
About Volatility S&P 500 Index
VIX is a trademarked ticker symbol for the CBOE Volatility Index, a popular measure of the implied volatility of S&P 500 index options; the VIX is calculated by the Chicago Board Options Exchange (CBOE). Often referred to as the fear index or the fear gauge, the VIX represents one measure of the market's expectation of stock market volatility over the next 30-day period.
Related indices

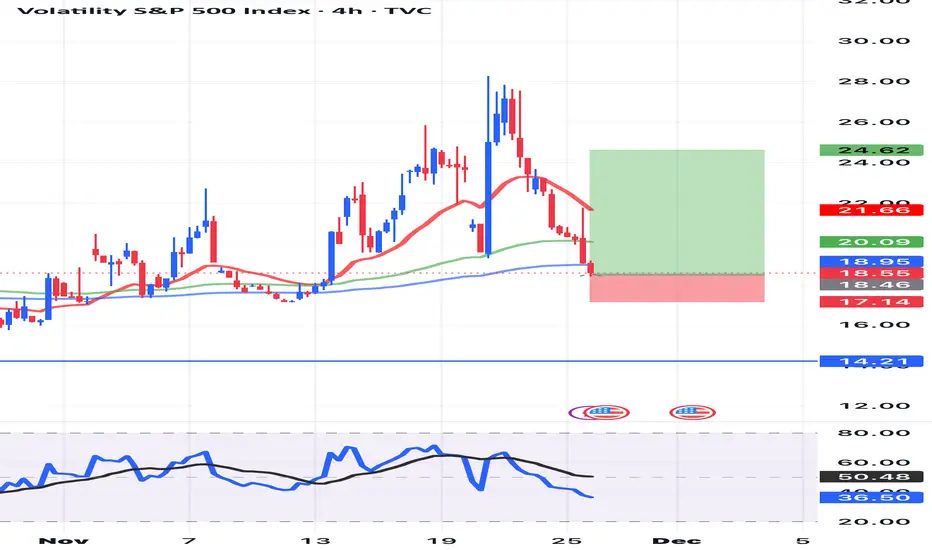
VIX mid-term TAI've been watching VIX closely since September, and the accumulation has been growing since then and it's not stopped yet, it looks like it set double top and currently is cooling down but the indicators are still very strong and they don't get that strong that often on daily time frame, the VIX may

The VIX flipping bullishThe past three days shows something we haven't seen in months: a break of the support trendline. This means two things: first, a bullish indication; second, a decrease of volatility pricing heading into the FOMC meeting next week. The market is signaling it is becoming less afraid of the FOMC meetin
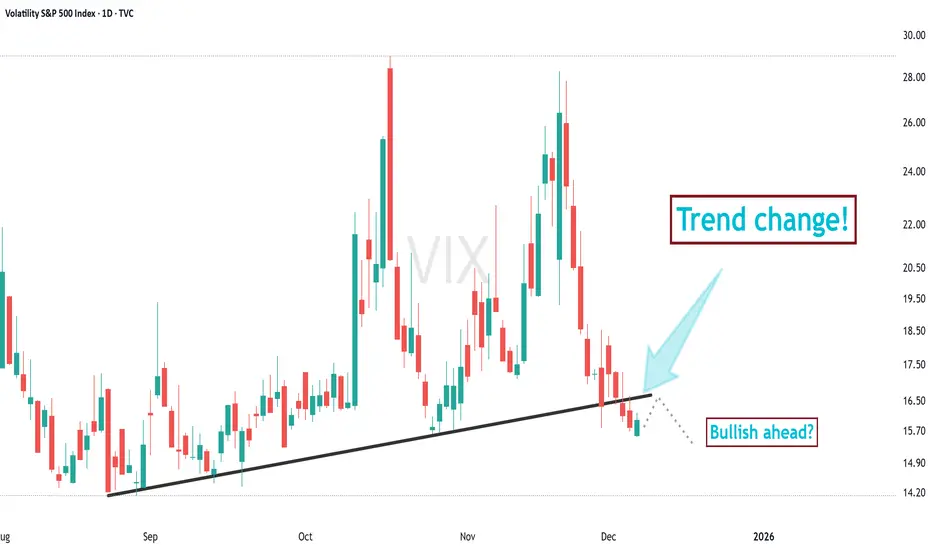
14.20 - dec 10This channel is not providing individualized trading or investment advice, nor is it a banking service, brokerage service, trading service, investment service or money management service

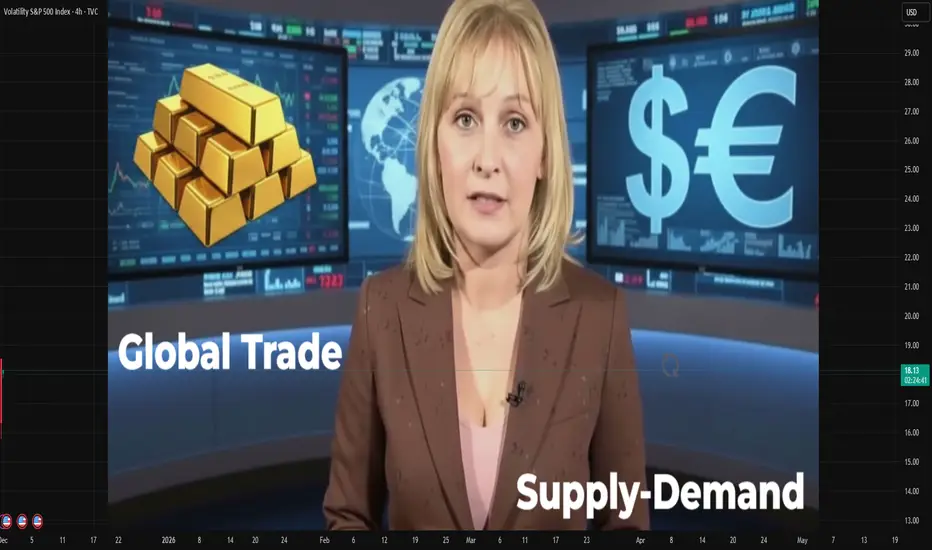
Global Trade Supply and Demand1. The Foundation of Global Supply and Demand
Supply in Global Trade
Global supply refers to how much of a particular good or service producers around the world can provide. Supply depends on:
Natural resources (oil, metals, agricultural land, minerals)
Industrial capacity (manufacturing plants,
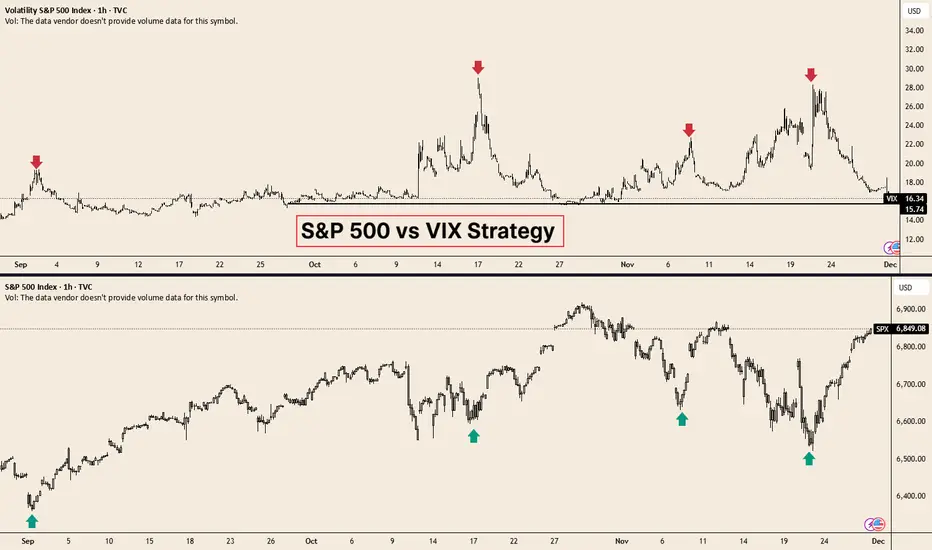
Why Every Investor Should Track the VIXThe VIX measures the market’s expectation of 30-day volatility using SPX option prices.
Because it reflects real-time hedging demand and fear levels, it tends to move violently during stress periods and collapse when investors become complacent.
This behaviour makes the VIX one of the most effective
All Aboard the Aussie Train Aussie yields remain elevated relative to other developed countries. VIX has remained very soft over the past few weeks supporting the AUD’s higher yields. Contextually, this environment supports AUD/JPY the most. However, if the DXY is unable to recover despite the FED’s open market operations

volatility clustering"high volatility is often followed by high volatility (and low by low) rather than being randomly distributed"
Markets move in cycles. Using this principle you could some times predict outcomes (regime changes).

VIXHow to become successful in forex and stock trading: 1.Master fundamentals and technical analysis. 2,Build and follow a solid trading plan. 3.Apply strict risk management (1–2% rule). 4.Stay disciplined—control fear and greed. 5.Record and analyze every trade. 6.Focus on high-quality setups only. 7.
See all ideas
Summarizing what the indicators are suggesting.
Oscillators
Neutral
SellBuy
Strong sellStrong buy
Strong sellSellNeutralBuyStrong buy
Oscillators
Neutral
SellBuy
Strong sellStrong buy
Strong sellSellNeutralBuyStrong buy
Summary
Neutral
SellBuy
Strong sellStrong buy
Strong sellSellNeutralBuyStrong buy
Summary
Neutral
SellBuy
Strong sellStrong buy
Strong sellSellNeutralBuyStrong buy
Summary
Neutral
SellBuy
Strong sellStrong buy
Strong sellSellNeutralBuyStrong buy
Moving Averages
Neutral
SellBuy
Strong sellStrong buy
Strong sellSellNeutralBuyStrong buy
Moving Averages
Neutral
SellBuy
Strong sellStrong buy
Strong sellSellNeutralBuyStrong buy
Displays a symbol's price movements over previous years to identify recurring trends.
Frequently Asked Questions
Volatility S&P 500 Index reached its highest quote on Oct 24, 2008 — 89.53 POINT. See more data on the Volatility S&P 500 Index chart.
The lowest ever quote of Volatility S&P 500 Index is 8.56 POINT. It was reached on Nov 24, 2017. See more data on the Volatility S&P 500 Index chart.
Volatility S&P 500 Index value has decreased by −4.02% in the past week, since last month it has shown a −15.12% decrease, and over the year it's increased by 6.17%. Keep track of all changes on the Volatility S&P 500 Index chart.
Volatility S&P 500 Index is just a number that lets you track performance of the instruments comprising the index, so you can't invest in it directly. But you can buy Volatility S&P 500 Index futures or funds or invest in its components.