VIX Levels I Watch for Market TimingA simple, repeatable framework I use:
• When the VIX spikes into the 28–32 zone, I start adding equities.
• When the VIX sinks back into the 12–14 zone, I trim or take profit.
This range has been reliable all year. Not financial advice—just sharing what’s been working for me.
Trade ideas

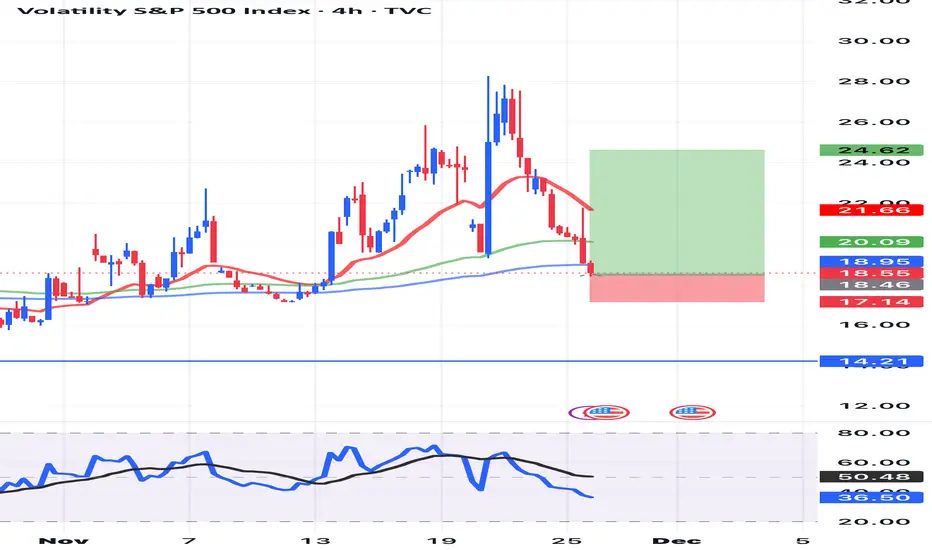
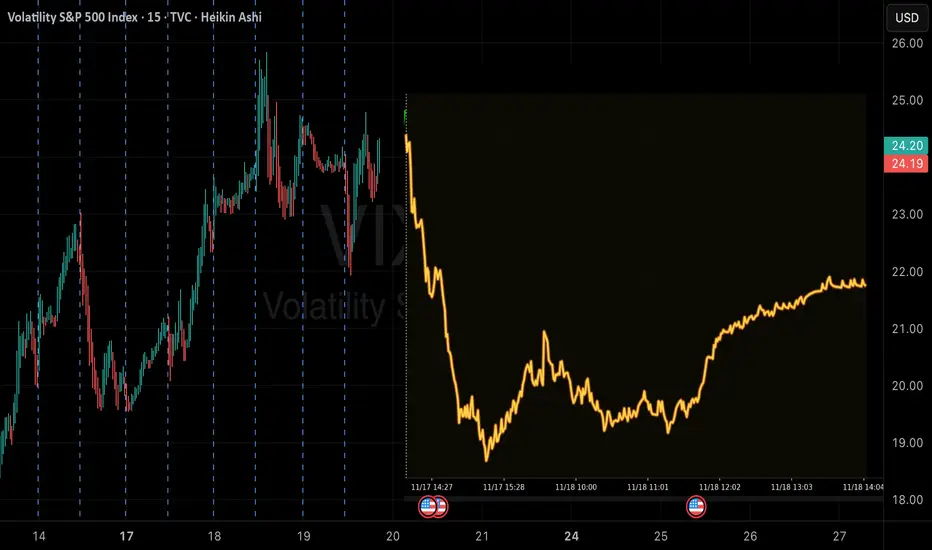
VIX mid-term TAI've been watching VIX closely since September, and the accumulation has been growing since then and it's not stopped yet, it looks like it set double top and currently is cooling down but the indicators are still very strong and they don't get that strong that often on daily time frame, the VIX may look like it's cooling down for a holiday cheer but it didn't go away yet. So be prepared for a possible volatility to hit again.

14.20 - dec 10This channel is not providing individualized trading or investment advice, nor is it a banking service, brokerage service, trading service, investment service or money management service

Global Trade Supply and Demand1. The Foundation of Global Supply and Demand
Supply in Global Trade
Global supply refers to how much of a particular good or service producers around the world can provide. Supply depends on:
Natural resources (oil, metals, agricultural land, minerals)
Industrial capacity (manufacturing plants, energy availability, labor force)
Technology and productivity (automation, robotics, digital infrastructure)
Cost efficiency (labor cost, taxation, energy cost)
Trade policies (tariffs, quotas, subsidies)
Geopolitical stability (war, sanctions, alliances)
For example:
Saudi Arabia influences global oil supply.
China dominates manufactured goods supply.
Brazil contributes heavily to agricultural supply.
Any disruption in these regions, such as war or drought, instantly affects global supply chains.
Demand in Global Trade
Global demand represents how much consumers, businesses, and governments worldwide want to purchase. Demand depends on:
Population growth
Income levels and economic growth
Consumer preferences
Technological adoption
Interest rates and inflation
Government spending
For instance:
Rising incomes in India increase global demand for electronics, oil, and automobiles.
The U.S. has high demand for consumer goods, creating massive trade flows from Asia.
Europe’s shift to green energy increases demand for lithium, cobalt, and rare earth metals.
2. How Global Trade Supply Meets Demand
The world is connected through supply chains, transportation networks, and financial systems. These create a structure where goods move efficiently from areas of high supply to areas of high demand.
Trade Routes and Logistics
Key supply–demand connections rely on:
Shipping lanes (Suez Canal, Panama Canal)
Rail networks (China–Europe rail corridors)
Air freight (high-value goods)
Digital trade platforms
Port infrastructure
When a major route is disrupted (e.g., Suez Canal blockade), supply delays cause global price spikes.
Global Value Chains (GVCs)
Most products today are not made in one country; they involve multiple supply chains:
iPhones: designed in the U.S., assembled in China, components from Japan, Korea, and Taiwan.
Automobiles: global sourcing of steel, electronics, engines, and software.
These interconnected systems allow nations to specialize in what they do best, optimizing global supply.
3. Imbalances Between Supply and Demand
Global trade often experiences gaps where supply does not match demand. These imbalances lead to price volatility and economic consequences.
Excess Supply
Occurs when production exceeds consumption:
Oil surpluses cause price crashes.
Overproduction of steel in China creates global price suppression.
Oversupply in agriculture reduces farmers’ income.
Excess Demand
Occurs when demand outstrips supply:
Semiconductor shortages (2020–2022) stopped automobile production.
High demand for housing materials during economic booms increases lumber and steel prices.
Increased energy consumption leads to shortages and higher fuel prices.
These imbalances often spark inflation, currency fluctuations, and government interventions.
4. Factors Influencing Global Supply and Demand
A. Economic Growth Cycles
During economic expansions, demand for commodities, raw materials, and manufactured goods increases. During recessions, global demand falls, pushing down prices.
B. Technological Changes
Automation, artificial intelligence, and digital tools reduce production cost, increasing supply capacity. Meanwhile, technology creates new demand sectors—electric vehicles, smartphones, green energy infrastructure.
C. Geopolitics
Wars, sanctions, and diplomatic tensions directly affect supply:
Russia–Ukraine war disrupted global grain and energy supply.
U.S.–China trade tensions impacted electronics and chip manufacturing.
Middle East conflicts threaten global oil supply routes.
D. Climate Change
Extreme weather disrupts agricultural supply, energy networks, and shipping infrastructure. Rising temperatures reduce crop yields, creating demand pressure for food imports.
E. Demographics and Urbanization
Countries with young populations (India, Africa) generate massive future demand. Aging societies (Japan, Europe) shift demand to healthcare and services rather than manufacturing goods.
5. Pricing Mechanism in Global Trade
Prices act as a bridge between supply and demand. When demand rises faster than supply, prices increase. When supply rises faster than demand, prices fall.
Commodity Prices
Oil, gold, natural gas, and metals are highly sensitive to global events. They are traded on international exchanges where prices adjust instantly.
Currency Influence
Exchange rates impact trade flows:
A weaker currency boosts exports (cheaper for foreign buyers).
A stronger currency increases imports (cheaper to buy from abroad).
Central banks indirectly shape global supply and demand through monetary policy.
Transportation and Freight Costs
Global freight rates significantly influence trade economics. For example, during the pandemic, container shipping prices rose nearly tenfold, affecting supply and causing inflation worldwide.
6. Global Supply Chain Disruptions
Modern trade depends on smooth logistics and political stability. Disruptions include:
Pandemics (COVID-19 halted production and shipping)
Natural disasters (Earthquakes in Japan disrupted electronics supply)
Strikes (Port strikes slow imports and exports)
Energy crises
Cyberattacks on infrastructure
Such disruptions create domino effects across industries and borders.
7. The Future of Global Supply and Demand
The global trade landscape is currently undergoing transformation. Several trends will shape the future:
A. Nearshoring and Friend-shoring
Companies are moving supply chains closer to home or to politically aligned countries to reduce risk.
B. Automation and Digital Trade
Robotics, 3D printing, and e-commerce reduce dependence on global labor and physical supply chains.
C. Renewable Energy Demand
The shift from fossil fuels to solar, wind, and electric mobility is increasing demand for lithium, nickel, copper, and rare earth metals.
D. Evolving Consumer Preferences
Sustainability, ethical sourcing, and climate-friendly production are becoming decisive factors.
E. Multipolar World Economy
Trade is shifting from U.S.–China dominance to a more diversified pattern involving India, ASEAN, Africa, and Latin America.
Conclusion
Global trade supply and demand form the backbone of the world economy. They determine how goods flow across nations, influence prices, shape geopolitical strategies, and affect the daily lives of billions. The interaction between how much countries can produce and how much the world wants to consume drives growth, development, technology, and innovation.
As globalization evolves, understanding global supply–demand dynamics becomes crucial for governments, businesses, traders, and consumers alike. The countries that manage supply efficiently and meet shifting global demand will remain dominant players in the world market.
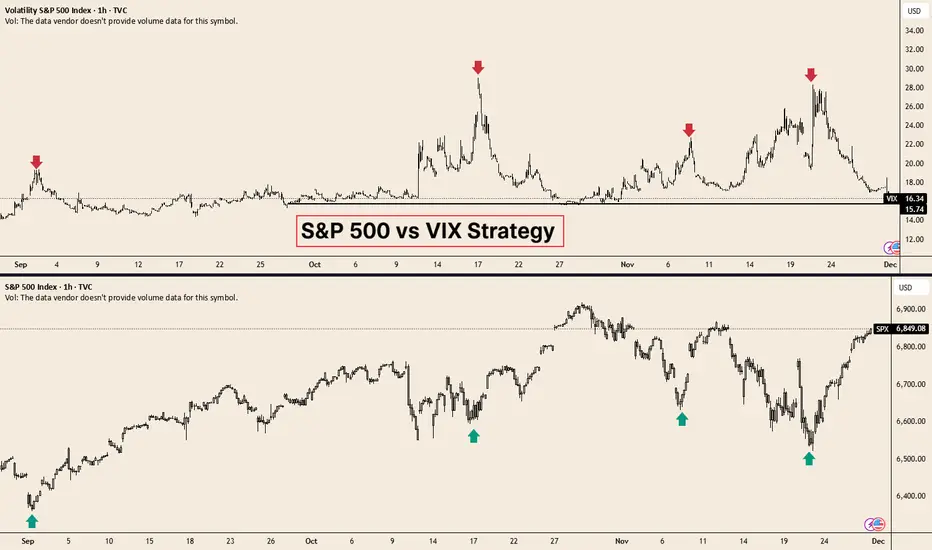
Why Every Investor Should Track the VIXThe VIX measures the market’s expectation of 30-day volatility using SPX option prices.
Because it reflects real-time hedging demand and fear levels, it tends to move violently during stress periods and collapse when investors become complacent.
This behaviour makes the VIX one of the most effective short- and mid-term indicators for equity turning points.
The chart above shows this clearly:
• 🔺 When the VIX spikes sharply (red arrows), the S&P 500 is usually in a capitulation phase driven by forced selling.
• 📉 These spikes almost always align with local bottoms in the index (green arrows), as panic exhausts itself and liquidity stabilises.
• 📈 Once volatility mean-reverts lower, equities typically recover strongly from oversold conditions.
• ⚠️ When the VIX collapses to structural lows, forward returns weaken and the probability of pullbacks increases.
Why this matters for long-term performance:
• 🎯 Buying SPY during volatility spikes has historically delivered superior forward returns compared with adding exposure during low-volatility periods.
• 💰 High VIX readings correspond to discounted prices, elevated risk premia, and stronger 6–12 month forward outcomes.
• 🟡 Low VIX environments, like the current one, signal complacency and a less attractive asymmetry for new entries.
In our view, the present volatility reset — with the VIX back near its lower range while the S&P 500 hits new highs — argues for caution.
It does not imply an immediate top, but it does suggest that the balance of risk favours patience over aggressive entries.
Why Every Investor Should Track the VIXThe VIX measures the market’s expectation of 30-day volatility using SPX option prices.
Because it reflects real-time hedging demand and fear levels, it tends to move violently during stress periods and collapse when investors become complacent.
This behaviour makes the VIX one of the most effective short- and mid-term indicators for equity turning points.
The chart above shows this clearly:
• 🔺 When the TVC:VIX spikes sharply (red arrows), the TVC:SPX is usually in a capitulation phase driven by forced selling.
• 📉 These spikes almost always align with local bottoms in the index (green arrows), as panic exhausts itself and liquidity stabilises.
• 📈 Once volatility mean-reverts lower, equities typically recover strongly from oversold conditions.
• ⚠️ When the VIX collapses to structural lows, forward returns weaken and the probability of pullbacks increases.
Why this matters for long-term performance:
• 🎯 Buying SPY during volatility spikes has historically delivered superior forward returns compared with adding exposure during low-volatility periods.
• 💰 High VIX readings correspond to discounted prices, elevated risk premia, and stronger 6–12 month forward outcomes.
• 🟡 Low VIX environments, like the current one, signal complacency and a less attractive asymmetry for new entries.
In our view, the present volatility reset — with the VIX back near its lower range while the S&P 500 hits new highs — argues for caution.
It does not imply an immediate top, but it does suggest that the balance of risk favours patience over aggressive entries.

volatility clustering"high volatility is often followed by high volatility (and low by low) rather than being randomly distributed"
Markets move in cycles. Using this principle you could some times predict outcomes (regime changes).

VIXHow to become successful in forex and stock trading: 1.Master fundamentals and technical analysis. 2,Build and follow a solid trading plan. 3.Apply strict risk management (1–2% rule). 4.Stay disciplined—control fear and greed. 5.Record and analyze every trade. 6.Focus on high-quality setups only. 7.Diversify across assets and markets. 8.Keep evolving—study, adapt, and grow daily.
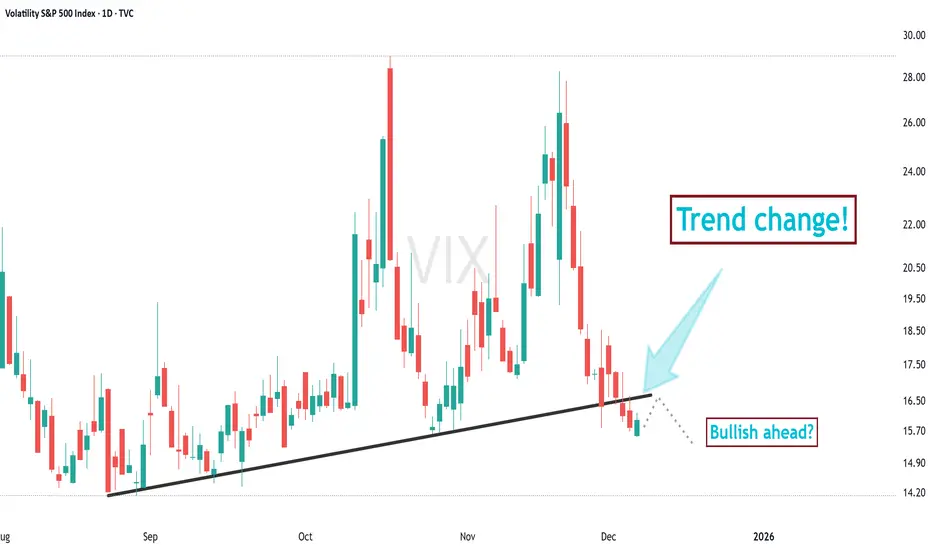
The VIX flipping bullishThe past three days shows something we haven't seen in months: a break of the support trendline. This means two things: first, a bullish indication; second, a decrease of volatility pricing heading into the FOMC meeting next week. The market is signaling it is becoming less afraid of the FOMC meeting outcome because it knows what the Fed is most likely to do.
Over the next three days, we could see the VIX rise and retest this trendline from the underside or less. That would portend a bullish run in SPX going into the end of the year.
QuantSignals V3: VIX Bear Put Alert – Big Volatility Play Ahead!VIX (QuantSignals Katy 1M | 2025-11-24)
Direction: BUY CALL
Confidence: 75%
Current Price: $21.27
Entry: $21.27
Target: $23.14 (+8.8% from entry)
Stop Loss: $20.95 (–1.5% from entry)
Expected Move: +11.01%
30min Target: $22.07 (+3.77%)
Trend: BULLISH
Volatility: 130.8%
📈 Technical Overview
Strong bullish momentum observed by Katy AI
Short-term (30 min) upside target: $22.07
Medium-term 1-month target: $23.61
High volatility environment → larger option premiums expected
⚡ Trade Setup Notes
Consider small position size due to high volatility
Use tight risk management with stop at $20.95
Entry at current level $21.27 captures immediate bullish trend
📰 Summary
1 trade signal generated from 1 analyzed symbol
High confidence (75%) supports bullish call setup
VIX likely to increase over next 1 month, providing upside opportunity

Fear is in the airWhat happens when the VIX monthly 8-21 and 34-50 EMAs cross over to the upside, individually and collectively? Occurrences of selling become more frequent and potent. TVC:VIX AMEX:SPY SP:SPX NASDAQ:NDX NASDAQ:QQQ COINBASE:BTCUSD

VIX don't lieA persistently upward trending VIX is nothing to ignore if your portfolio is heavily bullish this indication is screaming at you that the bottom of the market has not been found. At a MINIMUM, traders, not to mention investors would be wise to wait until the VIX closes below 20.
Central Bank Impact on the Global Market1. Monetary Policy and Global Liquidity
The most direct way central banks impact the global economy is through monetary policy, which includes interest rate changes and balance sheet operations.
a. Interest Rate Decisions
When a major central bank changes its policy interest rate, it alters the global cost of capital. For example:
If the Federal Reserve raises interest rates, borrowing becomes expensive not only in the United States but across global markets that depend on dollar funding.
Higher rates cause international investors to pull money from emerging markets and invest in U.S. assets for better yields, leading to:
Capital outflows from emerging markets,
Currency depreciation in developing countries,
Rising borrowing costs globally.
Conversely, when central banks cut rates, global liquidity expands, and risk assets such as stocks and commodities usually rally.
b. Quantitative Easing (QE) and Balance Sheet Expansion
During crises, major central banks purchase government bonds, corporate bonds, or other assets to inject liquidity. This boosts global risk appetite because:
Investors search for higher returns,
Global asset prices rise,
Borrowing becomes cheaper worldwide.
For instance, QE by the Fed after the 2008 financial crisis and during the COVID-19 pandemic lowered global interest rates and caused a surge in liquidity across world markets.
2. Exchange Rate Movements and Currency Policy
Central banks significantly influence exchange rates, which directly affect global trade and capital flows.
a. Currency Appreciation/Depreciation
When a central bank tightens policy (raising rates), its currency usually strengthens. A strong currency has global implications:
It makes imports cheaper but exports more expensive,
It can create competitive pressures for trading partners,
It may cause global commodity prices (priced in that currency) to fluctuate.
For example, a strong U.S. dollar typically:
Pushes global commodity prices downward,
Makes emerging market debt harder to repay,
Reduces global trade volumes due to expensive financing.
On the other hand, loose monetary policy causes currency depreciation, supporting export competitiveness and global trade flows.
b. Currency Interventions
Some central banks actively intervene in currency markets. For example:
The Bank of Japan intervenes to curb excessive appreciation of the yen.
The People’s Bank of China regulates the yuan to maintain stability for its export-driven economy.
Such interventions influence global currency markets, cross-border investments, and international trade competitiveness.
3. Impact on Global Financial Markets
Central bank decisions directly affect global stock markets, bond markets, commodities, and derivatives.
a. Stock Markets
Lower interest rates generally boost global stock indexes by:
Reducing discount rates used in valuation,
Increasing corporate borrowing capacity,
Encouraging investment in risk assets.
Conversely, rate hikes lead to global stock market corrections, especially in sectors sensitive to financing such as technology, real estate, and banking.
b. Bond Markets
Central banks influence:
Government bond yields,
Corporate bond spreads,
Global fixed-income returns.
When central banks signal future rate hikes, global bond yields rise, causing bond prices to fall.
c. Commodity Markets
Since many commodities are priced in dollars, the Federal Reserve’s monetary policy strongly affects global commodity cycles. A stronger dollar generally leads to weaker demand for commodities like oil, gold, and metals.
4. Inflation Control and Global Price Stability
Inflation dynamics in one major economy can spill over into global markets due to interconnected supply chains and energy markets.
a. Inflation Targeting
Most central banks aim to keep inflation around a target (usually 2%). When inflation rises, central banks:
Tighten monetary policy,
Reduce liquidity,
Increase borrowing costs globally.
This can slow global trade and investment.
b. Import and Export Inflation
A country’s inflation can be influenced by foreign price levels. For example:
Rising global oil prices cause inflation in energy-importing countries.
High U.S. inflation increases import costs for other countries.
Central bank responses to inflation therefore have global implications.
5. Financial Stability and Crisis Management
Central banks act as lenders of last resort during financial crises, helping prevent global contagion.
a. Liquidity Backstops
During crises, central banks inject emergency liquidity to stabilize markets. For example:
The Fed provides dollar swap lines to global central banks to prevent shortages of dollar liquidity.
The ECB creates special financing programs during European debt crises.
This helps avoid widespread defaults and maintains confidence in global finance.
b. Regulation and Macroprudential Policy
Central banks oversee:
Bank capital requirements,
Stress testing,
Systemic risk monitoring.
Stronger regulations in major economies (like Basel III norms) influence global banking practices.
6. Influence Through Forward Guidance
Modern central banks use communication as a policy tool.
a. Market Expectations
Central bank speeches, press releases, and meeting minutes shape expectations around future policy. Global financial markets react instantly to:
Hawkish statements (more tightening),
Dovish statements (more easing).
For example, a single speech by the Federal Reserve Chair can move stock markets, bond yields, and currencies worldwide.
b. Transparency and Credibility
Consistent communication enhances global confidence and reduces volatility. Uncertain or contradictory statements can cause major market swings.
7. Coordination Between Central Banks
Sometimes central banks coordinate policy actions to stabilize the global market.
a. Joint Rate Cuts
During the 2008 crisis, multiple central banks cut rates simultaneously to restore confidence.
b. Swap Lines
Currency swap lines ensure smooth functioning of global payment systems.
c. Global Regulatory Standards
Central banks collaborate through bodies like the Bank for International Settlements (BIS) to maintain financial stability.
8. Impact on Emerging Markets
Emerging markets are often the most affected by major central bank decisions.
a. Capital Flows
Tighter policy in the U.S. causes:
Outflows from emerging markets,
Weakening currencies,
Rising inflation and borrowing costs.
b. External Debt Burden
Many emerging markets have dollar-denominated debt. A stronger dollar increases repayment burdens.
c. Trade Impact
Fluctuations in exchange rates influence export competitiveness and trade balances.
Conclusion
Central banks play a decisive role in shaping the global economic and financial environment. Through interest rate decisions, liquidity management, currency policy, and crisis interventions, they influence everything from global stock markets and capital flows to trade balances and inflation levels. In an interconnected world, the decisions of major central banks have far-reaching implications not just domestically but across the entire global market. As the global economy becomes more integrated, the influence of central banks will continue to grow, making their policies a key factor for investors, businesses, and governments worldwide.
QuantSignals V3: VIX Poised for Potential Pullback – Handle WithVIX Weekly | QuantSignals V3 | 2025-11-20
Direction: PUT (Bearish)
Confidence: 58%
Expiry: 2025-11-28 (8 days)
Strike Focus: $23.00
Weekly Momentum: BEARISH (-1.17%)
Flow Intel: Neutral
Entry Price: Market (illiquid options)
Target 1: Price-dependent
Target 2: Price-dependent
Stop Loss: $24.01 (Katy AI stop level)
Position Size: 1% of portfolio (extremely cautious)
Analysis:
Katy AI: NEUTRAL overall, but 68.8% of prediction points below current price; final target $19.88 (-15.9%).
Technical: VIX at $23.66, 1-week bearish momentum, resistance $24.01, support around $21-22.
Options Flow: Extremely illiquid, neutral bias.
Risk Level: HIGH – illiquid market, low confidence, extreme volatility.
Trade Setup:
Why Trade: Detailed AI series shows consistent downward bias.
Timing: Position early in the week to capture predicted decline.
Risk Mitigation: Extremely small size; stop loss at $24.01.
⚠️ Important: Illiquid VIX options make this trade high-risk. Only for professional traders or market-makers. Retail traders should avoid.
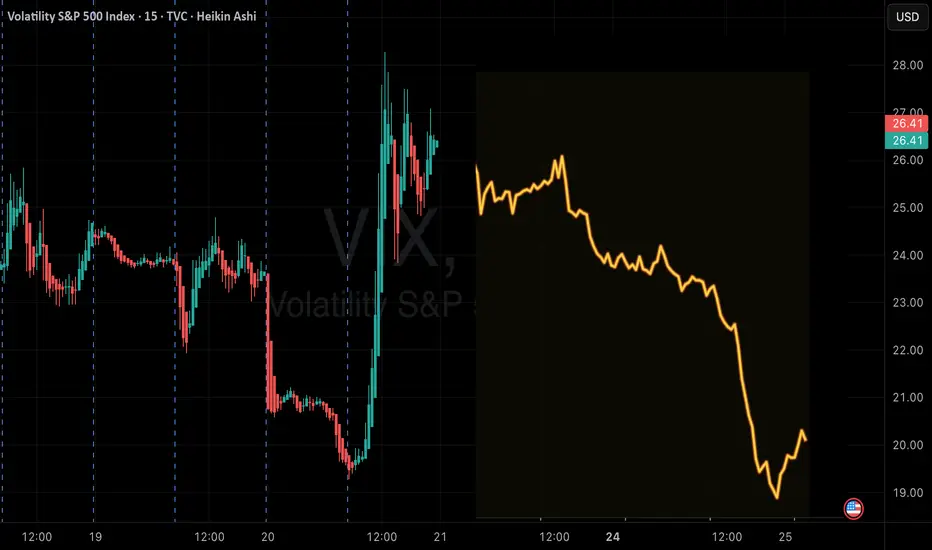
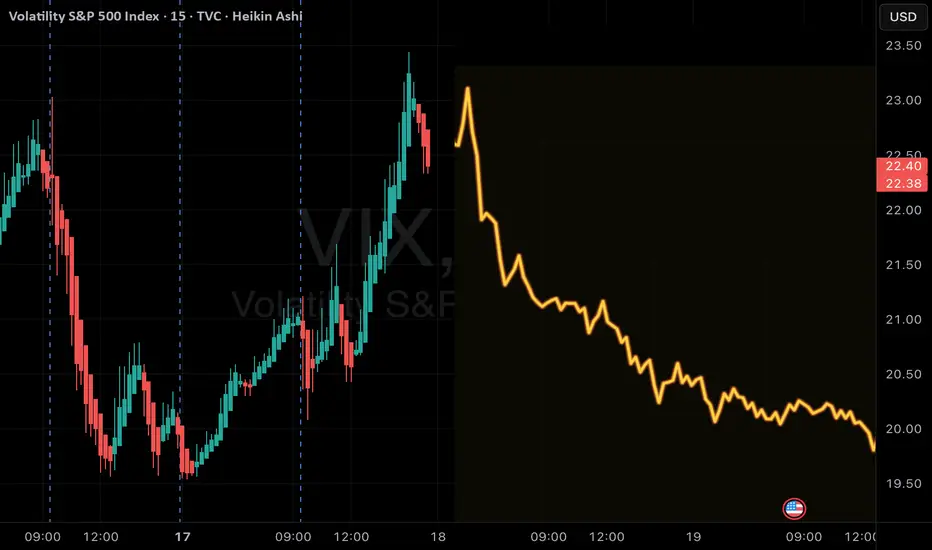
QuantSignals V3: High-Confidence VIX DowntrendVIX QuantSignals Katy 1M Prediction (2025-11-19)
Current Price: $22.40
Trend: Bearish
Confidence: 75%
Volatility: 94.1%
Final Prediction: $20.98 (-6.34%)
30-Min Target: $21.10 (-5.81%)
Trade Signal:
Direction: PUT
Entry: $22.40
Target: $21.26
Stop Loss: $22.74
Expected Move: -6.34%
Summary: 1 trade signal generated from 1 successful analysis.
Vix to 28Not a big fan of price patterns on vix but this looks like a confirmed cup with handle. Nice bear divergences as RSI passes through the solid red line price should accelerate to the 28.00 target
. Hourly chart

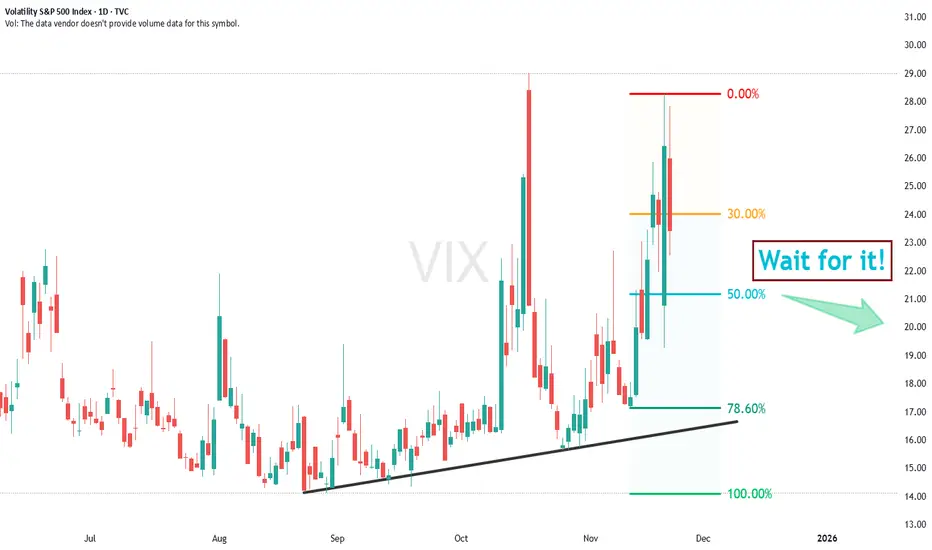
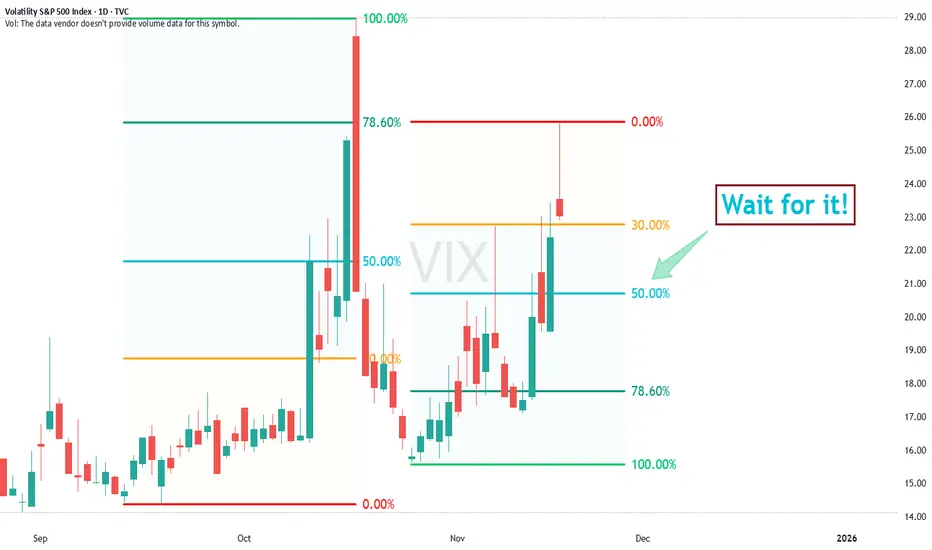
The VIX is Very ExpensiveVolatility has to dampen greatly for the institutional money to feel safe enough to get back into buying mode. Usually, a 50% retracement from recent highs marks a good signal for re-entry into the markets. We are clearly not their yet, but by the end of the week, we could be.
USE THE VIX TO TRADE BETTERSince the market has been a bit crazy lately, it's a good time to teach everyone about the VIX (Fear/Volatility Index) and how to use it to make your trading better.
In this video, I show you how I organize the VIX and use it every day to make my day trading and swing trading more adaptable to an ever-changing market environment.
VIX GUIDE:
Below 15: Low volatility. Calm markets, clean trend. Good for trend traders and swing traders.
15-20: Moderate volatility. This is the average level for the VIX. Market moves noticeably more.
20-25: High volatility. Big moves in the market start to happen at these levels. Great for experienced traders who like volatility. Caution for most other traders.
25-30: Extreme volatility. Tradable for experienced traders, but much greater difficulty level of trading. Most traders are advised to step back in this range.
30+: Chaos. Elite traders may profit, but it is very dangerous for the unprepared trader.

Equity Market Indices (S&P 500, Nasdaq, DAX, Nikkei)1. S&P 500 Index — The Global Benchmark
The Standard & Poor’s 500 Index, commonly known as the S&P 500, is one of the world’s most followed equity indices. It tracks 500 of the largest publicly listed companies in the United States. Unlike the Dow Jones Industrial Average, which uses price weighting, the S&P 500 uses free-float market capitalization weighting, making it a more accurate representation of the U.S. equity market.
Structure and Components
The index spans all major U.S. sectors, including technology, financials, healthcare, consumer discretionary, and energy. Mega-cap companies like Apple, Microsoft, Amazon, and Alphabet often dominate the index due to their large market capitalizations.
Economic Significance
The S&P 500 accounts for over 80% of U.S. total market value, making it a barometer for overall U.S. corporate health. Movements in the index reflect:
Corporate earnings trends
Investor sentiment
Monetary policy expectations
Global macroeconomic factors
Investment and Trading Use
Investors use the S&P 500 for:
Benchmarking fund performance
ETF and index fund investing (e.g., SPY, VOO)
Futures and options trading
Analysts often interpret a rising S&P 500 as a sign of economic expansion, while prolonged declines may indicate recession concerns.
2. Nasdaq Composite & Nasdaq-100 — Tech-Heavy Growth Indicators
The Nasdaq Composite is one of the most technology-heavy indices in the world, tracking over 3,000 stocks listed on the Nasdaq exchange. The more popular trading index, however, is the Nasdaq-100, which includes the top 100 non-financial companies on Nasdaq.
Technology Dominance
The Nasdaq is dominated by:
Technology
Internet services
Biotechnology
Semiconductor companies
Major names include Apple, Microsoft, Nvidia, Meta, and Tesla.
Characteristics and Sensitivity
Because it is tech-heavy, the Nasdaq tends to be:
More volatile than the S&P 500
Highly sensitive to interest rate changes
Influenced strongly by innovation trends, earnings expectations, and regulatory actions
Growth stocks, which dominate the Nasdaq, typically outperform during low-interest-rate environments when borrowing is cheaper and future earnings are more valuable.
Use for Traders
Traders often use the Nasdaq as a sentiment gauge for:
Tech sector strength
Risk appetite in markets
Momentum-driven trading strategies
Nasdaq futures (NQ) and ETFs like QQQ are among the most actively traded instruments globally.
3. DAX (Germany) — Europe’s Industrial Power Index
The DAX (Deutscher Aktienindex) is Germany’s leading stock index, representing 40 blue-chip companies listed on the Frankfurt Stock Exchange. Unlike other indices, the DAX is a performance index, meaning dividends are reinvested, resulting in slightly higher long-term returns.
Composition
The DAX includes major industrial, automotive, chemical, and financial giants such as:
Siemens
Volkswagen
Mercedes-Benz
Bayer
Allianz
SAP
Role in Europe
Germany is Europe’s largest economy, so the DAX essentially acts as a proxy for the health of the Eurozone economy. It reflects:
Manufacturing output
Export competitiveness
Global demand for automobiles and engineering
Euro currency movements
Key Drivers
The DAX is influenced by:
European Central Bank (ECB) policies
Eurozone inflation and GDP
Geopolitical relations with the U.S. & China
Energy prices (Europe is energy-dependent)
During periods of higher global industrial activity, the DAX typically performs strongly due to Germany’s export-led economy.
4. Nikkei 225 — Japan’s Economic Indicator
The Nikkei 225, Japan’s best-known stock index, tracks 225 top companies on the Tokyo Stock Exchange. Unlike most major indices, the Nikkei is price-weighted, similar to the Dow Jones, meaning higher-priced stocks have greater influence regardless of company size.
Sector Mix
Japan’s market includes a mix of:
Automotive companies (Toyota, Honda, Nissan)
Consumer electronics (Sony, Panasonic)
Industrial manufacturers (Fanuc, Hitachi)
Financial institutions
Economic Importance
The Nikkei reflects Japan’s:
Export competitiveness (especially to the U.S. and China)
Yen strength or weakness
Domestic consumption trends
Bank of Japan (BOJ) monetary policy
Japan's prolonged period of low interest rates and deflation has historically shaped the Nikkei’s long-term performance.
Yen Relationship
The Nikkei tends to rise when the Japanese yen weakens, because a weaker yen boosts export revenues. It often behaves inversely to USD/JPY currency movements.
5. How Traders Use These Indices
Market Sentiment Indicators
Each index provides insight into different segments:
S&P 500: overall U.S. economy
Nasdaq: tech and growth sentiment
DAX: European industrial strength
Nikkei: Asian economic trends
Sector Rotation
Investors analyze relative performance to gauge:
Growth vs. value cycles
Domestic vs. international capital flows
Risk-on vs. risk-off behavior
Hedging & Diversification
Indices are widely used for:
Portfolio diversification
Hedging through futures/options
ETF investing across regions
Correlation Behavior
S&P 500 and Nasdaq have high correlation
DAX moves closely with global manufacturing trends
Nikkei correlates strongly with currency markets
Understanding these correlations helps global traders manage risk and time their entries.
6. Global Impact of Index Movements
Because these are major world indices, movements can influence:
Commodity prices (oil, gold)
Currency valuations (USD, EUR, JPY)
Bond markets
Emerging market flows
For example:
A strong S&P 500 often attracts global capital into the U.S.
Weak DAX performance can signal European recession fears
A rising Nikkei can lift Asian equity sentiment
Conclusion
Equity market indices like the S&P 500, Nasdaq, DAX, and Nikkei 225 are more than just collections of stock prices. They are critical indicators of economic health, investor behavior, and global financial stability. Each index reflects the structure of its economy—U.S. technology leadership for Nasdaq, diversified large caps for the S&P 500, industrial might for the DAX, and export-driven growth for the Nikkei. Together, they form the backbone of global equity analysis and remain essential tools for traders, investors, and policymakers worldwide.

QuantSignals V3 | High-Probability VIX OptionsVIX Weekly Signal | 2025-11-17
Direction: BUY PUTS
Strike: $20.00
Entry: $0.00 (requires live price discovery)
Target 1 / 2: $0.10 / $0.20
Stop Loss: $0.00 / $20.13
Expiry: 2025-11-21
Confidence: 60% | Medium
Weekly Momentum: BEARISH (-4.02%)
Technical Notes: Slight bearish bias; support $18.97, resistance $20.13
Risk: Moderate – VIX is volatile; monitor options data carefully
Alternate VIX CALL Signal:
Strike $22.50, Confidence 70%, weekly bullish momentum +10%, strong trend confirmation, entry $0.00 (verify pricing), Target 1/2: $0.30/$0.50
VIX upVolatility is coming back significantly. VIX (Volatility) making higher lows and frequency of spikes upwards increases, something is coming, be warned! A major sell-off in stocks would be healthy and normal after 13 years of bull market. BUY Gold instead now, or UVIX or VXX and thank me later :)

$VIX: ALLIGNED FOR FURTHER EQUITY MARKET WEAKNESS We can observe the following on the weekly chart:
1. MACD buy signal since September 29th
2. RSI 14 above the 50 line at 53
3. From October 27th onwards, higher weekly lows and higher weekly closing highs.
4. Despite new all-time highs for benchmark stock indices, there is a divergence with the TVC:VIX (negative divergence for equities)
If this pattern persists, the risk to the stock market remains.

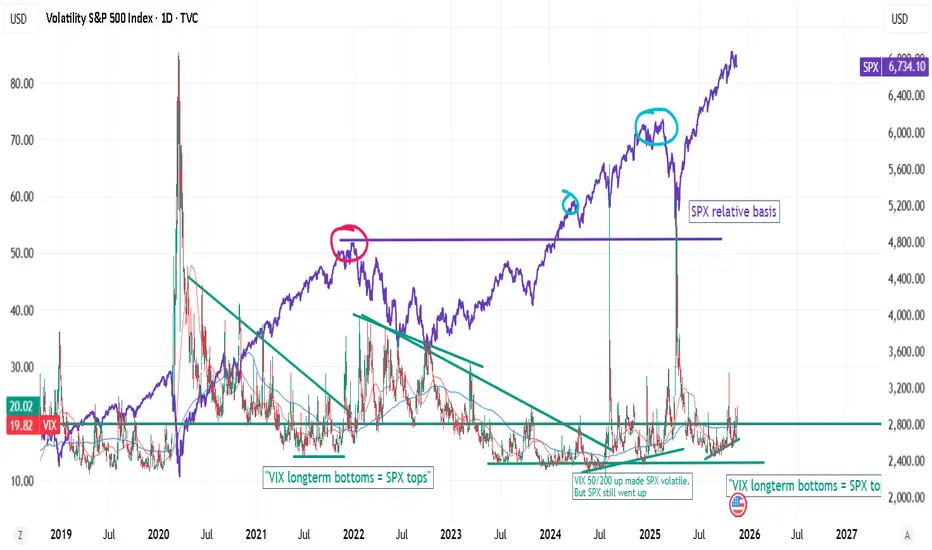
VIX and SPX myths.There's truth about VIX longterm bottoms and SPX tops, but believing that concept can come biting you back.
Stock performance will correlate with SPX in relative terms? ie how much potential and lack of resistance. Stocks go in cycles. So probably this is a important concept to study and master.