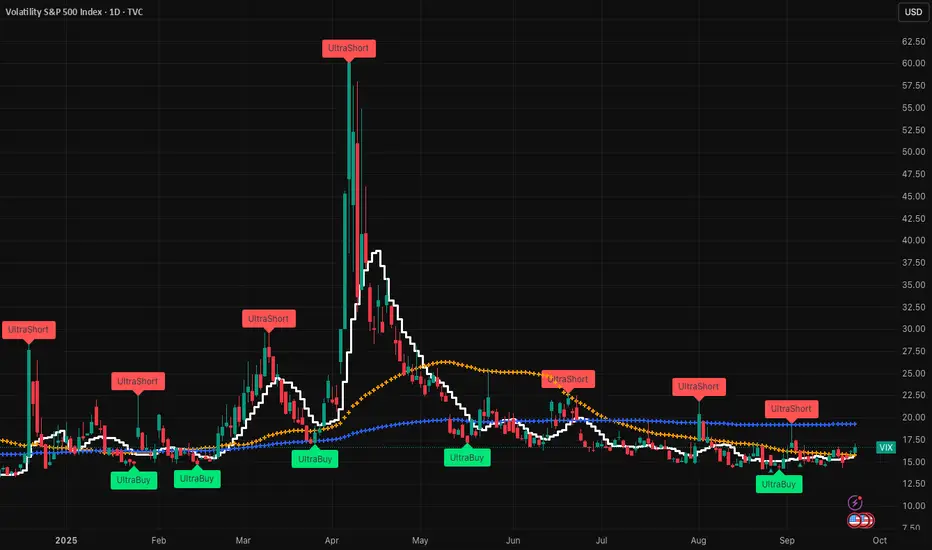
VIX set-up....interesting week aheadTo the untrained eye, you see VIX go up and down, just like any other time. Taking a big step back, you'll know that VIX has been super complacent (very strange looking back 30 years) for about 6 months. Over the last few days, we see SMA9 crossing UP SMA50! Why does this matter? Because when VIX spikes, it really spikes! Next week we have the gov shutdown and a lot of funky things going on with Russia / NATO that can spark something big, hopefully not! Many other news could spike it, but we've seen a weakness in the general market and potentially a Volmageddon 2.0 in the making. Put your alerts on and nice upside with $UVIX!
VIX trade ideas

SPX updateLikely higher still over 6700 with a divergent low on the vix still to come. After that, we may see a stronger and more consistent move down.

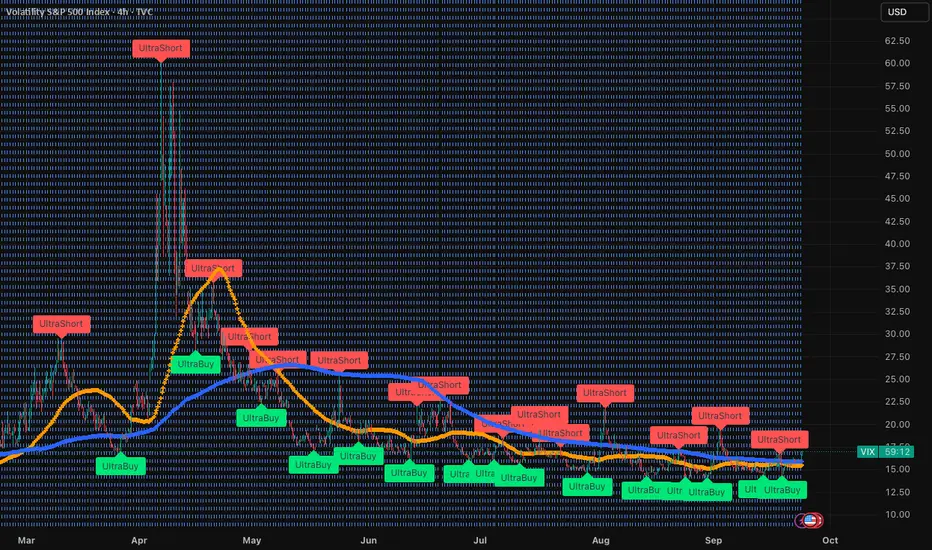
$VIX We only just started! Volmageddon 2.0Zoom out on the VIX and you'll find that there is A LOT more runway. Study the VIX for the last 30 years and you'll find that it bottoms out and explodes. We are not at a turning point in the markets with ultra high "hot air balloons" that will come down with a correction that is long overdue. The VIX hasn't been this low in a very long time, so you want to keep the proxy CBOE:UVIX in your radar. Happy trading! Always look to make lemonade out of lemons :)
Bears Trapped at Resistance - Volatility Squeeze Imminent📊 To see my confluences and/or linework, step 1: grab chart, step 2: unhide Group 1 in object tree, step 3: hide and unhide specific confluences. 😊
🎯 VIX: Bears Trapped at Resistance - Volatility Squeeze Imminent
The Market Participant Battle:
The volatility bears who successfully crushed VIX from point 2 (19+) down to point 3 (17-) have now been confirmed as the dominant force. With VIX returning to their established resistance zone at point 4 (18.73), these sellers are coiling for another aggressive push lower. The setup shows institutional volatility sellers systematically beating retail fear buyers, with price expected to collapse back toward the 15-16 range as complacency returns to the market.
Confluences:
Confluence 1: Price Pattern Confirmation (Points 1→4)
The numbered sequence reveals a textbook seller confirmation pattern. When point 3 closed below point 1, it validated point 2 as a confirmed resistance zone where volatility sellers defeated buyers. Point 4's return to this zone represents the second test of proven sellers - a high-probability reversal setup. The pattern suggests VIX should fail here and return toward recent lows.
Confluence 2: Major Pitchfork Resistance
The primary pitchfork structure confirms point 4 as a critical turning point. Price is respecting the upper parallel line perfectly, suggesting strong dynamic resistance. This technical structure has contained VIX rallies throughout the recent range-bound period, reinforcing the bear case.
Confluence 3: Volume Profile Gap Above
The fixed range volume profile shows a significant gap above point 4, indicating lack of trading interest or support at higher levels. This vacuum above current prices suggests any attempted breakout would face immediate selling pressure due to lack of structural support.
Confluence 4: Anchored VWAP Rejection
The anchored VWAP from point 1 shows point 4 pulling above then failing under the first standard deviation. This classic "deviation trap" pattern often precedes sharp reversals as institutions enter shorts above key deviations while retail traders chase breakouts.
Confluence 5: Momentum Divergences
Both RSI and MFI show overbought conditions with clear second-degree bearish divergence. The OBV is hitting resistance at its descending trendline, confirming distribution rather than accumulation at these levels. These triple divergences strongly suggest exhaustion of the current rally.
Confluence 6: Fibonacci Resistance Zone
The 0→3.1 Fibonacci retracement shows point 4 falling precisely into the 0.62-0.79 "reversal zone" - a high-probability area for trend continuation after retracements.
Web Research Findings:
- Technical Analysis: VIX below 20 indicates market stability , currently at 18.73 resistance
- Recent News/Earnings: Fed cut rates by 0.25% to 4.00%-4.25% range on September 17
- Analyst Sentiment: October VIX futures trade at significant premium to September, suggesting post-Fed turbulence ahead
- Data Releases & Economic Calendar: Next FOMC meeting scheduled for October with markets pricing additional cuts
- Interest Rate Impact: Fed indicated two more cuts in 2025, taking funds rate to around 3%
Layman's Summary:
The Fed just cut rates and markets initially calmed down, pushing VIX lower. However, traders are betting on increased volatility in October (after the next Fed meeting). Right now, VIX is testing a proven resistance level where sellers have won before. With the market showing complacency and technical indicators screaming "overbought," this looks like a perfect spot for volatility to get crushed again before any October drama unfolds.
Machine Derived Information:
- Image 1: 4-hour VIX showing numbered pattern with clear resistance at 18.73 - Significance: Confirms seller dominance pattern - AGREES ✔
- Image 2: 4-hour with support/resistance bands showing 18.73 as key level - Significance: Multiple touches confirm resistance strength - AGREES ✔
- Image 3: 4-hour with volume profile showing gap above current levels - Significance: Lack of support for breakout attempts - AGREES ✔
- Image 4: Pitchfork analysis showing upper parallel resistance - Significance: Dynamic resistance confluence - AGREES ✔
- Image 5: Fibonacci and momentum indicators showing overbought divergences - Significance: Multiple reversal signals aligning - AGREES ✔
Actionable Machine Summary:
All five chart images confirm the same story: VIX is hitting major resistance at 18.73 with multiple technical rejections signals firing simultaneously. The volume structure shows no support above, momentum is exhausted with divergences, and the pitchfork/Fibonacci levels all converge at this exact zone. This is a textbook short setup with exceptional confluence.
Conclusion:
Trade Prediction: SUCCESS
Confidence: High
This VIX short setup offers exceptional risk/reward with a stop just above 20 (psychological resistance) targeting 15-16 initially and potentially 13 on extended weakness. The combination of confirmed seller dominance, technical resistance confluence, and exhausted momentum creates a compelling short opportunity. With October volatility concerns still weeks away, there's ample time for complacency to return and crush VIX back to recent lows.

Volmageddon 2.0 in the making.....must watch!I have been saying this for months! Keep an eye on the VIX, always! Yes, it's been down for 5-6 months in a very unnatural way, but things are about to take a turn and potentially in a big way. Ultra-high valuations, crap unemployment, defaults through the roof, PE/CAPE ratios at historic levels, and highest concentration / weight in the stock market. 10 tech companies buying from each other like very good friends with 100% capex that hasn't been spent = 40% of S&P, seriously, WTF! In any case, it's not rosy, and we are overdue a massive spike in the VIX. Use the proxy ETF CBOE:UVIX and add alerts. Best of luck!
$VIX trending up nicely.....buckle your seatbeltVIX has been on the downside for the last few months, mostly because of much f$ckery in the market that is running super hot. I would not be surprised if it crosses 20 this week! You can use UVIX as the proxy. Best of luck! This could be magical

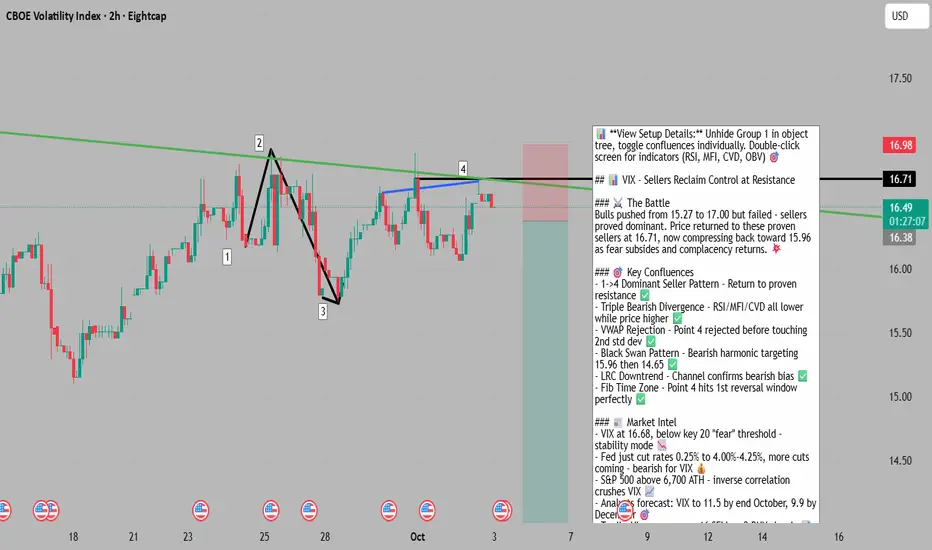
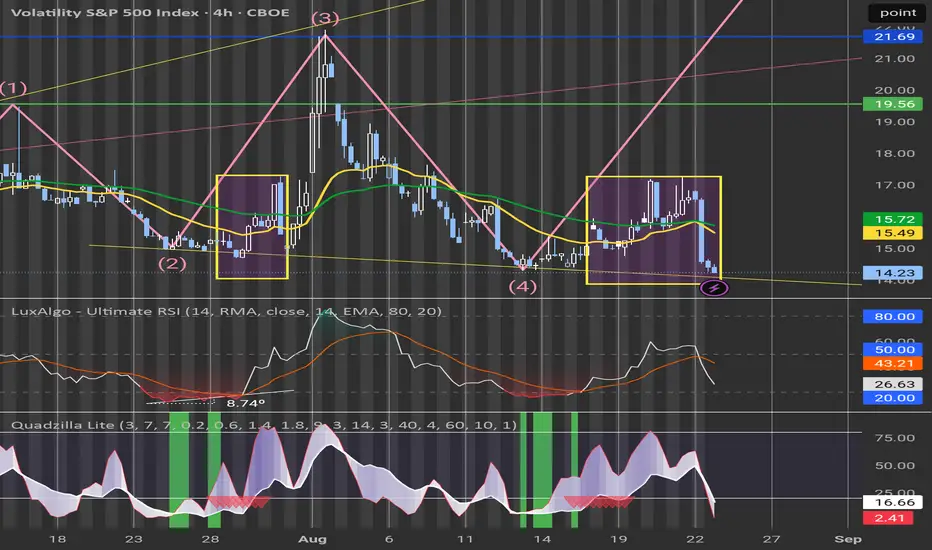
Sellers Reclaim Control at Key Resistance - 15.96 Beckons📊 **To view my confluences and linework:**
Step 1️⃣: Grab the chart
Step 2️⃣: Unhide Group 1 in the object tree
Step 3️⃣: Hide and unhide specific confluences one by one
💡 **Pro tip:** Double-click the screen to reveal RSI, MFI, CVD, and OBV indicators alongside divergence markings! 🎯
Title: 🎯 VIX: Sellers Reclaim Control at Key Resistance - 15.96 Beckons
The Market Participant Battle:
After bulls made a valiant push from point 1 (15.27) to point 2 (17.00), they've been systematically rejected at the 16.70-16.96 resistance zone. When price broke below point 1 to create point 3 (15.80), the sellers proved themselves as the dominant force in this local scope. Now at point 4 (16.71), we're witnessing the return to these proven sellers - a classic "dominant players reclaim control" setup. The bullish volatility spike has been absorbed, and the market expects price to compress back toward 15.96 and potentially lower as fear subsides and complacency returns. 💥
Confluences:
Confluence 1: Double Bottom / Black Swan Pattern Recognition (2H Chart)
The 2-hour chart reveals competing harmonic patterns - a Double Bottom formation (bullish) versus a Black Swan pattern (bearish). The Double Bottom entry sits at 16.47 with targets at 17.84 and 20.57, while the Black Swan pattern shows entry at 16.61 with bearish targets at 15.96 and 14.65. Current price action at 16.68-16.71 sits precisely between these two pattern entries, but the rejection from the upper trendline resistance and the formation of point 4 below the 2-hour resistance band strongly favors the Black Swan bearish scenario. The pattern table shows both setups are mature (94% and 81% age), indicating imminent resolution. ⚖️
Confluence 2: 1->4 Dominant Player Pattern (All Timeframes)
The text annotations explicitly outline the setup: when number 3 closed below number 1, number 2 became proven as a set of dominant sellers in the local scope. At number 4, we're returning to these proven sellers. This is textbook market structure - price tested higher, failed, and now we're back at the scene of the crime where sellers previously exerted control. The VWAP rejection at number 1 and the subsequent rejection at number 4 before even touching the 2nd standard deviation reinforces this narrative. 📉
Confluence 3: RSI/MFI/CVD Bearish Divergence (4H Chart)
Image 4 and 5 show the smoking gun: while price makes a higher high from point 1 to point 2, the RSI, MFI, and CVD all make lower highs. This triple bearish divergence is a powerful signal that the buyers are exhausting themselves. The volume histogram shows diminishing commitment on the bullish moves, while the "Bear" labels on the RSI overlay confirm the momentum has shifted. When all three momentum indicators align in divergence, it's a high-probability reversal signal. 🔴
Confluence 4: VWAP Standard Deviation Rejection
Point 1 sits right at VWAP, and crucially, point 4 rejected before even touching the 2nd standard deviation band. This shows institutional reluctance to push volatility higher. The VWAP area (15.27-16.00 zone) represents fair value, and price keeps getting pulled back toward it like a rubber band. Going below the 1st standard deviation into the VWAP area is the path of least resistance. The market is screaming "mean reversion" here. 🎯
Confluence 5: Linear Regression Channel (LRC) Downtrend Formation
Using major and minor highs, we can see a possible downtrend forming via LRC analysis. The channel suggests that even if we see bounces, they'll be contained within the descending envelope. This provides both directional bias (down) and potential resistance zones for any counter-trend moves. 📐
Confluence 6: Fibonacci Time-Based Reversal Zone
Using trend-based Fibonacci time projection on the major swing up from point 1 to point 2, point 4 falls into the 1st potential reversal point in regards to time. This time confluence adds another layer - not only is price at a key level, but the timing aligns with typical reversal windows. Time and price confluence creates high-probability trade zones. ⏰
Web Research Findings:
- Technical Analysis: VIX currently trading around 16.49-16.68, below the key 20 threshold that indicates market stability. The index has been in an unprecedented period of suppression, with record low volatility readings across multiple timeframes. TradingView consensus shows 16 'sell' signals vs only 2 'buy' signals as of early September. 📊
- Recent News/Earnings: Fed cut rates by 0.25% to 4.00%-4.25% range on September 17, 2025. Markets initially calmed after the rate cut, which is bearish for VIX. S&P 500 just closed above 6,700 for the first time, showing strong equity market confidence which inversely correlates with VIX. Government shutdown underway but markets shrugging it off, expecting brief duration. 📰
- Analyst Sentiment: Wallet Investor projects VIX futures averaging 11.5 in October 2025, falling to 9.9 by December. J.P. Morgan Research notes that global equity volatility has normalized after April's tariff shock, with US volatility expected to decline moderately. October VIX futures trade at premium to September, but overall forecast remains bearish for volatility. Multiple analysts calling for VIX compression toward low teens. 📉
- Data Releases & Economic Calendar: Next FOMC meeting scheduled for November 6-7, 2025 (no October meeting per Fed calendar). Fed has indicated two more rate cuts in 2025, taking funds rate to around 3%. Jobs report and inflation data due in early October, but market expectations are stable. No major catalysts scheduled that would spike volatility. 📅
- Interest Rate Impact: Fed in easing mode with September rate cut and guidance for further cuts. Lower rates = higher stock prices = lower VIX. The "Fed put" is back in play, which historically suppresses volatility as traders believe downside is protected. Rate cut cycle just beginning supports continued VIX compression. 💰
Layman's Summary:
Here's what all this research means for your short VIX trade: The Federal Reserve just cut interest rates and plans to keep cutting, which makes investors feel safer and reduces fear in the market. When people aren't scared, the VIX (the "fear gauge") goes down. The stock market just hit all-time highs above 6,700, which is the opposite of fear. Analysts are forecasting VIX to fall to around 11.5 by the end of October and even lower by December. There are no major scary events on the calendar for October that would spike volatility - no Fed meetings, no major economic releases that markets aren't already expecting. Even the government shutdown is being shrugged off. The technical analysts overwhelmingly have "sell" signals on VIX right now. All of this creates a perfect storm for VIX to drop back toward 15.00 and potentially lower. Your short makes fundamental, technical, AND sentiment sense. ✅
Machine Derived Information:
- Image 1 (2H Chart with Risk/Reward Boxes): Shows numbered pattern 1-4 with clear position sizing - STOP at 17.27, ENTRY around 16.61-16.47, TARGET at 15.96. Risk/reward ratio displayed as 4.15. Current price testing the green zone resistance. - Significance: Clean risk management setup with favorable R/R, price at decision zone - AGREES ✔
- Image 2 (2H Pattern Recognition Table): Displays both Double Bottom (long, entry 16.47) and Black Swan (short, entry 16.61) patterns with maturity scores of 94% and 81%. Shows multi-timeframe trend analysis strongly uptrend on lower timeframes. - Significance: Competing patterns but current rejection favors bearish Black Swan scenario - AGREES ✔ (with bearish interpretation)
- Image 3 (2H Cleaner View): Shows the 1-4 numbered pattern with Double Bottom and Black Swan pattern labels, price in the decision zone between pattern entries. - Significance: Visual confirmation of the battle zone, price behavior favoring sellers - AGREES ✔
- Image 4 (4H Divergence View): Shows points 1-4 with RSI and MFI indicators below, clear "Bear" labels on RSI, volume histogram showing declining bullish commitment. Text annotations explain the divergence setup. - Significance: Triple bearish divergence (price, RSI, MFI, CVD) is textbook reversal signal - AGREES ✔
- Image 5 (4H Second Divergence View): Duplicate of Image 4 showing same divergence patterns, confirming the analysis wasn't a fluke but a persistent signal. - Significance: Confirmation of divergence structure across multiple indicators - AGREES ✔
- Image 6 (4H Detailed Annotations): Shows black VWAP lines, colored zones, and multiple technical levels. Text explains: "when 3 closes below 1, number 2 becomes proven sellers... at number 4 we return to these proven sellers." - Significance: Core narrative confirmed - dominant player identification and return to proven sellers - AGREES ✔
- Image 7 (4H LRC & Fibonacci Zones): Displays Linear Regression Channel with red/blue shaded zones showing potential downtrend formation, points 1-4 clearly marked. Text notes "using LRC with major and minor highs, we see a possible downtrend forming." - Significance: Adds directional bias and resistance zones for mean reversion - AGREES ✔
Actionable Machine Summary:
All seven chart images paint a unified bearish picture for VIX. The numbered pattern 1->4 shows a classic "return to dominant sellers" setup, confirmed by VWAP rejection, triple bearish divergences across RSI/MFI/CVD, and LRC downtrend formation. The risk/reward is clearly defined at 4.15:1, with stops at 17.27 and targets at 15.96 (then 14.65). The competing harmonic patterns (Double Bottom vs Black Swan) are resolving in favor of the bearish Black Swan scenario based on price action rejections. Every technical indicator—momentum, volume, pattern recognition, and market structure—agrees that VIX should compress lower from this zone. The time-based Fibonacci adds confluence that this is the optimal reversal window. Entry zone 16.47-16.71, stop above 17.27, target 15.96 first, then 14.65. The machine-derived analysis supports the trade thesis completely. 🤖✅
Conclusion:
Trade Prediction: SUCCESS ✅
Confidence: HIGH 💪
Key Reasons for Success:
1. **Dominant Player Narrative Confirmed**: Price structure clearly shows sellers proved dominance at point 2 (17.00), and point 4 (16.71) represents the return to these proven sellers. This setup has high success rate when properly identified.
2. **Triple Bearish Divergence**: RSI, MFI, and CVD all showing lower highs while price made higher high - this is one of the most reliable reversal signals in technical analysis.
3. **Web Research Overwhelmingly Bearish for VIX**: Analysts forecasting VIX to drop to 11.5 by end of October, Fed in easing mode, S&P 500 at all-time highs, no major fear catalysts on calendar. The fundamental backdrop couldn't be better for a VIX short.
4. **Risk/Reward Highly Favorable**: At 4.15:1 R/R, even if only partially successful, the trade math works beautifully.
5. **Multiple Timeframe Confirmation**: The setup works on 2H, 4H, and aligns with higher timeframe trends showing VIX mean reversion.
Risk/Reward Assessment:
With stops at 17.27 and first target at 15.96, you're risking approximately 0.60 points to make 2.49 points - exceptional R/R. If VIX drops to analyst forecasts around 14-15 range, the reward could be 2-3x the risk. The stop is logical (above recent highs and pattern invalidation), and the target is based on structural support and VWAP.
Final Recommendation: TAKE THE TRADE 🎯
This is a high-quality, well-structured short volatility setup with excellent risk/reward, multiple technical confluences, and strong fundamental/sentiment support. The dominant player narrative (sellers proven at point 2, return at point 4) is crystal clear. The bearish divergences across momentum indicators provide high-confidence reversal signals. Web research confirms the macro environment is hostile to elevated volatility - Fed easing, stocks at ATHs, no major catalysts ahead.
Execution Plan:
- Enter: 16.47-16.71 zone (current area)
- Stop Loss: 17.27 (above recent highs and pattern invalidation)
- Target 1: 15.96 (structural support, 1st Fibonacci level)
- Target 2: 14.65 (Black Swan pattern target)
- Consider taking partial profits at T1 and letting remainder run to T2 with trailing stop
The trade checks all boxes: narrative, technicals, fundamentals, sentiment, and risk management. Trade with confidence, but manage size appropriately given VIX can spike unpredictably on news. 🚀💰
Market Volatility: Introduction and Types1. Introduction to Market Volatility
1.1 Definition of Market Volatility
Market volatility refers to the rate and magnitude of price fluctuations in a financial market over a given period. It is a measure of the risk or uncertainty associated with the changes in the value of assets, securities, or an index. High volatility indicates rapid and large price swings, while low volatility suggests relatively stable prices.
In simple terms, volatility shows how “wild” or “calm” a market is. It is an essential concept for traders, investors, and policymakers because it influences investment decisions, risk management, and market stability.
1.2 Importance of Understanding Market Volatility
Market volatility is not inherently negative; it has both risks and opportunities:
For Investors: Helps in portfolio diversification and managing risk.
For Traders: Offers opportunities for profit from price swings.
For Policymakers: Signals economic uncertainty, financial stress, or speculative bubbles.
For Risk Managers: Enables designing hedging strategies to minimize losses.
Volatility often increases during economic crises, geopolitical tensions, or major policy changes, making its monitoring critical.
1.3 Measuring Market Volatility
Volatility can be measured statistically or derived from market instruments:
Statistical Measures: Standard deviation, variance, beta coefficient.
Implied Volatility: Derived from options pricing models (e.g., Black-Scholes).
Volatility Indices: Like VIX, which reflects the market’s expected future volatility.
Understanding measurement techniques is crucial because they allow investors to quantify uncertainty and price risk more effectively.
2. Types of Market Volatility
Market volatility can be classified into various types based on time horizon, causes, and nature. Understanding these types helps investors and traders adapt strategies to market conditions.
2.1 Historical Volatility
Historical volatility measures past price movements over a specific period.
Calculation: Standard deviation of returns from historical price data.
Use Case: Helps predict future risk based on past trends.
Limitation: Past performance may not always indicate future volatility.
Example: The standard deviation of daily returns of the S&P 500 over the last 30 days.
2.2 Implied Volatility
Implied volatility (IV) is forward-looking, derived from options prices.
Definition: The market’s expectation of the asset’s future volatility.
Calculation: Using options pricing models like Black-Scholes.
Significance: High IV indicates markets expect large price swings, low IV indicates stability.
Example: A sharp increase in VIX reflects high implied volatility for the S&P 500.
2.3 Historical vs. Implied Volatility
Feature Historical Volatility Implied Volatility
Basis Past price data Options prices (future expectation)
Nature Backward-looking Forward-looking
Use in Trading Risk measurement Pricing and hedging
Limitation May not reflect sudden shocks Dependent on market perception
2.4 Market Volatility Based on Frequency
Volatility can also be classified by how often price swings occur:
Short-term Volatility:
Daily or intraday price fluctuations.
Important for day traders and scalpers.
Medium-term Volatility:
Weekly or monthly swings.
Crucial for swing traders and short-term investors.
Long-term Volatility:
Yearly or multi-year fluctuations.
Significant for long-term investors and fund managers.
2.5 Structural Volatility vs. Event-Driven Volatility
Structural Volatility:
Caused by long-term economic, policy, or market structure changes.
Example: Deregulation, introduction of new financial instruments.
Event-Driven Volatility:
Triggered by specific events, usually sudden and short-lived.
Example: Earnings announcements, geopolitical conflicts, central bank rate decisions.
2.6 Sector-Specific vs. Market-Wide Volatility
Sector-Specific Volatility:
Affects specific industries or sectors.
Example: Oil price shocks affecting energy stocks.
Market-Wide Volatility:
Affects the entire market or economy.
Example: Global financial crisis, pandemic-induced market crashes.
2.7 Volatility Based on Price Direction
Symmetric Volatility:
Price swings equally likely upwards or downwards.
Example: Stable markets with balanced buying and selling pressure.
Asymmetric Volatility:
Price swings more pronounced in one direction.
Example: Markets react more sharply to negative news than positive news (leverage effect in stocks).
2.8 Measured vs. Perceived Volatility
Measured Volatility:
Quantitative, calculated using historical price data or standard deviations.
Perceived Volatility:
Psychological perception of risk by investors.
Influenced by media, rumors, and sentiment.
2.9 Other Specialized Types of Volatility
Exchange Rate Volatility:
Fluctuations in currency markets, impacting global trade and investment.
Commodity Price Volatility:
Price swings in commodities like oil, gold, or wheat, often due to supply-demand imbalances.
Interest Rate Volatility:
Fluctuations in bond yields or central bank rates affecting bond markets, equities, and currencies.
Equity Market Volatility:
Swings in stock prices or indices, influenced by earnings, macroeconomics, or speculation.
3. Factors Influencing Market Volatility
Macroeconomic Indicators: GDP growth, inflation, unemployment rates.
Monetary Policies: Central bank interest rate changes, liquidity injections.
Political Events: Elections, geopolitical tensions, trade wars.
Global Shocks: Pandemics, natural disasters, oil crises.
Market Structure: Liquidity, trading volume, leverage, and derivatives use.
Investor Behavior: Herd mentality, fear, greed, and speculative activity.
4. Volatility in Financial Markets
4.1 Equity Markets
Equities often show high volatility due to earnings reports, news, and macroeconomic conditions.
4.2 Bond Markets
Bonds are generally less volatile but sensitive to interest rate changes and credit risk.
4.3 Forex Markets
Currency markets are highly volatile due to global trade, interest rate differentials, and political risk.
4.4 Commodity Markets
Commodity prices fluctuate due to supply-demand imbalances, geopolitical tensions, and speculative trading.
5. Implications of Market Volatility
For Traders: Opportunity for profit through short-term trading strategies.
For Investors: Risk management through diversification and hedging.
For Policymakers: Indicator of financial stability and economic stress.
For Economists: Understanding cycles of boom, bust, and correction.
6. Conclusion
Market volatility is an intrinsic characteristic of financial markets, reflecting the dynamic interplay of economic, political, and behavioral factors. Recognizing its types, measurement methods, and underlying causes enables participants to navigate markets more effectively, optimize risk-adjusted returns, and anticipate potential disruptions.
Volatility, when understood and managed correctly, transforms from a source of fear to a tool for opportunity, making it central to modern finance.
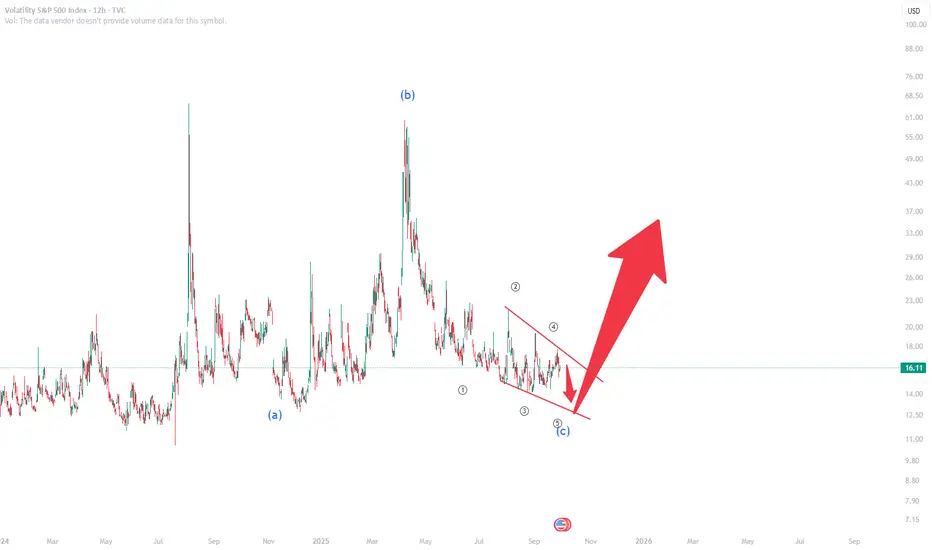
VIX Index – Elliott Wave Analysis: Diagonal C CompletionThe VIX index is finalizing an A-B-C corrective structure, with the C-leg forming as a diagonal. Price action suggests this structure is close to completion. Once the diagonal ends, the probability of a sharp upside move in volatility becomes highly likely.
Why does this matter?
A rising VIX reflects fear and risk aversion in the market.
Historically, VIX moves inversely with equities – higher volatility often coincides with S&P 500 weakness.
When VIX breaks out, it signals hedging demand and uncertainty, pushing option premiums higher and increasing market stress.
📌 Trading view: A confirmed breakout from the diagonal would mark the start of a new impulsive leg higher in volatility. This could align with risk-off flows in equities and broader corrections across risk assets.
Patience and confirmation remain key — once VIX turns, it usually accelerates quickly, not quietly.
VIX caution> 16.50 ... slightly bearish (rising VIX)
< 15.99 ... bullish
this is how i'm measuring fear/greed/volatility. last week we were over 17 for a bit. will data or headlines cause us to rise over 17 again this week or next?
hmmmm.... we shall see.
*NFLX keeps playing around 1200. just break down... ugh. lol
*AAPL has been wilding out. cool off if VIX riseses?

Market is awfully bullishThe market in general is very bullish with many indices moving up higher and higher, but the price of gold has also been moving up higher which historically this doesn't end well. This could also mean that many allocation models have funds and liquidity being put into them. The bullish momentum can still continue but this is mainly year end flows following bullish sentiment into record highs along with the recent fed rate cut.

VIX USFA Lights out 9/19/2025 BLACKSWAN PREDICTION
First time in recorded History that Saturn
Will be its closest from earth combined
With a Partial solar eclipse the 9/21/2025
All happening the day before
"Market Maker Day"
global derisking potential
only if sustained over 19,91
Crazy shit is possible
23days after VIX palindrom anniversary
Chritmas Kiss of death expected
@Hanslanda369

VIX caution signal?Noticed that we closed above the 50 on the RSI... on the day and 1hr chart.
>16 caution
>17... it's higher than 16 so the VIX is rising; caution x2
>20 = elevated VIX
P.S. I noticed that the Fear & Greed index is at greed.
www.cnn.com

What will happen to VIX after another crappy jobs report today?While there is no crystal ball, the jobs market is beyond horrible and many precursors to a massive pullback on coming together; credit defaults, unemployment (after several revisions, each one worse than the last one), China pulling back on US based AI tech (what AI bubble?), and valuations that peak dot.com bubble. The VIX has been unnaturally low, hedge funds are shorting it!, and let's not forget volmaggedon! Could spike any second and it likely will before people get too complacent. This is a recipe for v-maggedon 2.0. Bullish on the economy, but not blind to facts and historical standards when things look very wonky. Best of luck out there! Everyone is a genius when the market is up :)
VIX spiking....PEEKA BOOTVC:VIX (proxy CBOE:UVIX ) is crossing up key technicals and looks like there is a nice upside. Much of the news hasn't reported that the rate cuts have "already" been priced-in, which is a nice recipe for volatility to spike as people make big moves (mostly sell). Again, 99% of sell orders from insiders are SELL, and congress members are putting PUT options orders too. It also doesn't help that China is not buying NVDIA, which was a big reason for the upside and that has completely faded out. Where do you go when the MARKET has reached the ceiling?
Best of luck and always hedge your positions! VIX / UVIX now has an awesome beta and upside.

VIXSuccess in forex and stocks comes from a combination of knowledge, discipline, and patience. Understanding market trends, economic factors, and company fundamentals is crucial, but equally important is controlling emotions and sticking to a well-planned strategy. Continuous learning, adapting to changing conditions, and managing risk wisely can turn opportunities into consistent growth over time. Consistency, not luck, separates successful traders from the rest.
VIX looking real sweet now before tomorrow's Job numbersIf you're looking for a nice upside before things get wonky, then look at the $VIX! It's starting to tick-up from all the complacency - folks buying at all time high with insane valuations just not supported historically. The jobs numbers is expected to look pretty grim tomorrow, and with that the market can correct itself. The proxy for TVC:VIX is $UVIX. If you need help, just check the ultrabuy / short signals and you should be fine! Best of luck and stay active in the market otherwise you could be a bag holder for a while, and that's not fun!
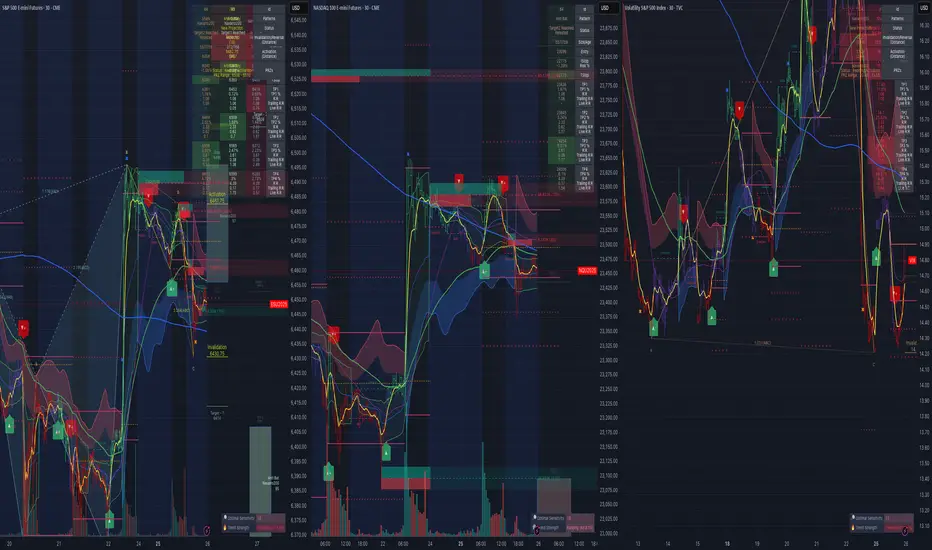
US500, USTECH, US30 & VIX Daily Trade SetupsIn this update we review the recent price action in the SP500, Nasdaq, DowJones & VIX identifying the next high-probability trade setups and price objectives to target. To review today's video analysis, click below!

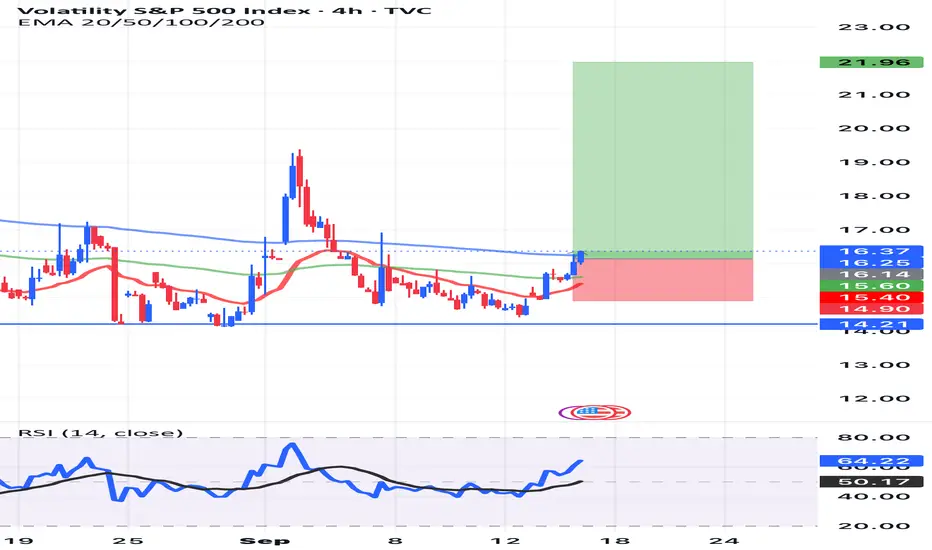
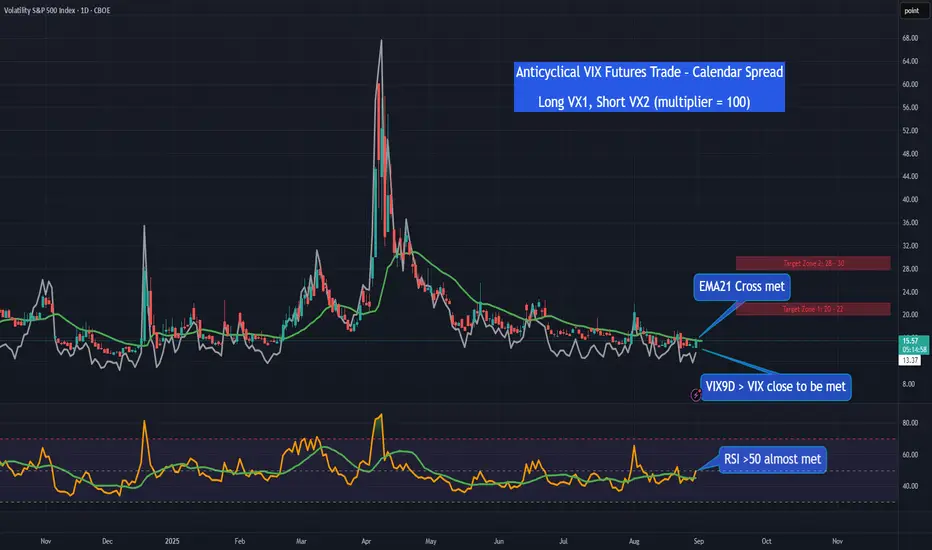
Anticyclical VIX Futures Trade – Calendar SpreadVIX has drifted into complacency territory with stretched short positioning, steep front-end contango, and seasonal factors lining up. Instead of outright longs, a VX1–VX2 Calendar Spread offers cleaner exposure to rising volatility and curve normalization.
Setup
• VIX near equilibrium range (12–15%), entering complacency.
• Futures curve in steep contango → negative carry on outright longs.
• Short positioning at multi-year highs, vulnerable to squeeze.
• Seasonality favors higher VIX.
• Index volatility suppressed, single stocks trading erratically.
Trade Idea
• Long VX1 / Short VX2 (multiplier = 100).
• Benefits from both rising volatility and front-end curve flattening.
• VX1 outperforms VX2 in a spike; VX2 cushions VX1 in grind-lower scenarios.
Entry Triggers
• VIX9D > VIX.
• VIX crossing EMA20/EMA50.
• RSI(14) on VIX > 50.
• SPX daily short setup.
Target
• Target zone to be reached before VX1 expiration.
• Target zone 1: VIX in range 20 - 22, target zone 2: VIX in range 28 – 30
Exit
• On VX1 expiry: VX1 converges to the VIX. VX2 becomes front month. If the position is left open, it effectively becomes a short front-month future and must be re-evaluated.
• Alternatively, close at VIX Index in specified target zone or discretionary, depending on SPX price action (i.e. SPX bouncing back after a dip).
Risk
• Do not over-leverage.
VIX looking real sweet now (use UVIX as proxy)For those tracking macros and true diversification, this is a potential nice play with a massive upside. Look at last year around July 17th. We are nearing this. Historically, the VIX bottoms out around 17-18 and it's sitting at 15. It doesn't stay in this region for too long. Most macros are looking extremely brittle and cracks are forming everywhere. I'd argue that the macros look worse now than in early 20202. Track this, put alerts on, use whatever technical you prefer, but this will spike and it's a massive upside. Some use UVIX as the proxy for the VIX :) Best of luck and always take calculated risks. If not, just go to your trusty bank and get 0.02% return annually!

IB EMA5 cross HP AHProj LuxAlgoGo long when the EMA 5 crosses above the EMA 65, and exit the long position when it crosses back below. This setup is combined with the harmonic pattern drawing a downward line, and it triggers when price touches the LuxAlgo support band.
$VIX.US tere might be something hiding in the water many missed We will focus on the candle formation for July 30th wednesday, July 31st Thursday, and July 32nd Friday. We will compare these dates to August 20th Wednesday, the 21st thursday and the 22nd Friday.
I have been following it since I spotted it few days ago to see if it checks out, and sofar its been playing out candle for candle. If you go to the Daily and the 4h chart and focus on the July dates you might notice something very similar to what we had this Friday, a big drop. Now that is exactly what I was hoping for personally. It dropped bellow its previous low, and in theory should bounce off the bottom limit of the 5 wave megaphone which would signal a possible sharp rise in Vix and a sharp drop in SPY furthermore validating the pattern that im speculating is going to play out by October.
VIX & Nvidia Daily Trade SetupsIn this update, we review the recent price action in the VIX & Nvidia and identify the next high-probability trade setups and price objectives to target. To review today's video analysis, click here!
