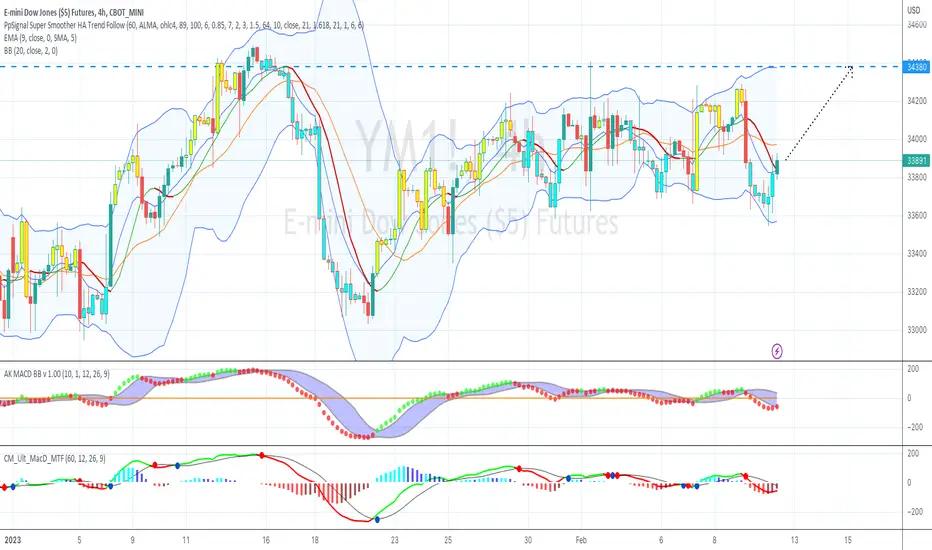
YM1! US30USD DOW 2023 FEB 27
YM1! US30USD DOW 2023 FEB 27
No trades for Dow last week.
Possible scenarios:
1) Rotational play: Trades can be executed at boundary of rotation
range 34605 / 32789
2) Supply takes control = short on test and reject of 32789
Volume Analysis:
Weekly: Lower vol down bar close toward low = minor supply
Daily: Ave vol down bar close toward low = minor supply
H4: UHV vol up bar + level close up bar close toward low = supply > demand
Price reaction levels
Short on Test and Reject | Long on Test and Accept
35750 35228 34605
32789 30513 28635
Remember to like and follow if you find this useful.
Have a profitable week ahead.
Micro E-mini Dow Jones Industrial Average Index Futures
No trades
Trade ideas

DOW JONES wave Y in progress
we are going to follow how price going to react at the critical support of wave W if price could bounce from that level it could be ended a of wave Y then we will follow wave b of Y

DJIA Is Hunting Support at 31000-32000 AreaDJIA going down for C wave. So the correction is not done yet it seems. I think that commodity currencies can make deeper pullbacks then; AUD, NZD will be my favorite ones for longs (longer-term) when this correction on DJIA unfolds.

Bearish Weekly Sentiment for DOWAfter range bound weeks of trading and a news heavy week from Wed-Thu, I'm expecting a rise in price to meet and Orderblock/ Break Block, FVG, and OTE confluence before selling off towards weekly low targets. High of the week can typically be expected around Tues-Wed so I'll be looking for bullish setups to start the week and increased volatility to take us to the order block before a sharp or explosive sell off from Core PCE and such. Curious to what setups or ideas you guys have. First time publicly marking up. I'm very fond of liquidity found from Friday's price action that left a magnitude of trend line liquidity and unprotected lows in the market. I would like to see Sunday open down and Tuesday start the movement higher. CBOT_MINI:YM1!

YM1! US30USD DOW 2023 FEB 20
YM1! US30USD DOW 2023 FEB 20
Finally we see some movement from Dow.
34605-34432 rotational play based on 06 Feb's analysis garnered.
Possible scenarios:
1) Rotational play: Trades can be executed at boundary of rotation
range 34605 / 32789.
Note: 34605-34432: If market trades toward the upper boundary =
possibility of breakout
2) Rotational breakout/breakdown:
- If price breakout, long when price retraces and finds support
Volume Analysis:
Weekly: Ave vol down bar close below middle = minor supply
Daily: Ave vol up bar, demand overcoming supply = demand
H4: Ave vol up bar close toward high = minor demand
Price reaction levels
Short on Test and Reject | Long on Test and Accept
35750 35228 34432-34605
33624 33037- 32789
Remember to like and follow if you find this useful.
Have a profitable week ahead.


ym willl riseAs you can see here I recommend buying ym.
place the srop loss and take profit as shown in the chart.

US30 Short-Term Bullish AnalysisClick on Boost (like) to support these free analyses
This expectation is a framework to look for a potential trading setup; I recommend you to not just execute based on these levels. I always wait for confirmations on lower timeframes
This Analysis was done using my complete Strategy which includes:
- Smart Money Concepts
- Multi Timeframe Liquidity and Market Structure
- Supply And Demand
- Auction Theory
- Volume Analysis
- Footprint
- Market Profile
- Volume Profile
- Wyckoff
- Etc.

Calling everysingle pivot, but where is going right now? no ideano single clue
no idea
anything
up
or
down
that's it
maybe up
but how much?
a few tick?
new high?
but we have liquidity down below
so whattttt
$PIVOTS $$$$$$$$$$$$$$$

Dow Jones, US30, YM trade idea after CPI I see high confluence between a lot of my charts, taking this trade with 1% risk and trying to go for a 1=4 RR. Let's see how it goes,

Dow 30 - Potential Upward MovementDow 30 EMA about to cross HA Trend Follow updwards. Exit at upper BB
US30 TRADE IDEAWE were expecting price to react to our key levels 33800 if we hold this level 34200 is possible or else, we can see downfall towards our key level 33580.

dow jones us 30 long setupit seems dow is the strongest today
therefore the value rotaion might be a better play in dow.

Dow, for the ones who do not believe in diagonal lines. Simple horizontal lines.
Simple diagonal lines.
Both work, deal with it.

YM1! US30USD DOW 2023 FEB 06
YM1! US30USD DOW 2023 FEB 06
No trades taken for Dow last week as price stayed away from the
boundary of the rotation zone. We now have a rotation within
a rotation zone 34432-33624 :)
This is about 800pt range.
A modest upward trendline has formed, but but but demand is
is showing effort no result.
The 800pt range, although attractive, will unlikely be easy to trade.
Possible scenarios:
1) Rotational play: Trades can be executed at boundary of rotation
range 34605 / 32789.
- 34605-34432: Consideration - will market trace Nasdaq & SnP
for a breakout?
- Short if rejected at 34605-34432
2) Rotational breakout/breakdown:
- If price breakout, long when price retraces and finds support
Volume Analysis:
Weekly: Ave vol down bar close in middle = indecisive
Daily: Higher vol down bar close of low = some demand
H4: Ultra hi vol level bar, S>D = Supply coming in
Price reaction levels
Short on Test and Reject | Long on Test and Accept
35750 35228 34432-34605
33624 33037- 32789
Remember to like and follow if you find this useful.
Have a profitable week ahead.


Dow Jones: Friday Feels 🍾After moving sideways, the Dow Jones should finally commit to dropping to the orange target zone. Within 32 401 and 31 689 points, the Index should hit the corrective low of the orange wave iv, which would turn the trend back North. On that note, we expect the course to rise above the resistance line at 34 707 in order to complete the blue wave (i). In our alternative scenario with a probability of 45%, the Dow Jones could exceed the resistance mark at 34 707 points right away, without dropping into a correction beforehand.


YMCBOT_MINI:YM1!
has been lagging, needs to catch up
nice vwap bounce seen multiple times.
can see 34548 on the next leg upside
else back to support of
34000,
33700

Dow Futures - Consolidative double three corrective waveThe Dow futures is heading for another upside. Will it be a 3rd wave is too early to tell but all we know is that 1) the correction is yet to be over, likely 33,205 support is the strong rebound region. 2) 36,000 resistance will be a strong resistance.

Feb starting with BEAR in action. See description.Here my vision last night with DOWNJones and operating WING23 (Brazil Futures).
Great Day.

DOW 1 HOUR : UPPER TARGET IS 35300 AND DOWN TARGET IS 31111we have 3 angeel on dow and look like want go to fibo161%(nasdaq too,,have buy ) dont pick sell more ,,,for sell we need dow break RED TREND LINE
buystop on high + buy above green arrow near EMA200 1hour is best action for now
if you have old sells, 100% put hedge buystop on last high and never never close it (main trend is up) , break 3angel will flyup dow ,,,,, then in next low close your sells frist,then in high close hedge buy
ALERT = INDEX LIKE NASDAQ,DOW,DAX ARE VERY COMPLEX,HARD NEED MINIMUM 5 YEAR PRACTICE ON DEMO ,if you dont have 5 year practice dont trade it in real money
good luck

One of my favorites setups
1) 0.5 retracement
2) avwap
3) strong leg in the pullback
4) up slope median line
