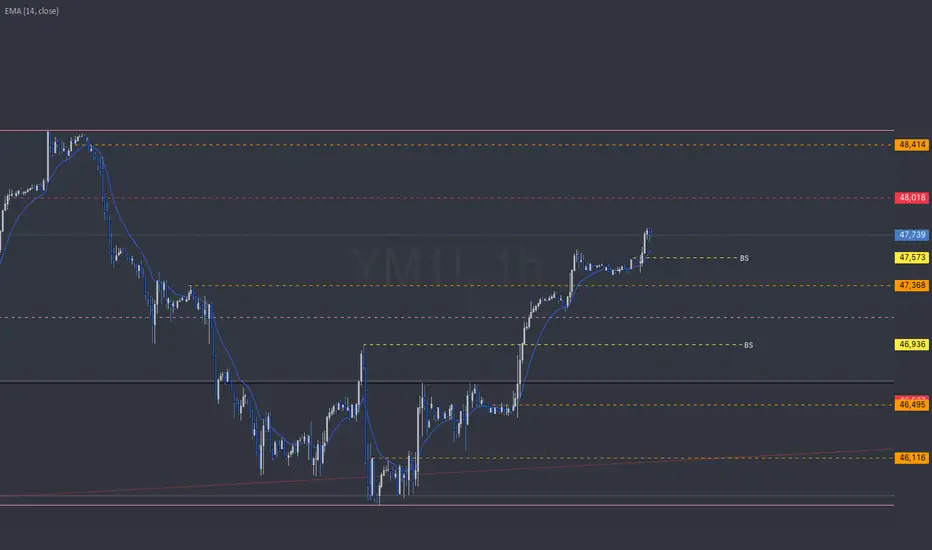
YM | Week 52 | 1hr chartT.A explained -
BackSide (BS)
FrontSide (FS)
Inverse BS (Inv.BS)
Inverse FS (Inv.FS)
BS & FS levels are expected support when dashed lines, tested when dotted and resistance when solid lines.
The inverse is true for the Inv. BS Inv. FS levels, they are resistance as dashed lines, tested as dotted
Micro E-mini Dow Jones Industrial Average Index Futures
No trades
Related futures

YM1! DOW JONES E-MINI FUTURES - THE POST-FED BLUEPRINTDecember 10, 2025 | by officialjackofalltrades
🟢 BULLISH | Fed's "Hawkish Cut" Creates Opportunity
EXECUTIVE SUMMARY - THE FED DECISION IS IN
Current Price: $47,913 | Date: December 10, 2025 - POST-FOMC
The Dow Jones E-mini futures just experienced a historic moment :
The Dow gained 4

Dow Futures (YM) Bullish Path Projects 49,900 LevelThe cycle from the April 2025 low in Dow Futures (YM) continues to unfold as a clear impulse. Within this structure, wave (4) concluded at 45,810, as illustrated by the one‑hour chart. Following that completion, wave (5) began to develop as another sequence of five waves of lesser degree. From the t

Pressing resistance as momentum favors upside continuation
Current Price: 48,134.89
Direction: LONG
CRITICAL: You MUST choose either LONG or SHORT. NEUTRAL is FORBIDDEN and will cause your post to be rejected.
Confidence Level: 58% (Trader signals lean bullish but conviction is moderate due to mixed macro tone and light social confirmation)
Targets:

Systematic Risk in the Global Trading Market1. Introduction to Systematic Risk
Systematic risk, often referred to as market risk, represents the risk inherent to the entire market or a specific segment of the market. Unlike unsystematic risk, which is specific to a company or industry, systematic risk cannot be eliminated through diversifica

YM | WK 51T.A explained -
BackSide (BS)
FrontSide (FS)
Inverse BS (Inv.BS)
Inverse FS (Inv.FS)
BS & FS levels are expected support when dashed lines, tested when dotted and resistance when solid lines.
The inverse is true for the Inv. BS Inv. FS levels, they are resistance as dashed lines, tested as dotted

YM | Week 50T.A explained -
BackSide (BS)
FrontSide (FS)
Inverse BS (Inv.BS)
Inverse FS (Inv.FS)
BS & FS levels are expected support when dashed lines, tested when dotted and resistance when solid lines.
The inverse is true for the Inv. BS Inv. FS levels, they are resistance as dashed lines, tested as dotted

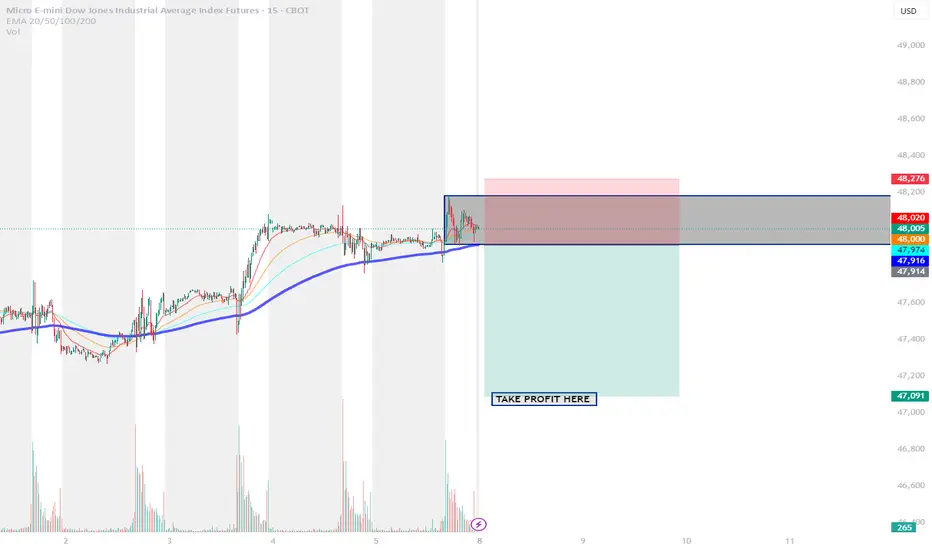
Short YM Trading ideaIf we broke this box to the downside I expect price will go to 1.5 Standard deviation or 4.23 Fibo Level drawn from the box
YM | Week 49 | 1hr chartT.A explained -
BackSide (BS)
FrontSide (FS)
Inverse BS (Inv.BS)
Inverse FS (Inv.FS)
BS & FS levels are expected support when dashed lines, tested when dotted and resistance when solid lines.
The inverse is true for the Inv. BS Inv. FS levels, they are resistance as dashed lines, tested as dotted
$YM Long the pullback.In the Dow today, we're coming off yestserday's fresh breakout to the upside, which makes us bullish for today.
We're simply waiting for a pullback on the 30 minute chart. We want a touch of the Weekly VWAP +1 standard deviation. Stop loss just above Weekly-VWAP.
Manage your risk and wait for the

See all ideas
Summarizing what the indicators are suggesting.
Neutral
SellBuy
Strong sellStrong buy
Strong sellSellNeutralBuyStrong buy
Neutral
SellBuy
Strong sellStrong buy
Strong sellSellNeutralBuyStrong buy
Neutral
SellBuy
Strong sellStrong buy
Strong sellSellNeutralBuyStrong buy
A representation of what an asset is worth today and what the market thinks it will be worth in the future.
Displays a symbol's price movements over previous years to identify recurring trends.
Frequently Asked Questions
The current price of Micro E-mini Dow Jones Industrial Average Index Futures is 48,747 USD — it has risen 0.51% in the past 24 hours. Watch Micro E-mini Dow Jones Industrial Average Index Futures price in more detail on the chart.
The volume of Micro E-mini Dow Jones Industrial Average Index Futures is 38.05 K. Track more important stats on the Micro E-mini Dow Jones Industrial Average Index Futures chart.
Open interest is the number of contracts held by traders in active positions — they're not closed or expired. For Micro E-mini Dow Jones Industrial Average Index Futures this number is 10.83 K. You can use it to track a prevailing market trend and adjust your own strategy: declining open interest for Micro E-mini Dow Jones Industrial Average Index Futures shows that traders are closing their positions, which means a weakening trend.
Buying or selling futures contracts depends on many factors: season, underlying commodity, your own trading strategy. So mostly it's up to you, but if you look for some certain calculations to take into account, you can study technical analysis for Micro E-mini Dow Jones Industrial Average Index Futures. Today its technical rating is strong buy, but remember that market conditions change all the time, so it's always crucial to do your own research. See more of Micro E-mini Dow Jones Industrial Average Index Futures technicals for a more comprehensive analysis.