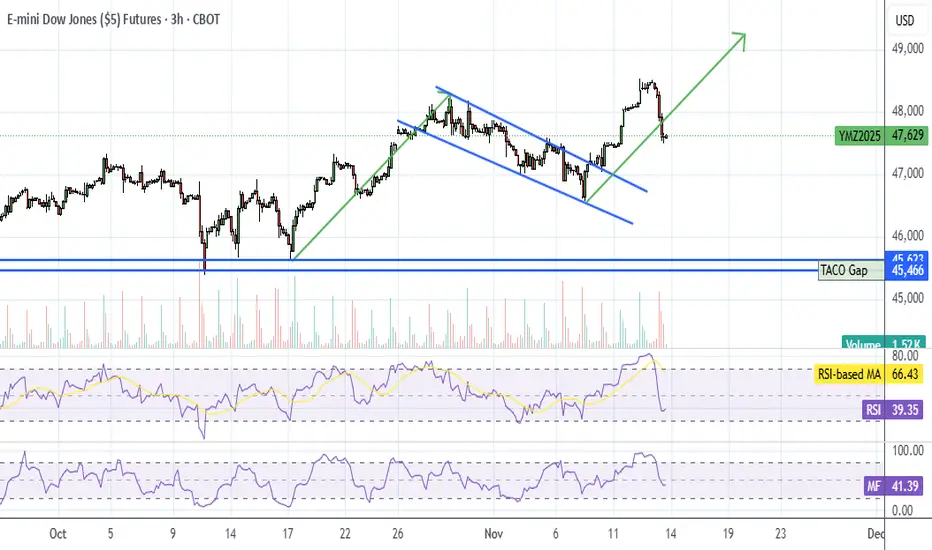
YM (DJI Futures) UpdateI haven't posted YM in a while, but it's been moving a lot lately.
I think MFI needs to get oversold then it goes for the bull flag target. With fewer stocks to pump, the algos have a much easier time pumping the Dow, like earlier this week.
Not sure if RSI will hit oversold. Quite frankly, I sh
Related futures
Dow Futures (YM) Breaks Record : Five Waves Elliott Wave ImpulseDow Futures (YM) has surged to a new all-time high, reinforcing the prevailing bullish trend. The cycle from the April 2025 low remains active and is unfolding as a five-wave impulsive structure. Within this sequence, wave (3) concluded at 48,214. The subsequent decline in wave (4) developed as a zi

$YM | Premarket Prep and Analysis | Higher Timeframe LISWalks through plans today for YM traders. Primary focus on shorts, but our clear line in the sand allows us to be flexible based on interaction with our levels.

dow futureswait for liquidity area to be swept then go long to target area. trade is void if target area hit before it has swept liquidity.

$YM | Mean reversion scalper's delightHeading into the open, we're still inside TPO prior value (see yellow area). Scalpers may be able to fade (short) from the top of VAH - particularly after a stop run of prior swing high.
If you're bullish, either wait for a breakout of the yellow area and pullback or wait to fade from the lower par
YM (Dow), Short idea (30-minute+3-minute TF)See the bottom two charts for the red bear zone I have for today. While it's entirely possible (due to TFs above 30 minutes) for the market travel up past this bear zone, it's a great risk/reward opportunity to take a shot short this morning.
Look for an interaction with the red zone, and momentum

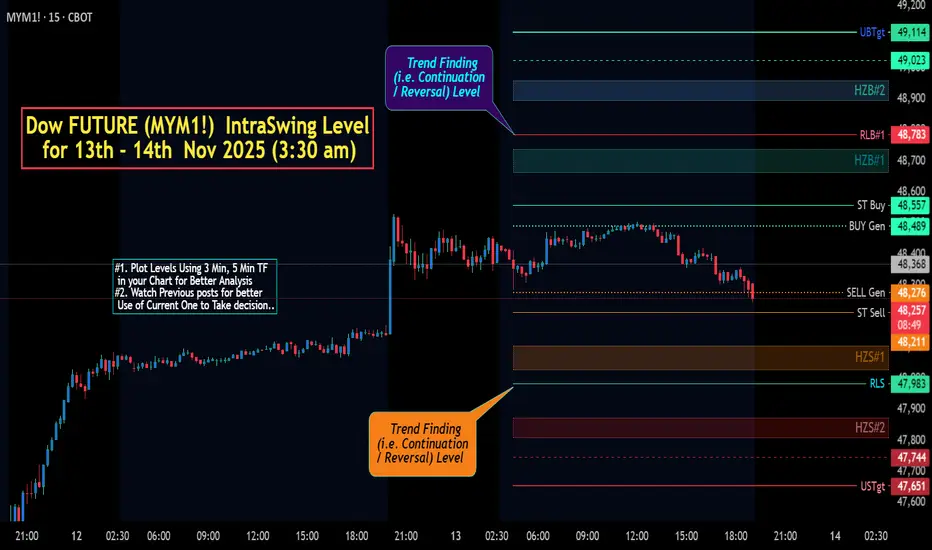
Dow FUTURE (MYM1!) IntraSwing Level for 13th - 14th Nov 2025Dow FUTURE (MYM1!) IntraSwing Level for 13th - 14th Nov 2025 (3:30 am)
Observed Short Range Directionless Trading.
Think Waiting for BIG NEWS.
Level description:
L#1: If the candle crossed & stays above the “Buy Gen”, it is treated / considered as Bullish bias.
L#2: Possibility / Probab
$YM | "Resistance" Zone, or low key breakout area? Let's analyzeToday, we discuss some nuance, so put on your analyst hats and let's dive in!

$YM | Dow Futures Analysis | Long Scenario / IdeaAnalysis of today. We're currently in the dead center of two fairly strong levels with some bullish news premarket. Look to 'buy' at our green zone, and target the pink.

Dow Jones Intra-day IdeaDJ after fridays consolidation and sweeping liquidity of Current Week and mittigating 4H demand. Doing "V" shape reaction and creating 15min Demand that makes our POI for this Intra-day idea.
My stoploss will be under 15min Demand and TP1+BE point will be at 1:2RR.
T2 will be on 15min supply (Only

See all ideas
Summarizing what the indicators are suggesting.
Neutral
SellBuy
Strong sellStrong buy
Strong sellSellNeutralBuyStrong buy
Neutral
SellBuy
Strong sellStrong buy
Strong sellSellNeutralBuyStrong buy
Neutral
SellBuy
Strong sellStrong buy
Strong sellSellNeutralBuyStrong buy
A representation of what an asset is worth today and what the market thinks it will be worth in the future.
Frequently Asked Questions
The current price of Micro E-mini Dow Jones Industrial Average Index Futures (Dec 2025) is 47,229 USD — it has fallen −0.67% in the past 24 hours. Watch Micro E-mini Dow Jones Industrial Average Index Futures (Dec 2025) price in more detail on the chart.
The volume of Micro E-mini Dow Jones Industrial Average Index Futures (Dec 2025) is 178.50 K. Track more important stats on the Micro E-mini Dow Jones Industrial Average Index Futures (Dec 2025) chart.
The nearest expiration date for Micro E-mini Dow Jones Industrial Average Index Futures (Dec 2025) is Dec 19, 2025.
Traders prefer to sell futures contracts when they've already made money on the investment, but still have plenty of time left before the expiration date. Thus, many consider it a good option to sell Micro E-mini Dow Jones Industrial Average Index Futures (Dec 2025) before Dec 19, 2025.
Open interest is the number of contracts held by traders in active positions — they're not closed or expired. For Micro E-mini Dow Jones Industrial Average Index Futures (Dec 2025) this number is 16.68 K. You can use it to track a prevailing market trend and adjust your own strategy: declining open interest for Micro E-mini Dow Jones Industrial Average Index Futures (Dec 2025) shows that traders are closing their positions, which means a weakening trend.
Buying or selling futures contracts depends on many factors: season, underlying commodity, your own trading strategy. So mostly it's up to you, but if you look for some certain calculations to take into account, you can study technical analysis for Micro E-mini Dow Jones Industrial Average Index Futures (Dec 2025). Today its technical rating is neutral, but remember that market conditions change all the time, so it's always crucial to do your own research. See more of Micro E-mini Dow Jones Industrial Average Index Futures (Dec 2025) technicals for a more comprehensive analysis.