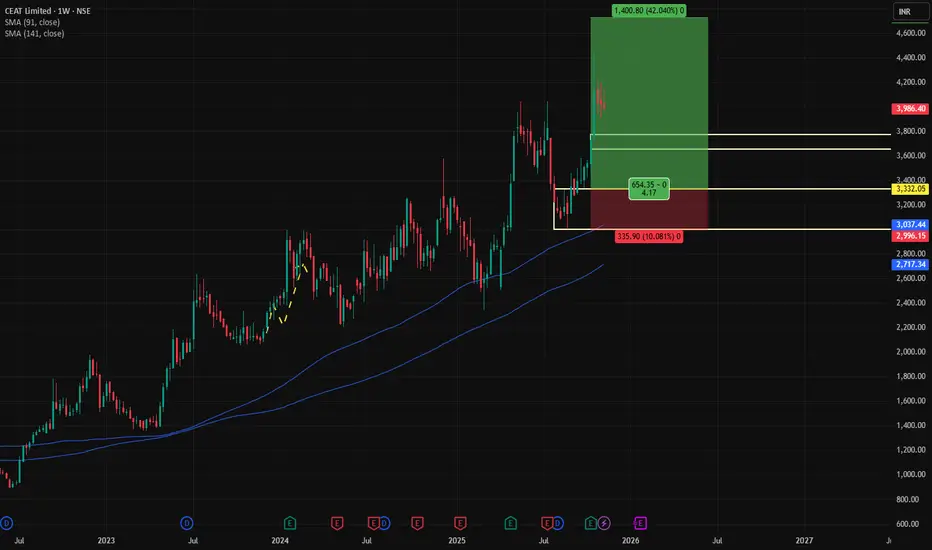
CEAT ON MONTHLY DEMAND✅ CEAT Multi-Timeframe Analysis
HTF – High Timeframe
TF Zone Trend Analysis Logic Proximal Distal Avg
Yearly UP Demand Rally–Rally 2642 2210 2426
Half-Yearly UP Demand Support 2642 2210 2426
Quarterly UP Demand DMIP 3256 2343 2800
HTF Average UP — — 2847 2254 2551
HTF Summary:
Strong long-term
Next report date
—
Report period
—
EPS estimate
—
Revenue estimate
—
122.35 INR
4.73 B INR
130.93 B INR
20.45 M
About CEAT Limited
Sector
Industry
CEO
Arnab Banerjee
Website
Headquarters
Mumbai
Founded
1958
ISIN
INE482A01020
FIGI
BBG000CPTJW2
CEAT Ltd. engages in the manufacture and sale of automotive tyres, tubes, and flaps. It offers tyres to all user segments and manufacturers for all vehicles including heavy-duty trucks and buses, light commercial vehicles, earthmovers, forklifts, tractors, trailers, cars, auto-rickshaws, motorcycles, and scooters,. The company was founded on March 10, 1958 and is headquartered in Mumbai, India.
Related stocks
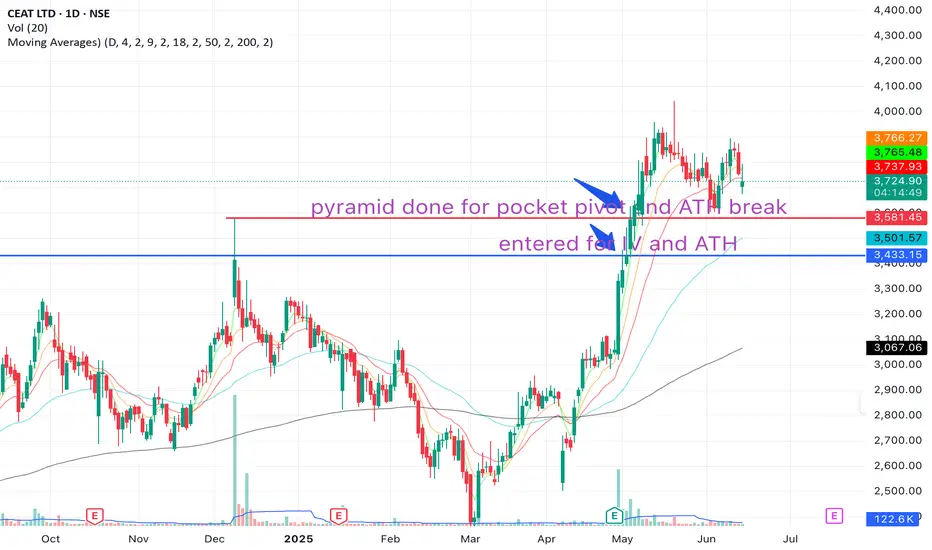
Ceat Tyre - Go LongManufacturing Facilities
Company has 6 manufacturing facilities and 3 smart facilities in Nashik, Mumbai, Halol, Ambernath, Nagpur & Chennai which possess a capacity of producing a total of 3.5 crore tyres p.a.
Capacity Expansion
CEAT has planned a capex of 400 Crs to expand its production capac

Review and plan for 20th October 2025 Nifty future and banknifty future analysis and intraday plan.
Quarterly results- selected few for tomorrow!
This video is for information/education purpose only. you are 100% responsible for any actions you take by reading/viewing this post.
please consult your financial advisor before taking an

Ceat this just for study purpose ,not buy and sell recomondationAs per my analysis Ceatltd can reach 38.2%-50% range. to complete 4th wave , this is just for study purpose and not a buy or sell recommendation.

CEATLTDNSE:CEATLTD
LIFE TIME BO!!!
One Can Enter Now ! Or Wait for Retest of the Trendline (BO) Or wait For better R:R ratio
Note :
1.One Can Go long with a Strict SL below the Trendline or Swing Low of Daily Candle.
2. Close, should be good and Clean.
3. R:R ratio should be 1 :2 minimum
4. Plan as

SWING IDEA - CEAT LTDCEAT Ltd , a major player in the tire industry, is currently showing technical signals that suggest a potential swing trade opportunity.
Reasons are listed below:
Break of Symmetrical Triangle Pattern : The stock has broken out of a symmetrical triangle pattern, indicating a potential shift in m

CEAT LTDNSE:CEATLTD
One Can enter now!
Or Wait for a retest of the trendline(BO)!
Or Wait for a better Risk:Reward Ratio!
Note :
1. One should go long with a StopLoss, below the Trendline or the Previous Swing Low.
2. Risk :Reward ratio should be minimum 1:2.
3. Plan your trade as per the Money Mange

Trying for horizontal line break outPrice didn't fall much after dividend payout. Trying to go up.
Trade carefully.

Ready for DARVAS BOX Breakout...NSE:CEATLTD trade at 2845. Support @ 2500 Resistence @ 3000
on the weekly chart made a DARVAS BOX Pattern, after its breakout you can watch for next resistence @ 4000

See all ideas
Summarizing what the indicators are suggesting.
Neutral
SellBuy
Strong sellStrong buy
Strong sellSellNeutralBuyStrong buy
Neutral
SellBuy
Strong sellStrong buy
Strong sellSellNeutralBuyStrong buy
Neutral
SellBuy
Strong sellStrong buy
Strong sellSellNeutralBuyStrong buy
An aggregate view of professional's ratings.
Neutral
SellBuy
Strong sellStrong buy
Strong sellSellNeutralBuyStrong buy
Neutral
SellBuy
Strong sellStrong buy
Strong sellSellNeutralBuyStrong buy
Neutral
SellBuy
Strong sellStrong buy
Strong sellSellNeutralBuyStrong buy
Displays a symbol's price movements over previous years to identify recurring trends.
SMALLCAP
Mirae Asset Nifty Smallcap 250 Momentum Quality 100 ETF Units Exchange Traded FundWeight
1.40%
Market value
1.12 M
USD
Explore more ETFs
Frequently Asked Questions
The current price of CEATLTD is 3,888.70 INR — it has decreased by −2.36% in the past 24 hours. Watch CEAT Limited stock price performance more closely on the chart.
Depending on the exchange, the stock ticker may vary. For instance, on NSE exchange CEAT Limited stocks are traded under the ticker CEATLTD.
CEATLTD stock has fallen by −0.14% compared to the previous week, the month change is a −4.03% fall, over the last year CEAT Limited has showed a 24.68% increase.
We've gathered analysts' opinions on CEAT Limited future price: according to them, CEATLTD price has a max estimate of 4,781.00 INR and a min estimate of 3,450.00 INR. Watch CEATLTD chart and read a more detailed CEAT Limited stock forecast: see what analysts think of CEAT Limited and suggest that you do with its stocks.
CEATLTD reached its all-time high on Oct 23, 2025 with the price of 4,438.00 INR, and its all-time low was 13.70 INR and was reached on Sep 17, 2001. View more price dynamics on CEATLTD chart.
See other stocks reaching their highest and lowest prices.
See other stocks reaching their highest and lowest prices.
CEATLTD stock is 3.12% volatile and has beta coefficient of 1.16. Track CEAT Limited stock price on the chart and check out the list of the most volatile stocks — is CEAT Limited there?
Today CEAT Limited has the market capitalization of 161.14 B, it has increased by 1.02% over the last week.
Yes, you can track CEAT Limited financials in yearly and quarterly reports right on TradingView.
CEAT Limited is going to release the next earnings report on Jan 28, 2026. Keep track of upcoming events with our Earnings Calendar.
CEATLTD earnings for the last quarter are 46.00 INR per share, whereas the estimation was 36.18 INR resulting in a 27.14% surprise. The estimated earnings for the next quarter are 38.20 INR per share. See more details about CEAT Limited earnings.
CEAT Limited revenue for the last quarter amounts to 37.73 B INR, despite the estimated figure of 36.22 B INR. In the next quarter, revenue is expected to reach 37.47 B INR.
CEATLTD net income for the last quarter is 1.86 B INR, while the quarter before that showed 1.12 B INR of net income which accounts for 65.36% change. Track more CEAT Limited financial stats to get the full picture.
Yes, CEATLTD dividends are paid annually. The last dividend per share was 30.00 INR. As of today, Dividend Yield (TTM)% is 0.75%. Tracking CEAT Limited dividends might help you take more informed decisions.
CEAT Limited dividend yield was 1.04% in 2024, and payout ratio reached 25.67%. The year before the numbers were 1.12% and 18.88% correspondingly. See high-dividend stocks and find more opportunities for your portfolio.
As of Dec 4, 2025, the company has 9.21 K employees. See our rating of the largest employees — is CEAT Limited on this list?
EBITDA measures a company's operating performance, its growth signifies an improvement in the efficiency of a company. CEAT Limited EBITDA is 16.20 B INR, and current EBITDA margin is 10.54%. See more stats in CEAT Limited financial statements.
Like other stocks, CEATLTD shares are traded on stock exchanges, e.g. Nasdaq, Nyse, Euronext, and the easiest way to buy them is through an online stock broker. To do this, you need to open an account and follow a broker's procedures, then start trading. You can trade CEAT Limited stock right from TradingView charts — choose your broker and connect to your account.
Investing in stocks requires a comprehensive research: you should carefully study all the available data, e.g. company's financials, related news, and its technical analysis. So CEAT Limited technincal analysis shows the neutral today, and its 1 week rating is strong buy. Since market conditions are prone to changes, it's worth looking a bit further into the future — according to the 1 month rating CEAT Limited stock shows the buy signal. See more of CEAT Limited technicals for a more comprehensive analysis.
If you're still not sure, try looking for inspiration in our curated watchlists.
If you're still not sure, try looking for inspiration in our curated watchlists.