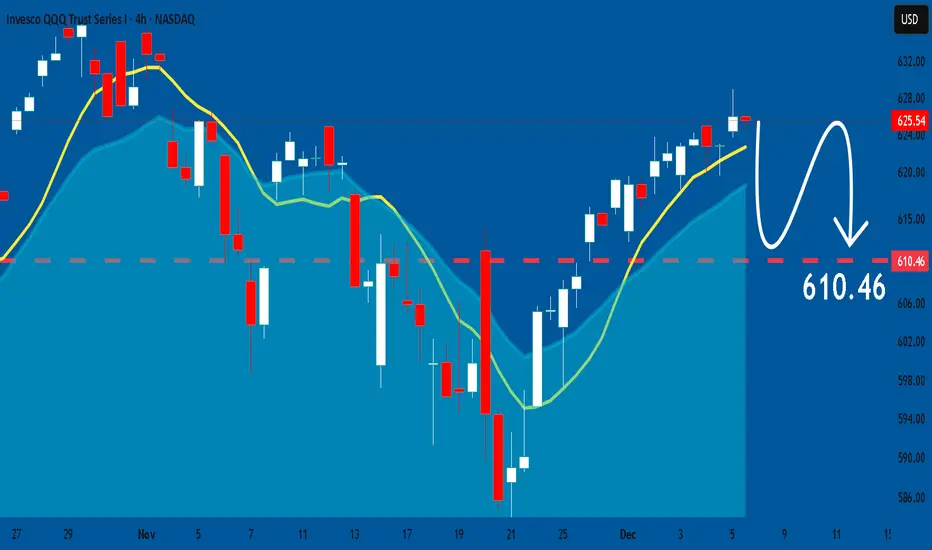
Qqq And tech sectorsI think in the coming week we will see Qqq close gap at 632, there is a chance for a pullback to 618-620 also this week.. I'll explain below how I come to both conclusions..
First The bad :
I'll start with The TVC:VIX
Fallen wedge here which is bullish for the vix... looks like a minimum bounce back to 17.00 is coming this week..
Max upside if Fomc goes bad is 19.50 -20.00 or 200ma
Naturally if the vix spikes you will see a pullback on equities..
If the vix spikes to 17.00 then I think we pullback to 618-620
This pullback would with a break below 622.00
Now if vix spikes back to 20.00, well that's the worst case scenario and that would put Qqq at 611-613 which provides the strongest support
20/50 sma plus price action
If qqq breaks below 610 and vix spikes above 23 then the bull rally is over !
I think as long as 613 holds Qqq is going to 640 minimum and 655 max
Remember at the end of the day we are dancing with the devil up here at the 15yr resistance
Bulls haven't last more than 2weeks up here in the last 2yrs before a 7-15% correction
I'm not showing this to confuse you, I'm showing you the bigger picture so you can understand that despite whatever bullish move that happens in the next 2weeks I don't think it sustains through the entire Dec and another sell like what we saw in Nov is around the corner..
Now on to why I feel like qqq is headed to 640-660.
First off Qqq is showing a broadening wedge and it has reclaimed its summer channel
A descending broadening wedge usually pushes the stock/Index back to its ATH (See iwm) and sometimes higher ..
The measured moved goes like so
so an 8% move up from the breakout would put Qqq at 660 or 1.618 on fib extension
When you look at the 3 biggest sectors
AMEX:XLC
AMEX:XLK
NASDAQ:SMH
You'll see similar bullish patterns
AMEX:XLC
Just broke out of a bullflag in its 3 yr uptrend
Bullflag wants to take this sector back to 120 minimum
NASDAQ:META and NASDAQ:NFLX will pump XLC the most
AMEX:XLK
Same broadening wedge as Qqq and pretty much same analysis
This move up on XLK I think will push NASDAQ:MSFT back to 510..
NASDAQ:SMH
Chips
Same broadening wedge as Qqq and XLK
Actually outperformed most tech Sectors because of Intc , amd and AVGO.. but I think the next leg up comes from NASDAQ:NVDA with a push back to 190ish
Now , down to the action/Tradeable analysis..
NASDAQ:QQQ , wait for a move back above 627.00 to go long next week.. target of course is 632
Qqq has been trading for the most part of this rebound in this tight channel in white; Keep an eye out for the resistance
Any opening bove 623 is neutral and you could try calls with a stop below 622.00
Things get bullish back above 627
Things get bearish below 622 with a target of 618.
622-627 IS CHOP..
Has a gap left open at 617 and the 1hour 200ma is there too . I know I said below 618 and 612 comes but they could dip for the gap close and push back above..
There is a trade I like going into this week.
1st . NASDAQ:MSFT
Weekly chart has given 3 higher lows.
Daily chart is showing wedge breakout and retest
I think it's headed back to 510 this month which in perspective is only a 5% upside.
Above 485 take calls to 492
Above 495 take calls to 510
Simple setup.
Trade ideas

QQQ Retest Into Resistance
1. AW1!/US10Y is a bond market stress gauge
This futures-to-UST ratio pushing 27-28 after bottoming near 21 shows a persistent grind higher, which usually reflects firmer demand for risk relative to sovereign debt or a rotation into duration (falling yields) boosting growth-sensitive ratios
Since the index is making higher highs, the bond market isn’t signaling stress, but it has climbed quickly & these ratios often mean-revert when momentum stalls
No warning yet, but overstretched relative to spring/summer supports QQQ strength unless yields abruptly reverse
2. VIX & COR1M is a volatility pair
COR1M is usually higher in times of event risk & they’re nearly identical; implying, vol surface is flat (complacency), or no event premium which means the market pricing very low turbulence
A low VIX near 16-17 historically precedes shakeouts, not crashes, but routine pullbacks
Given PCE coming Friday, the lack of front-month premium is interesting since it means the market does not fear the print
Optionality is cheap, complacency is high so in this environment, QQQ frequently overshoots then reverts quickly
3. QQQ/VXN shows tech risk appetite
QQQ/VXN at ~29.3 is high
Every major rejection in 2025 happened near similar ratio levels
Whenever it dropped toward the 8-10 area, those were panic low points
The ratio is now again near upper-bound readings while QQQ is extended above its November anchored VWAP
QQQ tends to pull back when its implied-vol ratio reaches these levels (just vol-adjusted exhaustion)
4. NDX/NDXE
NDX/NDXE at new highs near +5.4% means mega-caps outperforming the equal-weight index strongly, narrow leadership
Breadth at risk of weakening
Earlier in the year, the ratio bottomed near -6%, so we’re 12+ points off the lows which is a huge structural rotation into the giant tech names
When breadth thins out this much, markets often continue drifting up, but become fragile, making them vulnerable to macro data shocks or rate-expectation flips
Strength, but concentration risk is real
If yields bounce or VIX wakes up, these narrow rallies unwind fastest
AW1!/US10Y trend is intact (risk appetite steady), VIX & COR1M show no fear & NDX/NDXE leadership remains strong (mega-caps still carrying the market)
QQQ/VXN is at a historical “exhaustion”
Volatility extremely cheap ahead of PCE which signals complacency
Breadth is narrowing so this rally is fragile
Mild pullback retest ($610-$615)
55%
QQQ/VXN elevated, VIX suppressed, breadth narrow
Sideways to mild grind up
30%
Mega-caps still leading; bonds not flashing risk
Sharp continuation breakout
10%
Requires dovish PCE + yields breaking lower
Deep correction (<$600)
5%
No stress signals in VIX, COR1M, or AW1!/US10Y
A pullback into $610–$615 is the most statistically likely move & PCE is the catalyst that can either validate the rally (soft print), or trigger the volatility reversion
Headline/Core PCE prints below expectations (Market pricing: ~0.2% m/m for both)
Soft PCE (0.0-0.1%)
Yields drop immediately; rate-cut odds spike
QQQ breakout, testing $630-$638
25%
Very soft shock (0% + downward revisions)
Large drop in yields; USD falls
QQQ surges, possible new ATH behavior
5%
QQQ is already stretched so upside reaction may fade
Inline PCE (0.2%) is consensus
1. Inline, Goldilocks
Minor yield drift; VIX barely moves
Sideways or slight drift up to $625-$632
25%
2. Inline, but revisions hotter
Algo knee-jerk down, then fades
Pullback to $612-$616 then mean reversion
10%
This is the most likely, but because positioning is stretched, even inline data can trigger a small shakeout
Hot PCE (0.3%) or slightly above expectations
Mild upside miss (0.3%)
Yields pop; VIX lifts from complacent levels
QQQ immediate dip to $610-$615
20%
Sticky services strength
Market interprets “Fed won’t cut early 2026”
Volatility expansion, QQQ drops to $605-$610
5%
This aligns with a stretched QQQ/VXN & narrow NDX/NDXE breadth
Hotter/bad PCE (≥0.4%) is the tail risk
0.4%+ surprise
Sharp yield spike; VIX 1-2 pts higher
QQQ breaks wedge to $598-$605
7%
0.5%+ shock
Markets start repricing full Q1/Q2 cuts are gone
QQQ cascade to $585-$593
3%
Low probability, but highest downside convexity
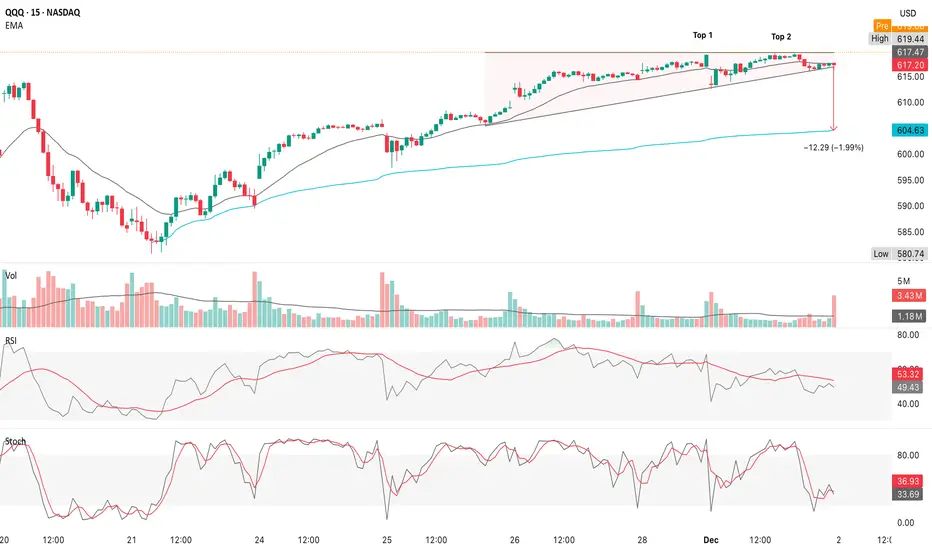
The 15m chart shows that the bearish setup is more developed, more mature & now technically actionable, but still missing one final trigger
Unless the retest invalidates, the bias is now tilted to the downside
The $618-$620 neckline is the decision point
A break of $618 suggests an active target = $612 to $610
Bulls aren’t fully in control, but bears don’t win yet
A break above $623.5 invalidates the topping pattern
Unlikely right now based on momentum & volume
1. Five sessions ago
Bearish odds ~10-15%
2. Three sessions ago
Bearish odds ~25-30%
3. Yesterday
Bearish odds ~40%
4. Now
i) Bearish scenario ($612-$610)
55%
This is now the base case
ii) Chop between $620-$623
35%
Because bulls remain “not broken,” but not advancing
iii) Bullish breakout above $623.5
10%
Momentum doesn't support this upside move
Bears now have the advantage (technically)
Bearish trigger at $618
Once $618 breaks, $610 becomes the high-probability magnet
QQQ Heading to 635 soonBy breaking the current resistance layer chances are high we will be heading to 635 this week.

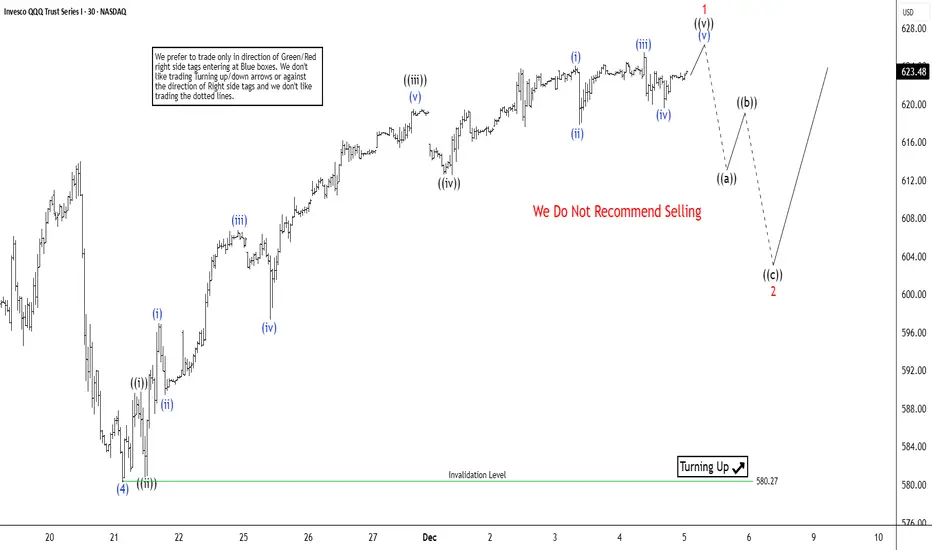
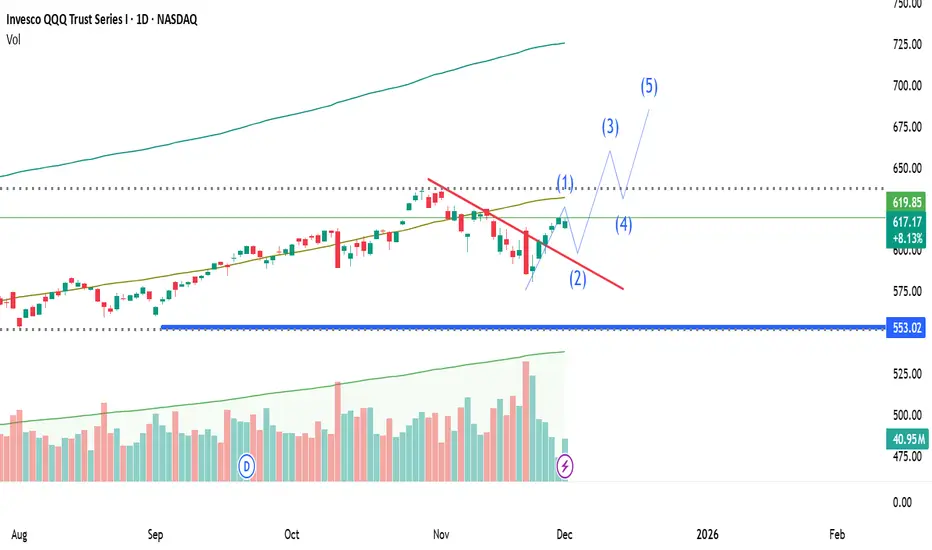
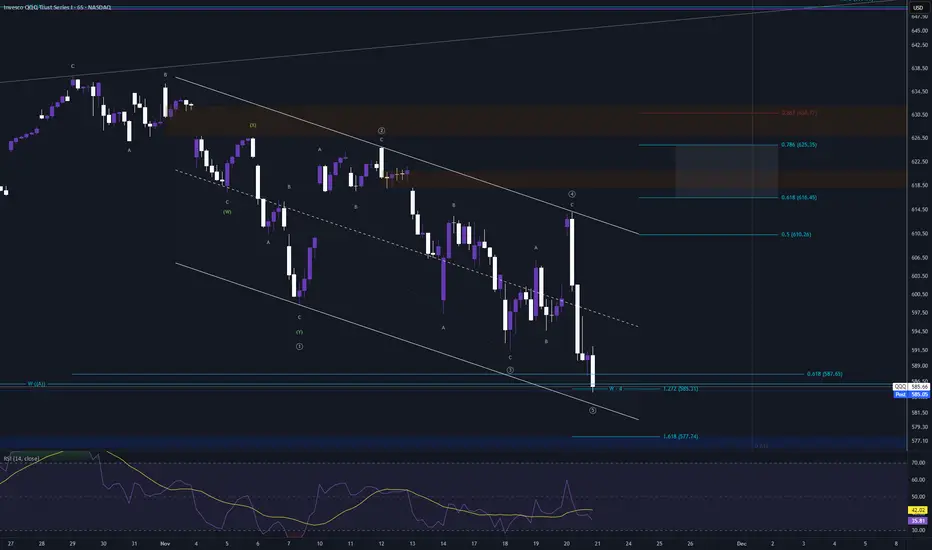
QQQ Short Term Cycle Nearing End; Pullback to Attract BuyersThe short-term Elliott Wave outlook for the Nasdaq 100 ETF (QQQ) indicates that the cycle from the April 2025 low remains active. Wave (4) of the ongoing impulse concluded at 580.27, and the ETF has since resumed its upward trajectory. To confirm continuation, price must break above the prior wave (3) peak recorded on 30 October at 638.41. The rally from the 21 November wave (4) low has matured and is expected to complete soon, reflecting the natural rhythm of the Elliott Wave sequence.
The advance from wave (4) has unfolded as a five-wave impulse. Within this structure, wave ((i)) ended at 586.25, followed by a corrective pullback in wave ((ii)) that terminated at 580.36. From there, the ETF nested higher. Wave (i) of the next sequence ended at 596.98, while wave (ii) pulled back to 589.44. Momentum carried wave (iii) to 606.76, before wave (iv) corrected to 597.32. The final leg, wave (v), reached 619.51, completing wave ((iii)) at a higher degree. A subsequent pullback in wave ((iv)) ended at 612.13.
Looking ahead, wave ((v)) of 1 is expected to finish soon. Afterward, a corrective wave 2 should unfold, addressing the cycle from the 21 November low before the ETF resumes higher. In the near term, as long as the pivot at 580.27 remains intact, dips are anticipated to find support in a 3, 7, or 11 swing sequence, reinforcing prospects for further upside.
QQQ's 3rd PillarAAPL is the strongest of the 3 generals since price is holding above it's 20d MA with no meaningful breakdowns since mid-October
Higher highs/higher lows intact
AAPL is the relative strength leader
Pullbacks are still being bought
Upside momentum is slowing, but no bearish triggers
MSFT cleanly bounce from oversold, but still a repair phase
Hit lower Bollinger from the highs in late October
Strong rebound off ~$465
Still below its prior support around $520-$530, so this rally is still “inside the correction”
This is a reaction rally after a near-vertical flush
MSFT is repairing damage, not in breakout mode
It’s the “middle child” right now, stronger than NVDA, weaker than AAPL
NVDA is the odd one out (weakest)
Clear lower highs since the early-November peak
Broke down through $195 & failed to reclaim it convincingly
Trading below its short-term MA
NVDA is objectively the weakest structure, it's trend is broken, momentum pushing down, failed bounce attempts & chart resembles early-stage trend deterioration, not a completed correction
All three semis/chips (NVDA) have shown relative weakness lately vs megacap tech (AAPL + MSFT)
This aligns with QQQ given rotation inside tech rather than broad risk-on
AAPL doesn’t support a bearish tilt (too strong)
MSFT is neutral, but slightly bullish short-term
NVDA supports a bearish tilt (weak structure, momentum down)
QQQ weighting is heavily influenced by AAPL + MSFT, which are not breaking down
These charts do not reinforce a clean bearish thesis
They show rotation (NVDA weakness), but no index-leader breakdown (AAPL/MSFT still intact)
To get a real QQQ rollover, you typically need AAPL + MSFT to crack simultaneously
AAPL is the single most important line of defense for QQQ
Downside risk only becomes serious if AAPL loses trend with critical Levels at $268-$270 (the rising short-term trend support) & the top of the old consolidation from late October
A break would first invalidate momentum, then flip the trend down
If AAPL closes <$268, you’re no longer in “bull flag mode,” but in trend reversal territory & QQQ loses its strongest pillar
MSFT is the canary for liquidity since MSFT drives a ton of passive flow
Its rebound is strong, but it’s a reaction rally inside a broken structure
This is the rebound low & the base of the prior breakdown
Losing this means the bounce was a dead-cat & confirms a larger down-leg
A daily close <$480 signals recovery failed, sellers in control & next level becomes ~$460
That is a meaningful QQQ drag
NVDA is already weak
NVDA is the weakest chart of the 3 generals
It does not have to break down to add downside pressure, but there is a level where selling accelerates sharply, $170-$173, the base of the November flush
A close <$170 opens a vacuum to $160 to $150 fast
That would be a serious volatility event for QQQ
Genuine QQQ downside risk appears only when 2 of the 3 megacaps break, so if these 2 things happen, downside risk is confirmed
AAPL closes <$268-$270
MSFT closes <$480-$485
At that point, QQQ loses AAPL’s trend support & MSFT’s liquidity bid
NVDA is already structurally weak, so the combined effect is decisive
Those two breaks together flip the entire index environment from “bullish trend with rotation” to “index-level breakdown”
Alphabet (GOOGL) has been the stealth leadership bid
When AAPL & NVDA wobble, Alphabet often becomes the rotational safety valve inside QQQ because it trends cleanly, absorbs passive flows (huge weighting) & attracts “quality growth” buyers when semis weaken
This stabilizes QQQ even when one of the top names is soft
But here’s the nuance
Alphabet’s strength can support QQQ, but it cannot prevent a QQQ breakdown if AAPL or MSFT crack key levels given weighting reality of AAPL + MSFT = ~23-26% of QQQ
GOOGL (A + C) = ~8-10% total
Alphabet can dampen downside, not cancel it
Alphabet’s run-up is a sign of “healthy rotation,” not froth
Alphabet’s recent behavior looks like trend accelerating, rising volume on up days, oscillators in a bullish regime but not overcooked & clean support at each pullback
This is classic “institutional accumulation”
When markets are topping, you don’t typically see new leadership emergences - you see everything stall
Alphabet rising while NVDA weakens suggests this is sector rotation, not index distribution
It tells you “the market is not in risk-off, but in reshuffle mode"
Alphabet’s strength delays downside - it doesn’t prevent it
NVDA breaking down is a noticeable drag, MSFT breaking $480 is a real drag & AAPL breaking $270 is an index “air pocket” event
Alphabet can counter only 1 of these circumstances, not 2
When the flows in the biggest names turn, Alphabet’s strength becomes irrelevant because passive flows unwind, systematic strategies flip short/flat, correlations compress toward 1 & Alphabet gets sold with the others at that point
Alphabet helps explain why QQQ hasn’t rolled over yet
This is the key practical takeaway
Alphabet’s strength is the reason you’re seeing shallow dips, the reason VIX isn’t reacting much & the reason QQQ keeps getting saved above key levels
It’s functioning as a 3rd pillar, replacing NVDA for now, but again, it cannot offset a structural loss of AAPL or MSFT
The combined model (AAPL, MSFT, NVDA, GOOGL)
If Alphabet stays strong & AAPL/MSFT hold, pullbacks are just noise
If Alphabet stays strong, but MSFT breaks $480, QQQ slides, but not violently
If Alphabet is strong, but AAPL breaks $270, QQQ drops harder than you expect
If Alphabet weakens & either AAPL or MSFT fail, sharp downside becomes likely
Alphabet is a stabilizer, not a shield
Alphabet’s run-up tells you institutions are still allocating into megacap tech, the market is rotating, not distributing & QQQ won’t break on NVDA weakness alone
I
t delays downside risk, but does not erase it
The real triggers remain AAPL <$270 & MSFT <$480
QQQ is short-term bullish, but not yet a durable trend reversal
The 21 November AVWAP has been acting like a dynamic rising support line
Price respected it during every hourly pullback
Friday’s price extended above it into stretched momentum territory which means buyers have controlled the bounce, but this AVWAP is far from price now so mean-reversion risk increases
Both AVWAPs show an extended, overbought bounce with no real test of strength
The rally from the 21 November low is steady, one-sided, over-extended, on declining volume, into a major prior supply & without a single higher-volume accumulation candle
This looks almost exactly like a corrective rally into resistance, not a fresh impulse trend
NASDAQ:QQQ AMEX:SPY NASDAQ:AAPL NASDAQ:GOOGL NASDAQ:MSFT NASDAQ:NVDA
Stock Market Forecast | BTC TSLA NVDA AAPL AMZN META MSFTStock Market Forecast | CRYPTOCAP:BTC SP:SPX NASDAQ:NDX CME_MINI:ES1!
Mag 7 | TSLA NVDA AAPL AMZN META MSFT GOOGL

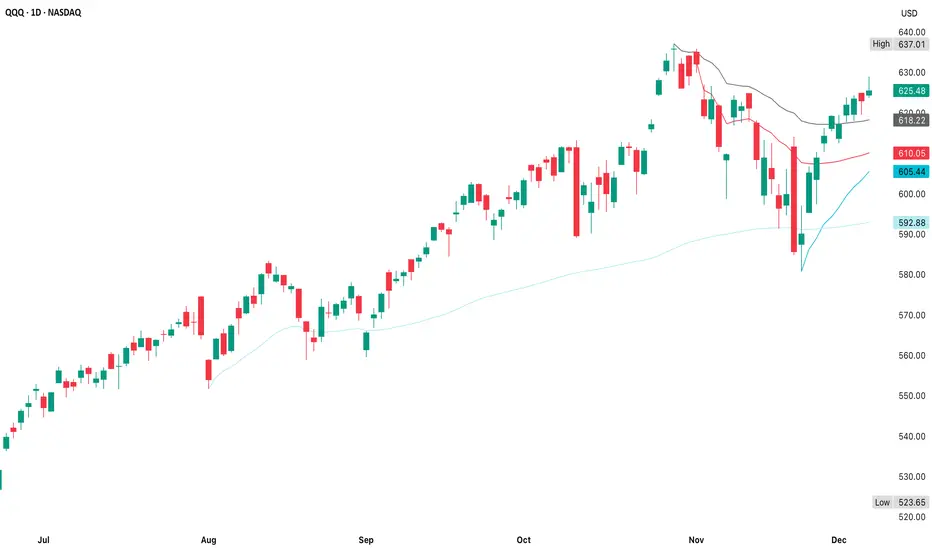
QQQ (5 December)When QQQ tops on the daily timeframe, you typically see upper-band overextension, multiple rejection wicks, bearish engulfing candles, a clear lower high formation, EMA breakdown & shrinking momentum + rising volatility, but the chart shows the opposite
Price bounced cleanly off the mid-band & is riding the upper half of the Bollinger channel
This is continuation behavior - not reversal structure
The daily trend is intact and healthy
No close below the mid-Bollinger (20d MA)
No sharp mean reversion
No violation of October low structure
Higher lows since the pivot around $589
This is an uptrend, with no technical evidence of topping
$637 is the ATH
QQQ rarely tops on the first retest
It either i) consolidates under resistance & then breaks, or ii) fakes a small dip & then breaks
The current setup shows controlled expansion, trending conditions, no volatility spike, smooth adherence to mid-band support & higher highs forming inside the bands
This is bullish
The last candle is green, closing near the upper band with solid volume & QQQ closed above $625 - a higher high vs last week, which suggests continuation, not distribution
1. Breakout attempt toward $630-$635
60%
Trend + position in band favors upside
2. Pullback to $620-$615 before breaking higher
30%
Standard retest of mid-band structure
3. Deep reversal toward $580
10%
No topping pattern; requires macro shock

QQQ Is QQQ topping?The 4H chart shows a clean breakout retest attempt as price is now testing the $625 resistance, the same area that previously rejected multiple times, but this time the backdrop is different
RSI shows no bearish divergence & sits at ~63 (bullish, but not overbought) which supports continuation upward, not rejection
Stoch is overbought, but embedded (staying >80) - typical of trending moves & this usually precedes a breakout, not a reversal
MACD shows a bullish cross with an expanding histogram while the MACD line is curling upward, not flattening
Price structure strongly favors an upside push into $630-$637
The 4H candles show higher lows, higher highs, strong impulsive green sequences & controlled pullbacks with shallow retracements
This is not corrective price action - it’s impulsive
Immediate resistance is $625.50 so a break and 4H close above = $630 test likely within 1-2 sessions
Bullish thesis remains intact unless $618 (primary support) breaks
Ultimately, $605-$607 must hold for a broader uptrend above the recent highs to +$640
Right now price sits at $622-$625, well above these key levels
A breakout attempt is coming with an immediate targets of $630 & $637
We have an expected inline PCE today, FOMC next week (likely signaling 2025 cuts) & seasonality (December is historically bullish)
This is when a rally should ignite
As long as QQQ trades above $618 and especially above $611, bulls remain in control
Probability of testing $630-$637 before 19 December is higher than failing $618 (~55%)
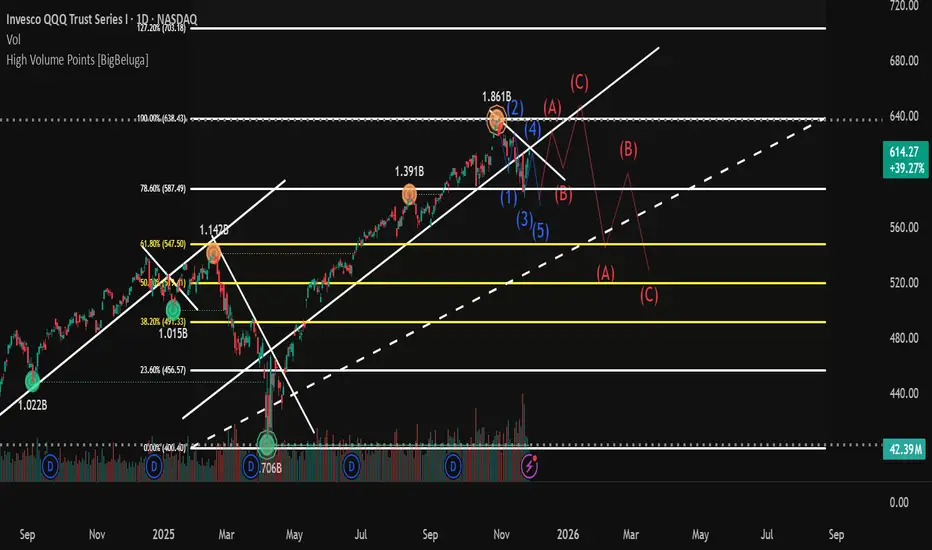
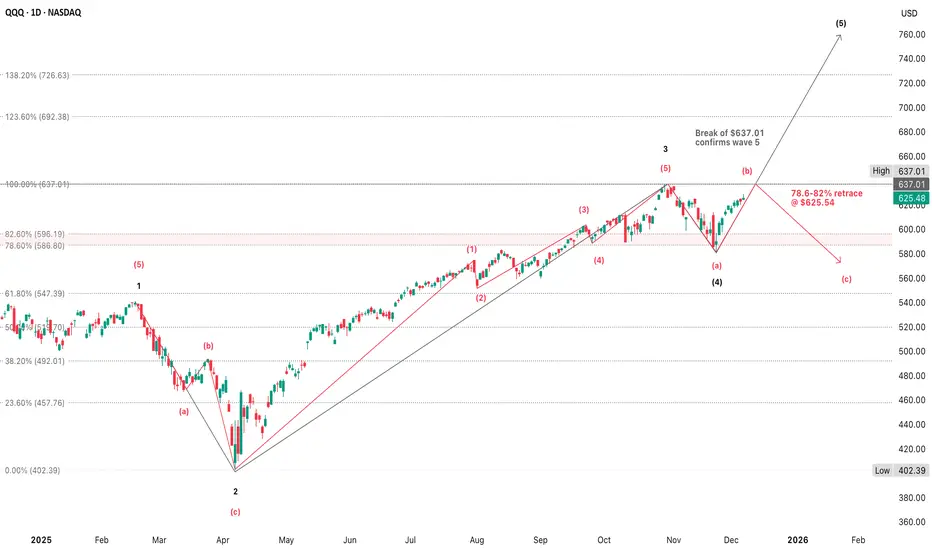
A daily close above $637 invalidates the a-b-c bearish path & confirms wave (5) is underway
Upside targets are $692 (Fib 123.6%) & $726 (Fib 138.2%)
These align with historical QQQ extensions during Fed pivots
This is the scenario the current macro narrative supports with PCE likely inline, Fed likely signals rate cuts for 2026, yields easing & seasonality strong
The current bounce is wave (b) with wave (c) next only if wave (4) is not complete
If that happens, downside targets cluster include $586 (Fib 78.6%), $560 (Fib 100%) & $547 (Fib 61.8% of entire rally)
Probability of deeper a-b-c correction is ~45%, lower if Fed confirms a pivot next week
QQQ is between bullish continuation vs bearish retrace for max frustration
1. Bullish wave (5)
55%
$637-$650+
Highly favorable
2. Sideways/Chop
15%
$615-$625
Theta pain, but not dead
3. Bearish wave (c)
30-35%
$586-$560
Call loses value
Because we haven’t broken $618 & macro is supportive, wave 5 has the edge right now
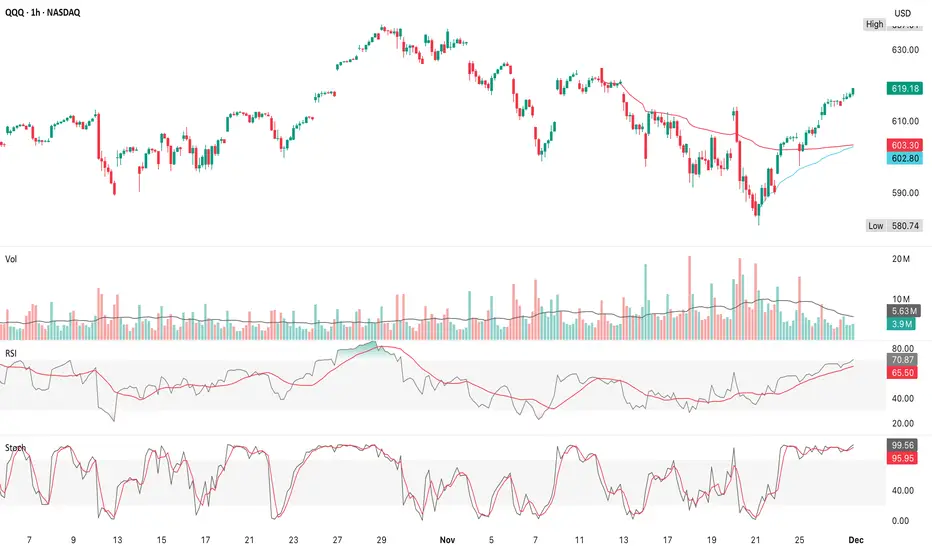
QQQ is riding the middle Bollinger band upward
Rejected the lower band (18-21 November)
Reclaimed the 20d MA
Is now trending upward along the mid-band
This is a post-pullback continuation trend, not a topping structure & is bullish until the middle band is lost
Price is likely to push toward the upper band, which right now aligns with $632-$637
Before the November drop bands were wide, volatility high, contraction & a trend shift, but now, bands are narrowing slightly, but the upper band is tilting upward, not flat
Flat upper band = consolidation
Rising upper band = trend continuation
The chart shows rising upper band or bullish drift with breakout potential
QQQ is currently not touching the upper band, not forming topping wicks, not showing distribution volume, so this means no exhaustion, room for upside & momentum still building
f price were already slamming the upper band repeatedly, that'd be a warning, but it’s sitting comfortably between the bands & trending upward without overheating
Everything on this daily chart supports continuation into $630+ over the next 5-10 sessions

QQQ End of a Corrective Bounce?The Thanksgiving bounce was real & technically healthy with a sharp V-reversal off ~$585
Buyers regained key MAs (20d & 50d), oscillators turned upward & price broke out of the panic low without resistance
Last week’s action built a tight coil under a clear ceiling & this type of setup often resolves after a catalyst (FOMC)
QQQ is at a true inflection point - not obviously topping, not clearly breaking out
Both a pullback or breakout are technically reasonable
A pullback is possible given stretched momentum, thinning volume, clear resistance $631-$637, many components are strong, but not surging & other short-term exhaustion signals which makes a risk of fade technically credible
A breakout is still possible because the trend structure is intact, buyers defended every dip for 2 weeks, short-term AVWAPs are rising under price (support) & no reversal signals so the market tends to drift upward into events
The most realistic path is a slow grind into $630-$633 early this week & after FOMC, the market chooses its path
If buyers don’t have conviction, then a pullback toward $612 to $605
If buyers get a catalyst, then a breakout above $637
A “bounce into FOMC & then fade” base case is completely supported by the charts,
but it’s not the only valid outcome
A breakout remains technically possible if $637 is reclaimed with volume
QQQ’s Thanksgiving rally carried into last week’s consolidation & the index is now poised at resistance in a balanced, technically neutral state so it can push higher into the $630-$633 early in the week, but the real move (pullback or breakout) will be decided after FOMC
Wave 5 & Wave b often look similar until one key level is broken or held & right now, price is where both counts remain technically valid & that’s why I feel at a loss - it's ambiguous by nature, but there are precise levels that resolve the ambiguity
1. Price must break above the prior high at $637.01 with no exceptions
Wave 5 must make a higher high relative to wave 3
2. Wave 5 should show expanding candles, improving breadth & stronger volume on the
push through resistance bands
Right now the move out of wave a is corrective-looking & wave 5 often starts with corrective back-testing; however, it has the look of an a–b–c upward correction, not a start of a new leg higher & this is a yellow flag for the bull case
1. If price rejects at resistance, wave b is confirmed & wave 5 is invalidated
Price often stops exactly at the 78.6-82% retrace, which is common for wave b peaks
Price should fail below $632-$637, then break $600-$605 & possibly accelerate lower to $570
2. If price closes above $637, then wave 5 is confirmed, period
3. If price rejects $630-$637 & breaks below $612, then the wave b path is confirmed
This is the most important support on the chart
Break $612 & the bounce was corrective so wave c is next
The bounce up from wave a low looks much more like a wave b correction than a wave 5 start given the retracement depth (~78.6%) fits wave b perfectly, declining volume, stretched oscillators without trend confirmation & price pinned under major resistance
Wave 5 usually doesn't start with weak volume & overlapping candles, but wave b rallies often do
We don't confirm the wave b top until the market breaks support
Structurally, the chart is sound & doesn't violate any hard Elliott rules
A wave b often retraces 61.8-78.6%, or sometimes 100% of wave a
The current rally is sitting just below the 78.6-82% ($630-$632) & may even tag $637 if the market pushes into the event/catalyst
Wave c unfolds in 5 clean subwaves, often in a move parallel to wave a & usually lands near the 61.8% retrace of the prior impulse
A realistic target is $560-$575
The wave c target around $572 is reasonable if the correction continues
0.618 × wave a (~32 points)
1 × wave a (most common, ~52 points)
1.618 × wave a (during strong, sharp corrections, ~84 points)
$572 is between the 0.618 & 1 projections for wave c
Lands almost perfectly on the 50% retracement of the entire wave 3 advance
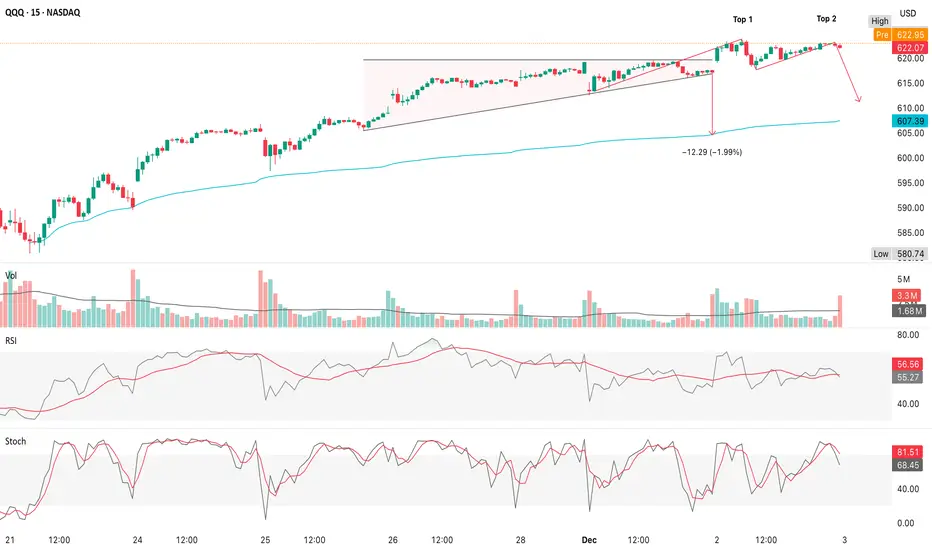
QQQ Short-Term RoadmapThe 15m chart shows 3 things with absolute clarity
1. Rising wedge
• A clean candle through wedge support
• A retest attempt that failed
• Follow-through selling
• High-volume breakdown bar
2. Double top at $619-$620
• Top 1 rejection
• Top 2 rejection
• Neckline broken
• Pattern validated
• The double top + wedge combo gives strong short-term downside momentum
3. Momentum confirms the breakdown
• RSI sloping down, under its average
• Stoch rolling over from mid zone
• No bullish divergences
• No failed breakdown behavior
• This is genuine intraday weakness
Short-term downtrend on the 15m is active & should continue toward support, ~$604
• This target is not arbitrary - it has extremely strong confluence
• Rising wedge measured move
• Double-top measured move
• AVWAP (21 November) ≈ $603-$605
• Daily pivot support zone
• 50d MA ~$604
• Largest VPVR volume node (HVN) $602-$610
• Fair-value of the entire multi-week range
Every timeframe and every tool points to $604-$610 as the magnet
• The market is heading directly toward it
• This 15m breakdown is simply the path into it
Volume confirms this is real selling
• The breakdown candle has higher volume
• Volume increased from baseline
• Not holiday drift, not thin liquidity
• True supply entered at the top
• This validates the move
Short-term is bearish until ~$604-$610 is hit
• This is a normal pullback into support
The larger trend remains bullish because price is above all major MAs (20d/50d/100d/200d)
• Macro shifted bullish (rate-cut odds jumped)
• Daily trend structure is intact
• 4H MACD still bullish
• Daily RSI still rising
This 15m breakdown is corrective within an uptrend
• Follow-through toward ~$610
• Liquidity sweep of the wedge target ~$604-$606
• Bounce attempt from $604-$610
• The market will try to reclaim $612-$615
• If it succeeds, trend resumes toward $620+
• If it fails → next test is $600-$603
Bullish continuation remains intact above $610, while warning signals appear below $610 & a break of $605
• Both still compatible with larger bullish structure
Bearish shift (deeper correction risk)
• Break below $600
• Bearish confirmation with a break below $590
• This would signal a structural break on the daily timeframe; however, right now we are nowhere near those lower levels
The 15m chart shows a real, clean breakdown, valid bearish patterns, selling into the highs & momentum rolling over
• A short-term move toward ~$604-$610, but this is a normal pullback in a strong daily uptrend & larger trend remains bullish
• $604-$610 is key
• Expect a bounce attempt there
• No evidence yet of a trend reversal
• No evidence of a larger correction unless $600, then $590 break
• This is exactly how strong markets correct
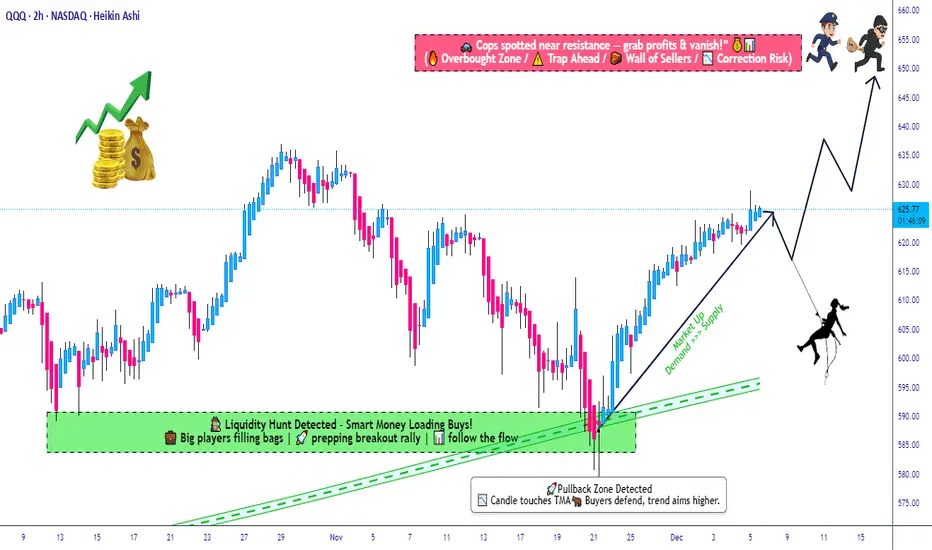
QQQ Structured Bullish Scenario • Compression Into MA Support📌 Asset: QQQ — Invesco QQQ Trust Series 1 (NASDAQ ETF)
🔎 Style: Swing / Day-Trade Profit Playbook
🎨 Theme: Bullish Pullback Setup using Triangular Moving Average + Layered Entry Strategy
📈 Bullish Pullback Plan — “Thief Layering Strategy” Edition 🕵️♂️💰
QQQ is pulling back into a Triangular Moving Average zone, forming a clean bullish reaction area. Price behavior shows controlled momentum, healthy retracement, and a potential continuation toward the upper supply zone.
To keep it fun — Thief OG Style is included but in TradingView-permitted language and friendly terms.
🎯 Entry Plan (Layered Limit Entries — “Thief Style but TV-Friendly”)
Using a layered entry method (multiple limit orders placed at different levels to reduce average cost and control risk):
Buy Limit Layer 1: 605
Buy Limit Layer 2: 610
Buy Limit Layer 3: 615
Buy Limit Layer 4: 620
(Traders may increase or reduce the number of layers based on their own strategy and risk tolerance.)
🛑 Stop Loss (Risk Control Zone)
📍 Proposed Risk Level: 600
This is shared for educational insight only — every trader must select their own SL depending on risk appetite.
🎯 Target Zone (Resistance + Police Force Zone 🚓😆)
Projected upside target: 650
The resistance zone has strong reaction history + signs of overbought conditions + possible liquidity traps.
So take profit smartly and exit with gains before “police force” catches late buyers.
(Again: this TP is optional — traders should decide their own TP levels.)
📚 Market Context & Correlation Watchlist 🔍🌐
QQQ is heavily correlated with major US tech indices & megacap tech stocks. Watching related pairs helps understand volatility, liquidity shifts, market strength, and trend momentum.
🔗 Related Pairs to Watch (Cross-Checks & Correlation Insight)
💠 NASDAQ:NDX / PEPPERSTONE:NAS100
Direct parent index of QQQ
Moves almost identically
Great for trend confirmation
💠 SP:SPX / AMEX:SPY
Broader market risk sentiment
If SPY + QQQ align in bullish direction → strength confirmed
💠 TVC:VIX
Volatility meter
Lower VIX supports bullish continuation
💠 NASDAQ:AAPL , NASDAQ:MSFT , NASDAQ:NVDA , NASDAQ:AMZN , NASDAQ:GOOGL
These top components control majority of QQQ weighting
Bullish tech megacaps = higher probability QQQ reaches target
💠 TVC:DXY (Dollar Index)
Strong USD = pressure on equities
Weak USD = supportive for QQQ rallies
💠 NASDAQ:TLT / US10Y
Bond yields inverse to growth stocks
Falling yields can provide additional bullish fuel for QQQ
🧠 Key Technical Points 🛠️🔥
Triangular MA acting as dynamic support
Healthy pullback with controlled selling
Layering entries reduces average cost & improves RR
Resistance zone at 650 aligns with prior structure
Megacaps still holding bullish bias
Volatility decreasing → favorable for continuation
✨ “If you find value in my analysis, a 👍 and 🚀 boost is much appreciated — it helps me share more setups with the community!”
⚠️ Disclaimer
This is a thief-style trading strategy just for fun.
#QQQ #NASDAQ #ETF #SwingTrade #DayTrading #TechnicalAnalysis #TriangularMA #LayeringStrategy #LimitOrders #MarketAnalysis #TradingPlaybook #USMarkets #Stocks #TraderLifestyle #Investing #BullishSetup #TrendContinuation #RiskManagement #ChartAnalysis
QQQ VWAP Based EntriesWhen price moves from below to above an AVWAP decisively, it signals short covering & a shift in control from sellers to buyers & when 2 or more AVWAPs converge liquidity concentrates, reversals or breakouts often happen there & these are the spots where traders take reversal trades, breakout entries, or stop placements
Right now, the 3 & 21 November AVWAPs are separated, meaning trend strength
When they converge, it signals compression
1. Using AVWAPs as a dynamic stop-loss is one of the simplest & most effective uses
If you're long above the 21 November AVWAP, the rising blue AVWAP is your dynamic stop
A close below it should signal an exit
It reflects the average buyer cost basis, not arbitrary price levels
2. An AVWAP is a useful trend filter
Price above rising AVWAP(s) suggests a long bias
Price below falling AVWAP(s) suggests short bias
When price chops around a flattening AVWAP, stay out
AVWAP is a trend health indicator
3. AVWAP + candlesticks = clean entry signals
The strongest signals come when price pulls back into an AVWAP, prints a small reversal candle (hammer, doji, engulfing) & ATR is declining (just like now) since these become high-quality continuation entries
As a high-level playbook, anchor VWAPs at major pivots (highs, lows, breakdowns, earnings gaps), trade pullbacks into rising AVWAPs during uptrends & trade rejects from falling AVWAPs in downtrends
Use converging AVWAPs as inflection points
Use the nearest rising AVWAP as your stop
Anchor to the close if the candle represents an event you want to capture (breakout, breakdown, a clear reversal bar, a candle where closing price indicates the market's verdict, earnings, FOMC, etc)
Anchor to (H+L+C)/3 (the “typical price”) when you want a smoothed, less-biased VWAP for longer-term structures or swings
Typical price reduces noice from intraday spikes & avoids sensitivity to one extreme print or over-reaction to the tails on the candle (AVWAP from swing highs/lows or the start of a trend)
Price is above all AVWAPs
This means all meaningful “cost basis cohorts” are beneath price
The market is structurally repaired, at least in volume-weighted terms
Overhead resistance from anchored supply does not exist right now
This is a very different situation from when AVWAPs are stacked above price
The ATH AVWAP is rising & firmly below price
This is one of the best signs of long-term trend health in AVWAP analysis
When the ATH AVWAP is rising, decisively reclaimed & acting as near-term support, it usually tells you the prior correction has been fully absorbed
Longs from the top are no longer underwater
Selling pressure from those prior buyers is neutralized
Trend followers using AVWAP logic have flipped their filters back to “risk-on”
This is an objective, mathematical read & not a prediction
The 3 & 21 November AVWAP are now support layers
3 November (red) are breakdown-day sellers who are now underwater & this is a bullish dynamic because they can’t apply pressure
21 Nov (blue) are capitulation low buyers, still profitable & in control - primary support
Together, these form a layered support around $605-$612, or the area where dip-buyers have historically stepped-in
A stop-loss location for AVWAP-based trading systems
Now that price is above all 3 major AVWAPs, the focus shifts to behavior around the ATH AVWAP & since price is above it already, there are only 2 meaningful reads
1. Bullish continuation setup
2. Price may pull back to the ATH AVWAP ($618)
Find buyers (hammer, doji, small-range reversal) & then move away
This is one of Brian Shannon’s highest-probability setups (reclaim AVWAP → pullback → higher low → continuation)
Potential warning setup because trend deterioration begins with this move
Price closes below the ATH AVWAP
Then stays below it for multiple sessions
Slope begins to flatten or roll over
This would be your first objective sign that the trend is losing strength from an anchored-volume standpoint
The chart shows the exact 3 level anchored VWAP system that institutional traders use
A correction-low AVWAP (21 November)
A breakdown-event AVWAP (3 November)
A structural high AVWAP (ATH)
This lets you map out short-term trend control (blue), intermediate-term supply absorption (red) & higher-timeframe trend health (gray) & right now, all of them say the same thing
Price is in a state of repaired, orderly trend with all major AVWAPs providing support beneath
ATH AVWAP
Defines trend health at the highest timeframe visible on your chart
Swing traders, late buyers at the highs, trend-following algos
When price is above the ATH AVWAP then the uptrend is structurally intact
When price is below it then long-term players are underwater, trend is suspect
QQQ is above the ATH AVWAP (~$618)
This means that ATH buyers are profitable again
The first high-quality pullback often tags this line in early trend repair phases
A reclaim → retest → hold sequence is extremely bullish behavior
3 November breakdown AVWAP
Tracks sellers from major breakdowns or panic candles
Funds that sold into weakness, systematic risk-off flows
If price is above it then that entire selling cohort is underwater
These traders become forced buyers on pullbacks or breakouts
AVWAP ~$610
Price is above it then supply from that breakdown is absorbed
This AVWAP becomes support on deeper pullbacks
If price tags it then watch for immediate dip-buying
21 Nov AVWAP - capitulation
Tracks the cost basis of buyers who stepped in at the emotional low
Aggressive reversal traders, deep-value algos, CTA re-leveraging
This is the most important rising support line in the model
When price is above it, the reversal cohort is still in control
A close below it often signals trend exhaustion
AVWAP ~$605
Price is well above it & the slope is rising aggressively
As long as price respects this AVWAP, the recovery trend remains clean
If price pulls back to it then this is a high-odds rotation/continuation buy point
Long-Term AVWAP
This is the long rising AVWAP on your chart (~$592)
It acts as deep trend support
The line separating bull vs bear structure
The highest timeframe “fair value” of the entire trend leg
A tag here marks trend reset, not breakdown
A break below this layer shifts the market into caution
This long AVWAP is safely under price so the long-cycle trend remains intact
When all layers are stacked in ascending order like this, you get a fully aligned bull structure, clean pullback architecture, no overhead VWAP resistance, multi-cohort profit alignment & strong continuation behavior
This model is about control, not prediction & right now, the bullish alignment is simply a fact of structure
These levels come directly from how institutions trade AVWAPs
1. ATH AVWAP (~$618) is the light pullback, common after a fast push off a low
Signals to watch for include a hammer/doji at the AVWAP
Lower wick rejection
ATR contraction & reversal
Reclaim → hold → push
This is the first layer most swing traders buy
2. 3 November AVWAP (~$610)
This is the mid-depth pullback
It’s usually triggered when short-term longs trim
Expect a strong buyer reaction
1-2 days of stabilizing candles
Momentum traders stepping back in
This is a very strong continuation level in AVWAP systems
3. 21 November AVWAP (~$605)
This is the high-value dip
This line is VWAP traders’ favorite
It represents the true reversal cohort’s cost basis
It has been respected perfectly
It rises steadily each day
It marks the “line of trend continuation”
If price reaches this AVWAP, this is often the highest-probability buy in the entire structure
Rejecting here = trend continuation
Closing below = trend fatigue
4. Long-Term AVWAP (~$592)
This is the deep reset, not a casual dip
If price ever hits this momentum is gone, trend is resetting, higher timeframe traders reassess, hedge funds rotate & isk allocation shifts
This is not a breakdown, but it is a significant tone-change
You rarely see this tested unless markets enter a broader digestion phase
Given the current AVWAP spacing & slope
$618 (ATH AVWAP) is highly actionable
$610 (3 November AVWAP) is a strong level
$605 (21 November AVWAP) is an institutional-grade support
When price is above all 3, VWAP traders don’t look for tops - they monitor control transitions
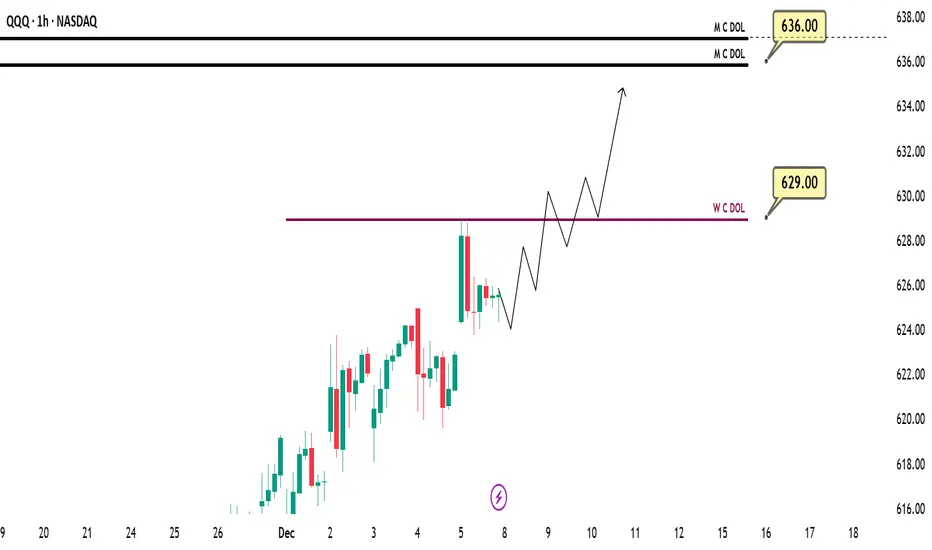
QQQ (US100 – USTECH – NQ) WEEKLY PREDICTION - (08 DEC)QQQ (US100 – USTECH – NQ) WEEKLY PREDICTION
📊 Market Sentiment
Market sentiment remains bullish, supported by expectations of a potential FED rate cut in December.
Additionally, Trump’s likely nominee for the next FED Chair Kevin Hassett, a strong advocate of aggressive rate cuts has strengthened this bullish outlook.
Markets have already begun pricing in the possibility of earlier and more aggressive cuts throughout 2026, fueling continued upside momentum.
📈 Technical Analysis
QQQ is strongly bullish at the moment.
In my opinion, as long as SPY continues pushing toward all time highs, QQQ is unlikely to experience any meaningful retracement.
📌 Game Plan – Prediction
I expect QQQ to reach 629 this week at minimum.
A strong move may occur right after the market opens however, since the FED decision will be released on Wednesday, the early part of the week may show some choppy or ranging price action.
💬 For deeper sentiment and strategy insights, subscribe to my Substack free access available.
⚠️This analysis is for educational purposes only and does not constitute financial advice. Always conduct your own research before trading or investing.
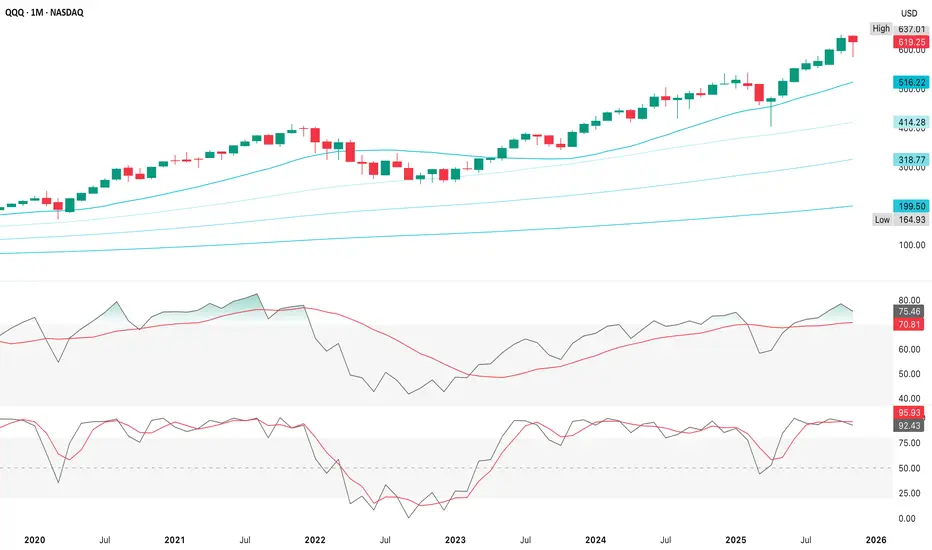
QQQ (28 November)November's monthly candle is closer to a hanging man than a hammer, but the context determines whether it’s actually bearish, since a true hanging man requires 1) a long lower shadow (yes), 2) a small real body near the top of the range (yes) & 3) appears after a strong uptrend (definitely yes)
The candle is bearish only if the next candle confirms with a break below the low
A hammer has the same shape, but appears after a downtrend , which is not the case here
So structurally it matches a hanging man, not a hammer, but a hanging man is a weak signal on higher timeframes without confirmation
The setup appears neutral-to-risky, but not confirmed bearish
The close is still strong, near the top of the range
There’s no follow-through since November just ended
Momentum (RSI/stoch) are cooling, but not rolling over
Price is still well above the 20 SMA
Historically on QQQ, monthly hanging man candles often lead to nothing unless the next month breaks the prior month’s low
The signal is warning, not reversal
The long-term structure is still upward
The 20 SMA around $516 is the first major support in a correction
Price at ~$619 is massively extended above all long-term trend baselines
This makes a blow-off or exhaustion candles more likely
Big wicks more common
Long-term risk higher than short-term risk, but none of this says “trend over"
The November candle is has bearish potential, not confirmed bearish
The up trend is strong which reduces the reliability of reversal patterns
SMAs are flattening, but not breaking so long-term uptrend fully intact
Confirmation is missing, or not yet realized
Trend is still bullish & the candle is just noise at the top of an extended move
If QQQ breaks below the low of that monthly candle in December (~$590), it would confirm the hanging man & open a deeper retrace toward the 20 SMA (~$516)
If next month stays above the low, the hanging man is invalid & the trend continues
QQQI think we could be completing a 1-2 here could have a bigger retracement I think were higher by year end. wdy think
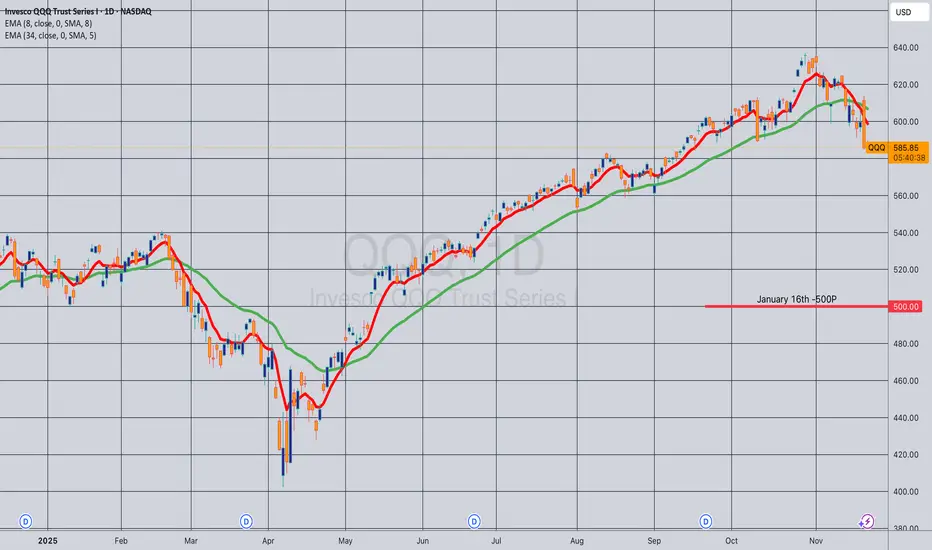
Opening (IRA): QQQ January 16th -500P... for a 5.22 credit.
Comments: My SPY position is becoming somewhat of a spaghetti works, so opting to open a run in the Q's instead, targeting the strike paying around 1% of the strike price in credit.
Will look to add/ladder out at intervals, assuming I can get in at strikes better than what I currently have on.
QQQ: Price Action & Swing Analysis
Balance of buyers and sellers on the QQQ pair, that is best felt when all the timeframes are analyzed properly is shifting in favor of the sellers, therefore is it only natural that we go short on the pair.
Disclosure: I am part of Trade Nation's Influencer program and receive a monthly fee for using their TradingView charts in my analysis.
❤️ Please, support our work with like & comment! ❤️
QQQ: Market of Sellers
Looking at the chart of QQQ right now we are seeing some interesting price action on the lower timeframes. Thus a local move down seems to be quite likely.
Disclosure: I am part of Trade Nation's Influencer program and receive a monthly fee for using their TradingView charts in my analysis.
❤️ Please, support our work with like & comment! ❤️

QQQ Trading Opportunity! SELL!
My dear friends,
QQQlooks like it will make a good move, and here are the details:
The market is trading on 619.15 pivot level.
Bias - Bearish
Technical Indicators: Supper Trend generates a clear short signal while Pivot Point HL is currently determining the overall Bearish trend of the market.
Goal - 609.75
Recommended Stop Loss - 623.82
About Used Indicators:
Pivot points are a great way to identify areas of support and resistance, but they work best when combined with other kinds of technical analysis
Disclosure: I am part of Trade Nation's Influencer program and receive a monthly fee for using their TradingView charts in my analysis.
———————————
WISH YOU ALL LUCK

QQQ ATH in for awhileIn a related posted, looked at ATH on Oct 29th. That has held so far. Now looking at the next phase. It looks like we have a 3-3-3-3-3 leading diagonal.
I'm looking for a pop anywhere from 610 to 625, maybe get the first bear gap, maybe both? It depends on how the first pullback My assumption is 616 at least, gives bulls a breakout, potential retest, then drop from there. Possibly test the bear gap at 626.
Marking this as a short for beginning of Dec after.
How the next couple weeks go!
QQQ The Road Not TakenA trend reversal requires a higher high, followed by a higher low that holds & a second higher high - it needs that staircase
Sell volume should decline on dips & buy volume should rise on bounces
QQQ did see rise in volume on the reclaim of the 50d MA & that leans bullish, but we need to see if that continues into Monday-Tuesday
The bounce off the October low above the POC to the VAH usually leads back inside the range again
The market is not trending as participants reset inventory
There is a no structural higher-high sequence
Higher timeframe moving averages (20d/50d) still overhead/flat
No major volume climax that signals accumulation
This is exactly what we’d expect in the middle of a range
The bounce off VAL is meaningful, but the strength of the reclaim hasn't printed a higher low & QQQ hasn't broken above VAH with acceptance
Price needs to break above the VAH & consolidate above it (not just wicks/intraday spikes) to cause a trend reversal
Actual acceptance above value
Calling it a reversal leads to chasing the top & misses shorting the strongest part of the move
Price is testing the 4H downtrend line for the 4th time & downtrend lines become stronger each time they’re respected, but the 4th-5th hit is also where they often break, so this is a real inflection point - price is now at the perfect point to fail
This is not yet a confirmed trend reversal
QQQ is in a transitional phase with a potential reversal setup, contingent on holding a very specific level
The recent rally pushed above the prior swing lower-highs & that’s the first requirement of a reversal; however, we do not yet have a higher low
The pullback after breaking above those highs hasn’t printed a clean, confirmed higher low & until that happens, no one can classify this as a trend reversal
This is early-stage reversal behavior, not confirmation
This chart has one single number that tells you everything, the upper red shelf of the volume profile (~$620)
If QQQ closes above it & accepts, the trend reversal is active
If QQQ rejects it & slips back under the 50d MA
QQQ is at the doorstep of a trend reversal
Whenever 2 anchored VWAPs converge, it almost always precedes a breakout if buyers win the retest, or a rejection and full revisit of lows if sellers win
The 10 October AVWAP acted as resistance during the entire decline & is a “memory line” for sellers
QQQ just pressed into it again, but hasn't cleanly reclaimed it
The 21 November AVWAP is rising, respected & acting as support on the last two pullbacks, which is constructive
Momentum is supportive, not conclusive
RSI broke its own downtrend line, but hasn’t made a structural higher high & is sitting right under the midline resistance zone
Stochastic fast %K turned sharply upward, is overbought, but in emerging trends this stays overbought
It's not yet rolling over, so buyers still have short-term momentum
Volume on the bounce is higher than the prior 2 declining sessions which supported the reclaim of the short-term VWAP, not capitulation volume, but does not need to be for a structural inflection
The absence of heavy sell volume after tagging the 10 October VWAP is noteworthy
That VWAP usually triggers a strong sell reaction, but this time it didn’t
QQQ is directly between long-term sellers (10 October AVWAP) & newly established buyers (21 November AVWAP)
That’s how reversals start, but also how traps form
This is a decision point, not a trend
QQQ is right up against the boundary that will define the next 2 weeks
A break and close above 10 October AVWAP signals sellers are done
A break above $612-$614 (prior swing high) confirms structural reversal (higher high)
A retest 10 October AVWAP, hold, then push higher is the “acceptance” signal
Above that, bulls have full control and this becomes a trend reversal
Look for a sharp rejection off 10 October AVWAP, it's a classic continuation down move
Lose 21 November AVWAP on a close & this would confirm the bounce was just rotational
Break below $588-$590 kills the higher-low structure that is forming
Based on the 4H chart, it slightly favors the bullish side as of now because buyers are defending their AVWAP with real activity, sellers failed to slam price at the first test of their AVWAP, momentum flipped from negative to neutral-bullish & price is curling upward into resistance with higher lows, but a failure at the 10 October AVWAP turns this into an immediate downside rotation
If AVWAP breaks, entry on acceptance above 10 October AVWAP with a stop under 21 November AVWAP for a target back to $620 & maybe $628 (range highs)
If rejection triggers, short the rejection wick off 10 October AVWAP with a stop above AVWAP for a target $596 to $590 & maybe $583
It's a holiday week ahead of Thanksgiving & that context matters a lot for how you read every signal on your charts right now because holiday-week flows around Thanksgiving have very specific, repeatable market behaviors that can completely distort what looks like a trend reversal or breakdown
Liquidity is fake or thin & signals look stronger
Market depth is shallow
High-frequency participants step back
Dealers provide less size
Futures markets lead cash markets
Volume shrinks, but ranges don’t necessarily shrink
This creates exaggerated up-moves
A small amount of buying can march price up through multiple levels.
Exaggerated down-moves
A single aggressive seller or macro hedge can flush price 1-2% with no real follow-through
Neither is “real” since it’s the effect of thin books
So those VWAP interactions, those higher low attempts & even that 50d reclaim are all valid structurally, but they’re not confirmed until we see them in normal liquidity
This is why the reversal/rotation distinction is fuzzy
The market isn’t trading at full signal strength
Thanksgiving week historically favors upside drift
Indices tend to float upward into the holiday as funds dress books, shorts de-risk & dealers maintain positive gamma
No new major economic releases
No new institutional rebalance flows
This is not a “trend reversal” - it’s mechanical upward drift
QQQ fits this perfectly
A bounce off value
Grind up toward overhead VWAP resistance
Momentum oscillators improving
Volume profile resistance approached, not broken
This is classic pre-holiday digestion
The real test comes the week after Thanksgiving
The key levels (especially those anchored VWAPs) almost never resolve during this week
The real outcome shows up when liquidity returns, funds resume normal size, post-holiday rebalance flows hit, options positioning resets & macro traders put risk back on
If the breakout is real then it confirms next week
If it was fake then it rejects hard early next week
That’s why this week often produces false starts
Price is moving, but the information value is low - the moves are real, but the signal is not

Market Focus on QQQ — Bullish Setup Taking Shape!🎯 QQQ ($INVESCO NASDAQ-100) Bullish Swing Trade Setup
The Layered Entry "Thief" Strategy | Profit Playbook 💰
📈 MARKET OUTLOOK
The QQQ (INVESCO QQQ TRUST) is positioned for a bullish swing trade setup. 🚀 This technical analysis focuses on strategic multi-layer entry execution with defined risk/reward parameters suitable for intermediate swing traders.
🎪 ENTRY STRATEGY: "LAYERED THIEF" METHOD
This isn't your typical entry—we're using smart limit order layering 🎯 to accumulate positions at key support zones. Think of it as a professional scale-in approach!
📍 Limit Order Entry Layers:
Layer 1: $605.00 ⭐
Layer 2: $610.00 ⭐
Layer 3: $615.00 ⭐
Layer 4: $620.00 ⭐
💡 Pro Tip: Feel free to add additional layers ($625, $630, etc.) based on your risk tolerance and account size. The thief's advantage is patience and positioning!
Entry Triggers: Volume confirmation + Support zone bounce + Institutional accumulation signals 📊
🛑 STOP LOSS (Risk Management)
⚠️ THIEF SL: $590.00
📢 DISCLAIMER: This stop loss is a suggestion only. You are responsible for setting your own risk parameters based on your trading capital, risk tolerance, and market conditions. Trade at your own risk! 🎲
🎊 PROFIT TARGETS (Exit Strategy)
PRIMARY TARGET: $650.00 ✅
SECONDARY RESISTANCE: $660.00 ⚠️
Note: The $660 zone presents strong technical resistance combined with overbought conditions and potential reversal traps. We recommend taking profits at $650 and letting a small portion run if momentum confirms. Smart money moves!
📢 DISCLAIMER: Target levels are suggestions based on technical analysis. Your profit-taking strategy should align with your personal risk/reward ratio. Final exit decisions rest with you! 🎯
🔗 CORRELATED PAIRS TO MONITOR
Keep an eye on these related assets for confirmation signals:
🔴 QQQ Constituents & Index Correlation:
NASDAQ:AAPL (Apple Inc.) — Tech sector heavyweight; if AAPL breaks support, QQQ may follow 📱
NASDAQ:MSFT (Microsoft Corp.) — AI & cloud leader; typically leads QQQ moves upward 🤖
NASDAQ:NVDA (NVIDIA Corp.) — Semiconductor bellwether; massive correlation to tech rallies 💻
NASDAQ:TSLA (Tesla Inc.) — Growth driver; watch for momentum continuation signals ⚡
NASDAQ:GOOGL (Alphabet Inc.) — Large-cap tech anchor; supports QQQ uptrend confirmation 🔍
📊 Macro-Level Pairs:
NASDAQ:NDX (NASDAQ-100 Index) — Direct parent index; should mirror QQQ closely 📈
AMEX:SPY (S&P 500 ETF) — Broader market health check; risk-on environment confirmation ⭐
AMEX:IWM (Russell 2000 Small-Cap) — Risk sentiment gauge; divergence = caution ⚠️
TVC:DXY (US Dollar Index) — Inverse correlation; strong dollar = headwind for tech 💵
Key Correlation Points: Watch for tech sector strength continuation and macro risk-on sentiment. If NDX confirms, QQQ breakout is highly probable! 🚀
💡 STRATEGY BREAKDOWN
✅ Bullish Bias with patience-based accumulation
✅ Defined Risk at the $590 level
✅ Layered Entry for optimal position sizing
✅ Technical Confluence at resistance zones
✅ Risk/Reward Potential = Approx 1:2.5 ratio
🎓 TECHNICAL VALIDATION CHECKLIST
✅ Support zone identification at $605-620 range
✅ Volume analysis at entry levels
✅ RSI divergence confirmation
✅ Moving average alignment (200 SMA positioning)
✅ Institutional order flow patterns
✅ Market structure (Higher Highs/Higher Lows)
✨ If you find value in my analysis, a 👍 and 🚀 boost is much appreciated — it helps me share more setups with the community!
#QQQ #SwingTrade #TechETF #NASDAQ100 #TradingStrategy #ThiefStrategy #LayeredEntry #ProfitPlaybook #Bullish #TechnicalAnalysis #ETFTrading #RiskManagement #ActiveTrading