Trade ideas

QQQ bullish then bearish?i think were in a topping proccess somthing to watch out for we are already seeing the reasons to be bullish evaporate i think we could possibly take out the high but the aftermath will be brutal! wdy think??
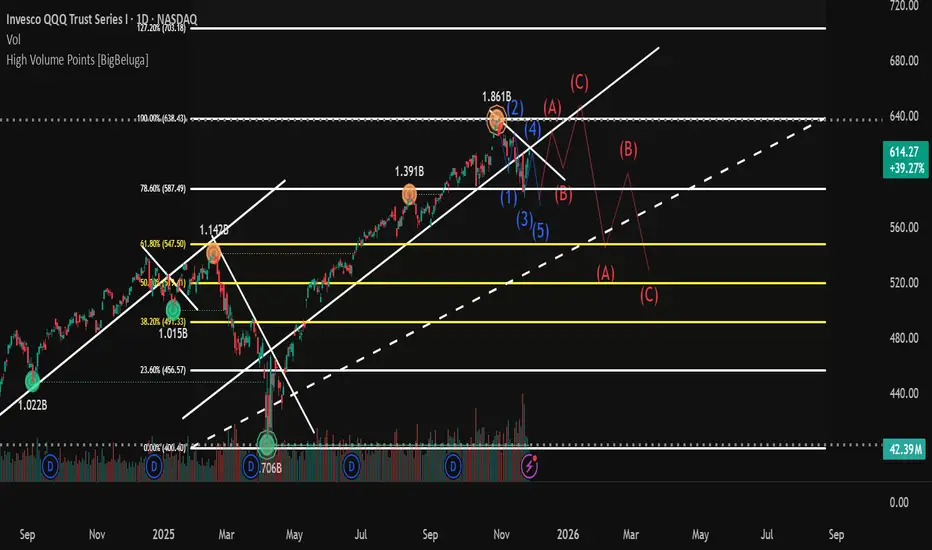
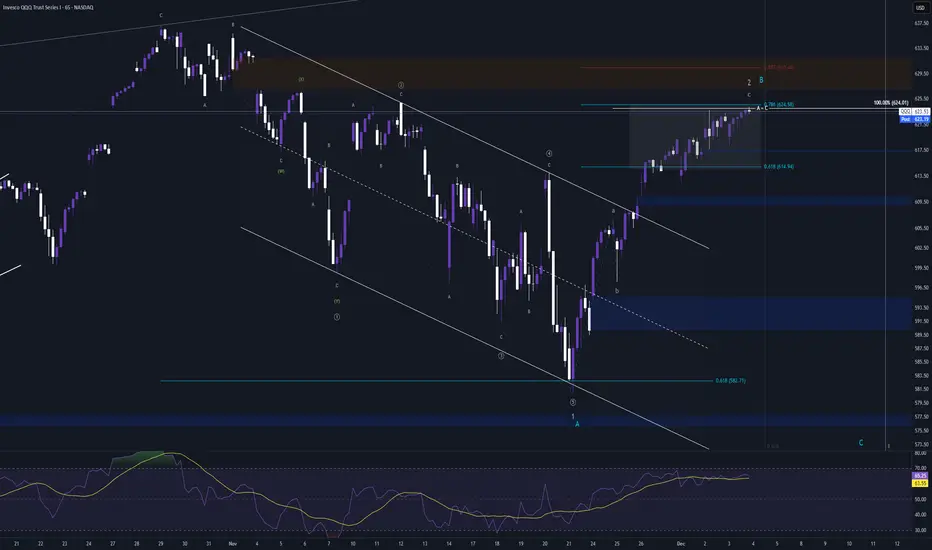
QQQ Bearish Path (Preferred unless $614 breaks)There are 2 competing (4) scenarios
1. (4) Already Bottomed at ~$586
The market tagged the 78.6% retrace (~$586.8)
Price immediately launched into a strong impulsive rebound
Volume confirmed it was real demand, not just a short-cover spike
20d MA is now being tested (~$614)
If reclaimed, this is a strong confirmation of Wave (5) beginning
This would project Wave (5) toward the 123.6–138.2% extensions or a price of (~$692-$726)
2. (4) Extends Lower Toward ~$560
Retest of trendline from 2024 lows
Major structural support ($555-$565)
This scenario remains valid unless QQQ closes above $614 (20d MA) & then holds above $596 on a retest
If that happens, the deeper Wave (4) becomes much less likely
(4) may already be completed because the bounce off $586 was fast, impulsive & clean
QQQ reclaimed short-term moving averages with a steep angle
RSI & Stoch made strong bullish divergences at the low
This behavior is more typical of the end of a Wave (4) correction than of a mid-cycle pullback
If QQQ rejects $614, fails to break $620, price drops & breaks $589 & especially breaks $586, then the deeper (4) target at $558-$565 becomes the primary path
That level coincides with 50% retracement of the entire Wave 3, anchored VWAP from the April low & major volume shelf
Both are valid, but market structure currently favors the upper (4) unless broken

Weekly QQQ (NQ-US100) Outlook - Prediction (23 NOV)Weekly QQQ (NQ-US100) Outlook - Prediction
📊 Market Sentiment
Market sentiment is driven by fear at the moment. In my opinion, we are trading inside a bearish zone. Unless we get meaningful data or positive news, I expect the market to continue declining. Core PPI will be released on Tuesday at 08:30, which could create a minor bullish reaction; however, I personally do not think this will shift the overall sentiment. PPI is not a strong catalyst for a major sentiment change, so bearish conditions are likely to remain in play.
📈 Technical Analysis
Price ran the 613 level strongly and reversed aggressively on Thursday after NVDA earnings. This move trapped the bulls and filled institutional put positions. As I mentioned on Thursday evening, a weak bounce was possible and that is exactly what occurred.
📌 Outlook – Prediction
Scenario 1 (Bearish Scenario):
I believe this scenario is more likely to play out. I expect price to retrace toward 559. If we see strong bullish momentum on Monday, I will likely become more cautious with my puts.
Scenario 2 (Bullish Scenario):
If price shows strong momentum on Monday and reprices toward 614, then I will consider buying calls around 606, targeting all-time highs afterward.
Follow me for daily SPY–QQQ updates. I will update the idea based on evolving price action.
💬 For detailed insights and broader market context, please check my Substack link in profile.
⚠️ For educational purposes only. This is not financial advice.

$QQQ: IS THE PULLBACK OVER ?Has the pullback from the all-time high concluded?
Analysis of the chart indicates that the decline from the all-time high appears corrective. This suggests it is unlikely to undermine the prevailing upward trend that began at the lows observed in April, despite registering a 9% decrease.
It is noteworthy that the 0.382 retracement level lies at 548, and the 200-day simple moving average (SMA) is positioned at 544. Consequently, the correction remains well within the boundaries of the existing uptrend, as it has yet to approach the typical 0.382 retracement threshold.
There is also potential evidence of a bullish flag pattern emerging.
The presence of a bearish marubozu candle followed by a doji during the downtrend could imply a potential reversal, with today's bullish gap-up-and-go serving as a possible confirmation signal.
Furthermore, the 14-period RSI has surpassed its resistance trendline; however, this should be validated by a sustained move above the 50 level.
While there are encouraging technical signals, a definitive bottom has not yet been confirmed yet.
Key indicators to monitor include:
• The establishment of higher highs and higher lows, maintaining support at 588.
• A break above the upper trendline of the flag pattern, including moves above the 50-day moving average and significant resistance at 613.
Although QQQ continues in a favorable direction, it is premature to confirm a conclusive trend reversal at present.
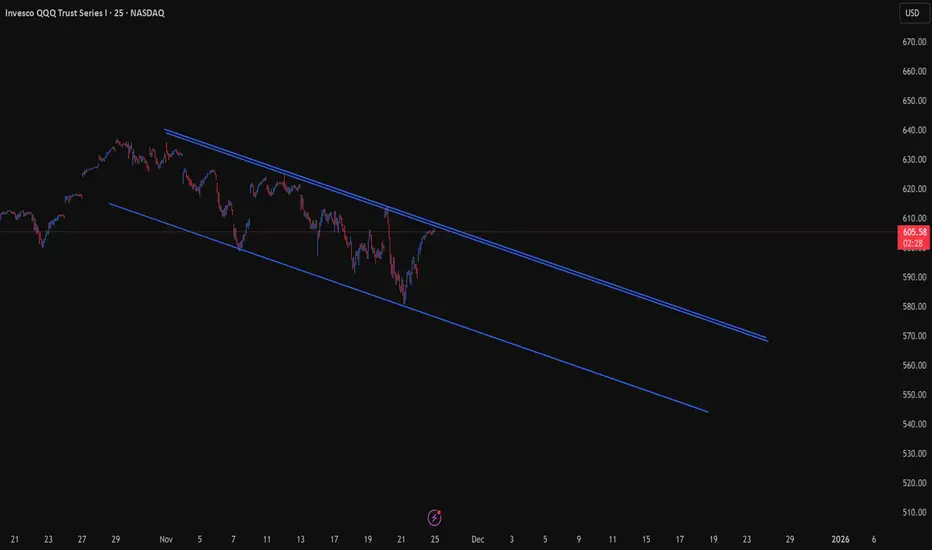
The Geometry of the Week: QQQ Inside the Declining ChannelThis week’s market map centers on a single dominant structure —
a perfect declining parallel channel guiding QQQ through the entire November decline.
Price is now rallying back into the upper rail, the same geometric boundary that rejected every advance this month.
This rail rises at a 1×2 natural angle, meaning:
1 trading day = $2 of vertical movement
A classic slope in fast corrective markets.
1. What Must Happen for the Market to Rise
For QQQ to reclaim strength and retest the November highs, one condition must be met:
QQQ needs a daily close above the upper rail of the declining channel.
Nothing less.
This angle is the gatekeeper.
Without a close above, upside follow-through is limited.
And if price rejects off the trendline?
→ The geometry remains intact
→ The downtrend holds
→ Lower prices become the natural next step
In geometric markets, rejection at the angle is the signal.
2. Compass Reading for the Week
Primary Trend: Down
Secondary Move: Counter-trend rally
Market Location: Testing upper rail resistance
Key Zone: 606-608
Bias: Watch for daily close above or rejection at the angle.
Market Knots Reading — Bull vs. Bear Bias
🔵 Bullish Bias
What the bulls can build a case from:
1. Acceleration is Positive
Acceleration has flipped above zero and is holding there.
This is the earliest sign of internal energy returning.
→ Trend force is rising
→ Short-term conditions favor continuation upward.
2. Speed Is Rising From the Lows
Speed has made a clear higher low and is now climbing toward the mid-range.
→ The market is gaining internal velocity
→ Bulls are defending the short-term structure
3. Price Is Rising Cleanly Within the Channel
On the 50-min view, price is stair-stepping upward and respecting short-term support.
→ Short-term bias: Up
Bull Case Summary:
Acceleration > 0 + rising Speed =
Bulls have the initiative going into the next rail test.
🔴 Bearish Bias
What the bears can counter with:
1. Speed Still Below the October Highs
Even at 125, Speed is far below the momentum peaks seen earlier.
→ The current rally remains weaker than the prior thrusts
→ Internal strength is not matching price strength
2. Rising Into a Major Structure
Price is pushing directly into the upper parallel rail.
→ This is where rallies have consistently failed
→ Bears control the geometry, even if bulls control the short-term motion
3. Acceleration Is Positive But Weak
Acceleration is above zero but not expanding aggressively.
→ This is not “trend breakout” force
→ It’s counter-trend lift inside a broader downtrend
Bear Case Summary:
Speed < November peaks + Weak Acceleration =
Rally may exhaust at the upper rail and fail.
Technologies and Innovations in the Global Market1. Digital Transformation and Industry 4.0
One of the most significant technological trends in the global market is digital transformation, often encapsulated under the concept of Industry 4.0. This term refers to the integration of digital technologies, the Internet of Things (IoT), artificial intelligence (AI), robotics, and big data analytics into industrial processes. By connecting machines, systems, and data, businesses can optimize production, improve efficiency, and reduce costs.
In manufacturing, smart factories equipped with sensors and AI-driven analytics allow real-time monitoring of operations, predictive maintenance of machinery, and adaptive production lines. These innovations enable companies to respond rapidly to market changes, reduce waste, and customize products according to consumer preferences, a trend known as mass personalization.
2. Artificial Intelligence and Machine Learning
Artificial intelligence has become a central pillar of innovation across multiple sectors. Machine learning, natural language processing, and computer vision technologies are being deployed in industries ranging from finance and healthcare to retail and logistics.
In finance, AI algorithms assist in fraud detection, risk assessment, and automated trading. Healthcare benefits from AI-powered diagnostic tools, predictive analytics for patient care, and drug discovery processes accelerated through computational models. Retailers leverage AI for personalized marketing, demand forecasting, and inventory management. The integration of AI into daily operations has enabled companies to make data-driven decisions faster and with greater accuracy.
3. Blockchain and Decentralized Systems
Blockchain technology, initially associated with cryptocurrencies, has evolved into a transformative innovation for the global market. It provides a secure, transparent, and decentralized way to record transactions, which is particularly valuable for supply chain management, finance, and digital identity verification.
For instance, in the supply chain sector, blockchain allows stakeholders to track products from origin to consumer, ensuring authenticity and reducing the risk of counterfeiting. Financial institutions use blockchain to facilitate cross-border payments more efficiently and with lower costs, bypassing traditional intermediaries. Additionally, smart contracts — self-executing contracts on blockchain networks — are revolutionizing legal, real estate, and business agreements by automating enforcement.
4. Internet of Things (IoT) and Connectivity
The proliferation of IoT devices has connected the physical and digital worlds in unprecedented ways. Sensors embedded in everyday devices—from industrial machinery to home appliances—generate massive amounts of data that can be analyzed to optimize performance, predict failures, and enhance user experiences.
Smart cities are emerging globally, powered by IoT infrastructure that manages traffic, energy, water supply, and waste systems efficiently. In agriculture, precision farming relies on IoT devices to monitor soil health, weather conditions, and crop growth, enabling higher yields and sustainable practices. The expansion of 5G networks further accelerates IoT adoption by providing high-speed, low-latency connectivity, making real-time applications more feasible and scalable.
5. Renewable Energy and Sustainable Technologies
Innovation in renewable energy technologies has become a crucial driver of global market dynamics. Solar, wind, hydro, and bioenergy innovations are reshaping the energy sector, making it more sustainable and economically viable.
Technological advancements in solar panel efficiency, battery storage, and grid management are reducing dependency on fossil fuels. Companies are investing in green hydrogen, carbon capture, and smart energy management systems to align with environmental regulations and meet the growing demand for clean energy. Sustainable innovations not only reduce environmental impact but also create new business opportunities in carbon trading, energy-efficient construction, and electric mobility.
6. Fintech Innovations
Financial technology, or fintech, has revolutionized the global financial market by providing digital alternatives to traditional banking and financial services. Mobile banking apps, digital wallets, peer-to-peer lending platforms, and robo-advisors are making financial services more accessible, faster, and cheaper.
Blockchain and AI technologies are particularly influential in fintech, enabling secure digital payments, real-time credit scoring, and automated investment management. In emerging markets, fintech solutions are bridging the financial inclusion gap, allowing unbanked populations to participate in the economy, transfer funds, and access credit with minimal friction.
7. Biotechnology and Healthcare Innovation
The biotechnology sector is another major area of global technological innovation. Advances in genomics, bioinformatics, and molecular biology are transforming healthcare, agriculture, and environmental management.
In medicine, breakthroughs in gene editing technologies like CRISPR have opened doors for treating genetic disorders. Personalized medicine, driven by genomics and AI, enables treatments tailored to individual patient profiles, improving outcomes and reducing side effects. Additionally, innovations in telemedicine, wearable health devices, and remote monitoring are redefining patient care, especially in areas with limited access to healthcare infrastructure.
8. E-commerce and Digital Platforms
The growth of e-commerce platforms has reshaped global trade and consumer behavior. Innovations in digital payment systems, logistics optimization, and AI-powered recommendation engines have made online shopping seamless, personalized, and efficient.
Global giants in e-commerce and emerging platforms in regional markets have expanded reach, enabling small and medium enterprises to access international markets with minimal upfront costs. The rise of omnichannel strategies, integrating online and offline sales experiences, further reflects the transformative impact of technology on retail and consumer engagement.
9. Autonomous Systems and Robotics
Autonomous systems, including drones, self-driving vehicles, and industrial robots, are driving efficiency and innovation in logistics, transportation, and manufacturing. Drones are used for surveillance, delivery services, and agricultural monitoring. Autonomous vehicles promise safer and more efficient transportation networks, while collaborative robots (cobots) work alongside humans in factories to improve productivity.
These technologies reduce labor-intensive tasks, minimize errors, and enhance operational scalability, enabling businesses to respond faster to market demand while reducing costs.
10. Future Outlook and Challenges
While technological innovation propels the global market forward, it also brings challenges such as cybersecurity risks, data privacy concerns, and workforce displacement due to automation. Governments, businesses, and educational institutions are increasingly focused on developing regulatory frameworks, reskilling programs, and ethical guidelines to ensure technology benefits society broadly.
Looking ahead, emerging technologies like quantum computing, extended reality (XR), and synthetic biology hold the potential to further disrupt global markets. Companies that invest in innovation, adapt rapidly, and embrace digital ecosystems are likely to gain competitive advantage, while traditional players face pressure to evolve or risk obsolescence.
Conclusion
Technologies and innovations have become the engines driving growth, efficiency, and competitiveness in the global market. From AI and IoT to renewable energy and biotech, the integration of advanced technologies across industries is creating new business models, enhancing productivity, and transforming consumer experiences. However, the pace of innovation also demands careful consideration of ethical, social, and economic implications. In the coming decades, the ability of nations and businesses to harness these innovations responsibly will define their position and success in the global economic landscape.
December 8 - December 12 2025: Disappointment ImminentThe market has not changed too much since last week, where my assessment that the market was in a neutral state turned out to be mostly accurate. I’m continuing to refine my analysis so I have changed some things heading into this week which should help provide even clearer signals. With the rate decision in focus, it will be important to consider the implications that a cut (which I am biased towards) vs unchanged rates will have on these indicators, as it will likely make the difference between the market continuing its bullish trend to end the year or if equities will continue to feel pressure from high interest rates and a slowing economy.
1. Macro
Here we are seeing low demand for treasuries TVC:US10 and the dollar TVC:DXY while bond and equity put hedging has been unwinding. I think the current state of the market provides a clear signal of why the Fed needs to cut interest rates this month - dumping bonds while growth stagnates will make real yields surge and could cause the market to retreat from US assets altogether, which would be a worst-case scenario. I think the Fed has no choice but to keep cutting rates in order to keep yields down. Since the breakeven rate FRED:T5YIE was rising at the end of last week, a drop in the nominal yield TVC:US05Y now would send the real yield to lower lows.
2. FX
Since the dollar can service as a funding or carry currency, I am comparing US rates to “carry” countries and the dollar index to other carry currencies in order to determine whether investors in this yield-seeking regime would be interested in dollars. Here you can see that compared to yields in Great Britain, Canada, New Zealand, and Australia (not shown), US yields are underperforming, and as a result, the dollar is weakening against the respective currency indices TVC:AXY , TVC:CXY , TVC:ZXY
This is my new indicator that normalizes carry country yields (GB, CA, SE, NZ, AU) vs safe haven yields (JP, CH, EU, & US), shown on the dashed line, and respective currency pairs on the dotted line in order to detect the risk regime. Here we are seeing that carry yields are elevated and the market is still chasing after them compared to rushing to funding currencies for yield or safety.
Here is a comparison of funding countries. My expectation for this week is that
1. The market will still be seeking yield (risk-on)
2. If US yields & USD fall, it will lift carry trades vs USD (such as FX_IDC:CADUSD & OANDA:AUDUSD )
3. Risk-on regime continues, which will boost US equities
Of course, the opposite will play out if the Fed keeps rates high, however they need to keep foreign investors buying US debt in order to sustain our unsustainable debt for a little while longer. Leaving rates unchanged will spook investors about the trajectory of monetary policy and lead to higher yields. This is why I am quite confident we will see a rate cut and am explaining this scenario in more detail.
3. Risk
Credit fear continues to ease, while risk-on tech bets AMEX:XLK recover against safety in consumer staples AMEX:XLP
4. Equity Comparison
Tech is still battered compared to other sectors. A sign of tension will emerge if tech continues to underperform the market while the Fed is signaling continued monetary easing. This would point to a true change in sentiment in which the market may be bearish on Tech. If this were to happen, a major market correction could be on the horizon.
5. Bias
I’ve changed a few things on this layout and moved the CVD indicators to my QQQ chart since they react better to regular market hours order flow. Here I have a Z-score indicator of CME_MINI:ES1! - CBOE:VX1! which shows that the equity regime for September so far is bullish. ADL is flattening out but is not giving a useful signal yet. I also changed the linear Historical Volatility indicator to a Z-score oscillator which shows HV is declining and moving back to its floor, which can also be seen on VIX. Since we are guaranteed to see a major volatility spike after the rate announcement, I think VIX may be choppy until then.
What’s worth noting is that with HV (non-directional) at its floor (sensitive to any Vol spikes) and VIX back to its floor ahead of the rate announcement, this signals to me that equities may have more sensitivity to a downside movement.
+-+-+-+-+-+-+-+-+-+-+-+-+-+-+-+-+-+-+-+-+-+-+-+-+-+-+-+-+-+-+-+-+-+-+-+-+
When viewed together, I think all of this sends an interesting message that points to divergence between Macro/FX and US equities. With the Fed cutting rates into slower growth and Tech underperforming, low HV/VIX makes equities vulnerable to a reduction in risk exposure. I think this is what we will see if rates are cut under the current regime.
1. Yields will fall, but TVC:DXY may hold steady if there is equity pressure in the US.
2. Risk-on yield-seeking trades in FX will continue. Dollar may hold up against other funding currencies but will fall against higher-yielding currencies
3. Tech will underperform
4. VIX catching a bid will correspond with US indices falling
5. Since global environment will still be risk-on, volatility will be limited to the US and may be less intense
As always, the reason I post my analysis is to provide a reference point as the week unfolds, and to backtest my strategies for improvement. For now, my bias is low volatility until FOMC (likely sideways or upside drift) followed by downside later in the week.

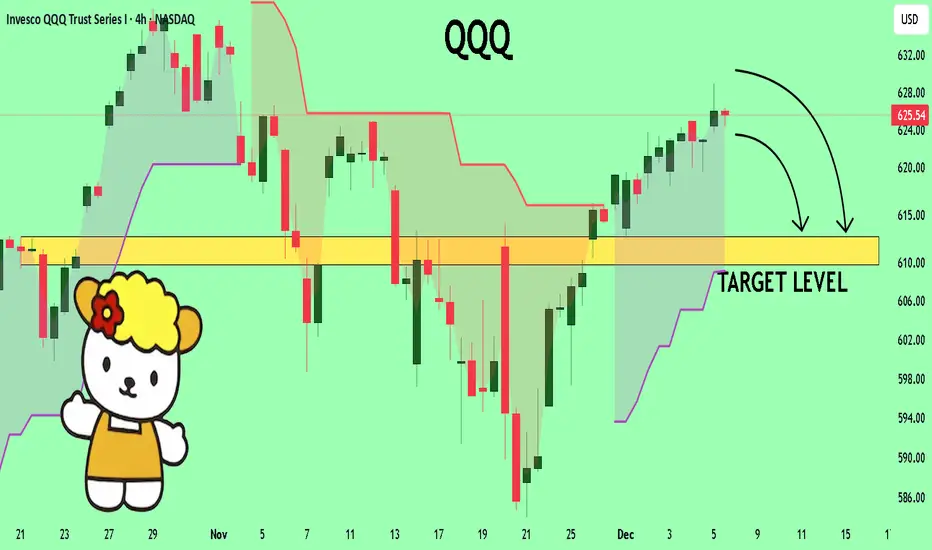
QQQ A Fall Expected! SELL!
My dear followers,
This is my opinion on the QQQ next move:
The asset is approaching an important pivot point 625.54
Bias - Bearish
Technical Indicators: Supper Trend generates a clear short signal while Pivot Point HL is currently determining the overall Bearish trend of the market.
Goal - 612.68
About Used Indicators:
For more efficient signals, super-trend is used in combination with other indicators like Pivot Points.
Disclosure: I am part of Trade Nation's Influencer program and receive a monthly fee for using their TradingView charts in my analysis.
———————————
WISH YOU ALL LUCK
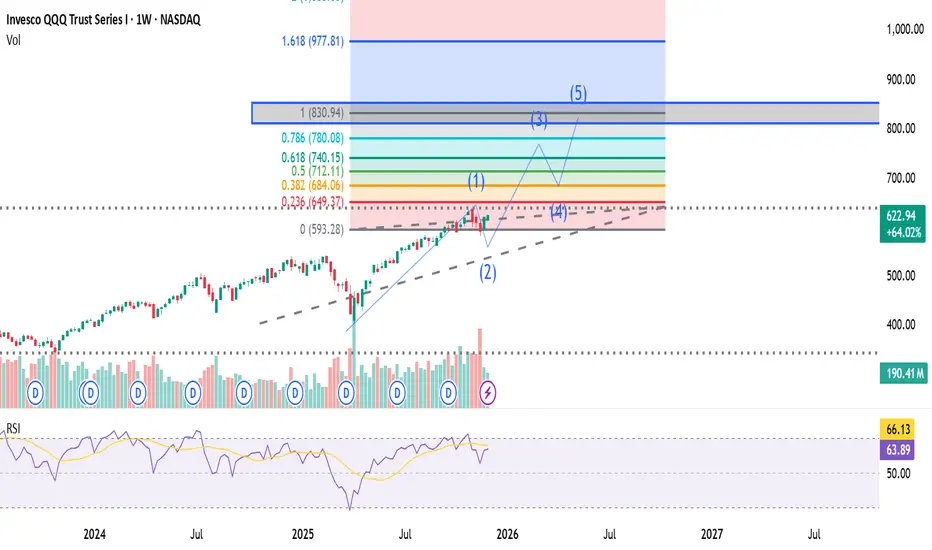
QQQ Long-term target I believe were setting up for a blow-off top!! Targeting the 830$ level!!! lmk what you think
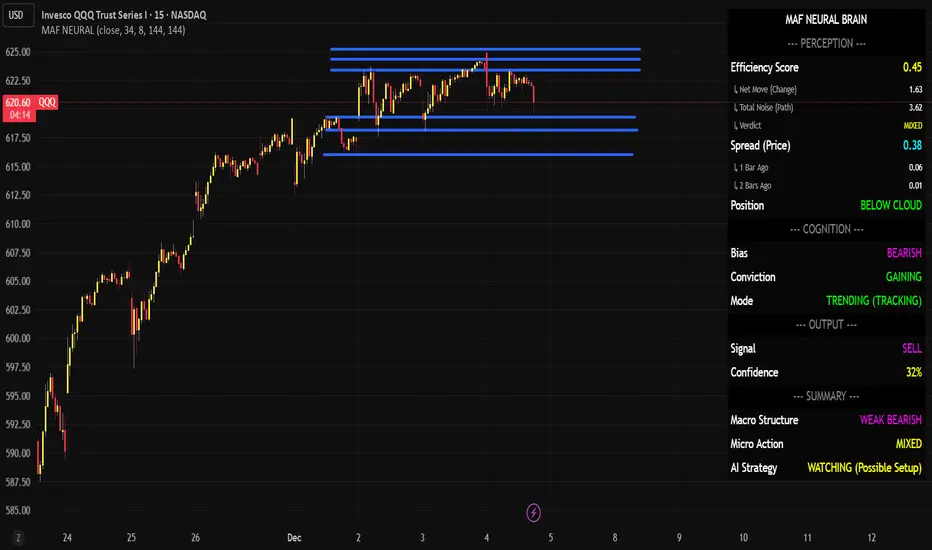
QQQ Neural Brain Analyzing Price Action — Watch ModeCurrent Status: The system is tracking a potential bearish setup, but conditions are not yet aligned for a high-probability entry. The signal is "SELL," but with low confidence (39%), suggesting caution.
1. Perception (The Data)
Efficiency Score: 0.59 (Mixed)
The market is moving with moderate efficiency. It is not purely "choppy" (which would be <0.30), but it isn't a clean, strong trend yet either.
Spread (Price): 0.44
Volatility is somewhat compressed.
Position: BELOW CLOUD
Price is trading below the key resistance cloud, which is a bearish technical characteristic.
2. Cognition (The Trend)
Bias: BEARISH
The underlying trend direction is down.
Conviction: GAINING
Despite the mixed price action, the algorithm's internal belief in the bearish bias is strengthening.
Mode: TRENDING (TRACKING)
The system is in "Tracking" mode, meaning it is following the price action closely rather than filtering it out as noise.
3. Output (The Signal)
Signal: SELL
Confidence: 39% (Low)
CRITICAL NOTE: While the directional signal is valid (Sell), the confidence is below the typical threshold for aggressive entry (usually 70%+). This indicates a higher risk of a false breakout or a "bear trap."
Final Verdict
Macro Structure: WEAK BEARISH
Micro Action: MIXED
AI Strategy: WATCHING (Possible Setup)
Trader's Takeaway: Do not short aggressively yet. The "Neural Brain" is telling you that while the structure is bearish (Price < Cloud) and conviction is building, the current moment lacks the momentum or clarity for a high-confidence trade.
Action: Wait for the Confidence to increase (ideally >60%) or for the Efficiency Score to improve before entering a short position.
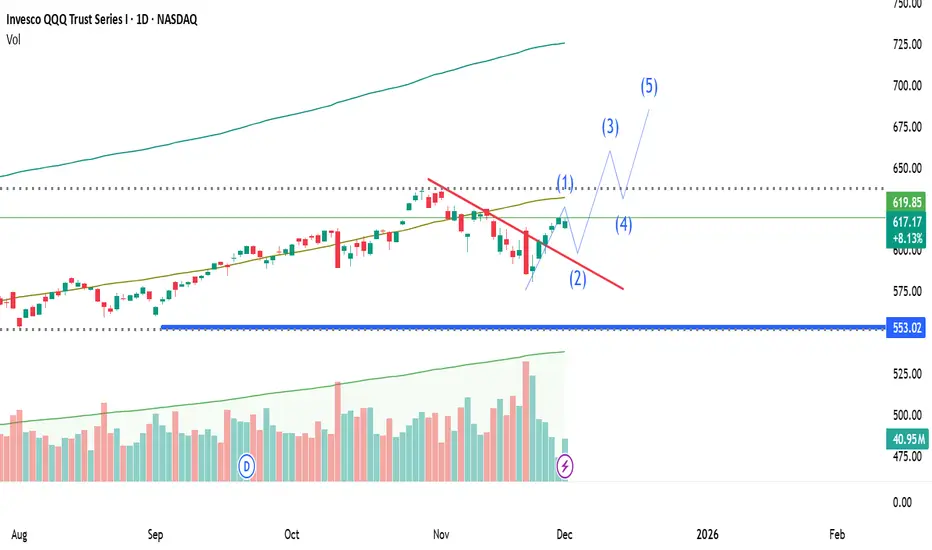
QQQ Rally Finished? A = C reachedIf the previous leading diagonal is accurate, QQQ is currently in my target zone. It was Just shy of the 78% retracement today, but in supply. If last Tuesday (11/25) was a really quick wave B then QQQ also hit A = C in the last hour of trading today and closed below it. SPY went over A=C and closed on it.
Also have bearish divergence. Time wise, we are at 61.8% of the leading diagonal.
The last 3 Thursdays before Thanksgiving were all down days, lets see if we get a repeat tomorrow!
Global IPO Trends: An In-Depth Analysis1. Global IPO Volume and Value
The global IPO market has historically been cyclical, with activity closely tied to market sentiment, investor appetite, and economic growth. In the early 2010s, IPO activity was characterized by a rebound following the 2008–2009 financial crisis, with significant listings in the United States, Europe, and emerging markets such as China and India. By 2014–2015, IPO activity surged due to accommodative monetary policies, low interest rates, and robust equity market performance. Technology, healthcare, and financial services companies were dominant players, reflecting global innovation trends.
In recent years, IPO volumes have fluctuated significantly. For instance, the 2020–2021 period saw an unprecedented boom driven by the COVID-19 pandemic. Remote work, digital transformation, and increased retail participation in stock markets fueled demand for new listings. Globally, companies such as Airbnb, DoorDash, and Alibaba attracted record-breaking attention, both in terms of capital raised and market capitalization at listing. Emerging markets also witnessed strong activity, particularly in India and Southeast Asia, as regional exchanges sought to attract technology startups and fintech firms.
2. Sectoral Shifts
The sectoral composition of IPOs has evolved considerably over the past decade. Traditionally, energy, manufacturing, and financial services dominated listings. However, the global trend has shifted toward technology, healthcare, and consumer-driven companies. Technology IPOs, including software, cloud computing, fintech, and artificial intelligence, now constitute a substantial share of global IPO proceeds.
Healthcare and biotechnology companies have also surged, spurred by innovation in pharmaceuticals, genomics, and medical devices, as well as heightened global health awareness following the pandemic. Consumer-focused sectors, including e-commerce and digital services, have benefited from rapid changes in consumer behavior. Additionally, environmental, social, and governance (ESG)-aligned companies are gaining traction, reflecting increasing investor focus on sustainable and ethical investment opportunities.
3. Regional Trends
Different regions exhibit distinct IPO dynamics shaped by local economic conditions, regulatory frameworks, and investor appetite.
United States: The U.S. remains the world’s largest IPO market by value, driven by the prominence of NASDAQ and NYSE. Technology and healthcare companies dominate U.S. listings. The trend of “dual-class shares” in tech IPOs, which allows founders to retain control, has also become prominent. Special Purpose Acquisition Companies (SPACs) have emerged as an alternative listing route, although regulatory scrutiny has fluctuated their popularity.
Europe: European IPO markets have been comparatively subdued but remain critical for large-scale industrial, energy, and fintech companies. London, Frankfurt, and Amsterdam are the leading centers, with Amsterdam seeing a resurgence due to favorable tax policies and market reforms. ESG-compliant and sustainable investment-focused IPOs are particularly significant in Europe.
Asia: Asia has experienced robust IPO activity, especially in China, Hong Kong, and India. The Shanghai and Shenzhen stock exchanges have attracted domestic and international investors, driven by technology, fintech, and consumer goods sectors. Hong Kong continues to serve as a gateway for Chinese companies seeking global investors. India’s IPO market has expanded dramatically in the past five years, led by technology, renewable energy, and financial services companies.
Emerging Markets: Southeast Asia, Latin America, and Africa are witnessing gradual but meaningful IPO growth. Governments and exchanges in these regions are actively encouraging listings through regulatory reforms and incentives, aiming to deepen capital markets and support local entrepreneurship.
4. Market Drivers
Several factors drive global IPO trends:
Macroeconomic Conditions: Low interest rates, liquidity injections by central banks, and fiscal stimulus programs often create conducive conditions for IPO activity. Conversely, high inflation, geopolitical tensions, or economic slowdown can depress IPO markets.
Investor Sentiment: Retail investor participation has grown significantly, especially post-2020, shaping demand for new offerings. Bullish market sentiment encourages higher valuations and more IPO launches.
Technological Innovation: Advancements in technology and the rise of startups have fueled a wave of listings, particularly in sectors like software, cloud services, fintech, electric vehicles, and green technologies.
Regulatory Environment: Liberalized listing norms, digital filing systems, and incentives for small and medium enterprises (SMEs) have facilitated IPO growth. On the other hand, stringent disclosure requirements or regulatory crackdowns can slow market activity.
Alternative Listing Routes: The popularity of SPACs, direct listings, and dual-class share structures has provided flexibility for companies, influencing global IPO dynamics.
5. Valuation Trends
Global IPO valuations have witnessed notable shifts. High-growth sectors, particularly tech and biotech, command premium valuations, often reflecting strong investor enthusiasm for innovation rather than immediate profitability. In contrast, industrial or commodity-based listings typically attract more conservative valuations. Regional differences are also significant, with U.S. and Chinese markets often exhibiting higher valuations compared to Europe or emerging markets.
6. Challenges in the IPO Market
Despite robust activity, IPO markets face multiple challenges:
Market Volatility: Economic uncertainty, geopolitical tensions, or sharp stock market corrections can delay or downsize IPOs.
Regulatory Scrutiny: Increasing regulatory oversight, disclosure requirements, and corporate governance standards can raise costs and complexity for prospective issuers.
Valuation Pressure: Overvaluation or speculative investor behavior can lead to post-listing underperformance, affecting market credibility.
Competition from Private Funding: Venture capital and private equity funding allow companies to stay private longer, reducing the immediate need for public listings.
7. Future Trends
Looking ahead, several trends are likely to shape global IPO markets:
Sustained Technology Dominance: Technology-driven IPOs will continue to dominate, with artificial intelligence, cloud computing, and fintech leading the way.
ESG and Green Finance: Sustainable companies with clear ESG objectives are expected to attract higher investor interest, driving IPO growth in this niche.
Emerging Market Expansion: IPO activity in Southeast Asia, Latin America, and Africa is likely to increase as exchanges mature and governments support capital market development.
Alternative IPO Models: SPACs, direct listings, and dual-class share structures will continue to influence how companies access public markets.
Increased Retail Participation: Digital trading platforms and greater financial literacy will expand retail investor influence on IPO pricing and demand.
Geopolitical Considerations: Cross-border IPOs may be affected by trade tensions, regulatory divergence, and global capital flow restrictions, influencing the geographic distribution of listings.
8. Conclusion
Global IPO trends reflect a complex interplay of economic cycles, technological innovation, investor sentiment, regulatory frameworks, and regional dynamics. The past decade has highlighted the growing importance of technology, healthcare, and ESG-aligned companies in shaping IPO activity. While traditional markets like the U.S., Europe, and China remain dominant, emerging markets are increasingly significant players, contributing to a more diversified global IPO landscape.
As companies seek capital to fund growth and investors search for high-return opportunities, the IPO market will remain a critical barometer of economic health and financial innovation. Companies, investors, and regulators must navigate valuation pressures, market volatility, and evolving regulations to ensure sustainable growth in this dynamic global environment. With innovation, digitization, and sustainability at the forefront, global IPOs will continue to evolve, shaping the future of capital markets and investment opportunities worldwide.

QQQI think we could be completing a 1-2 here could have a bigger retracement I think were higher by year end. wdy think
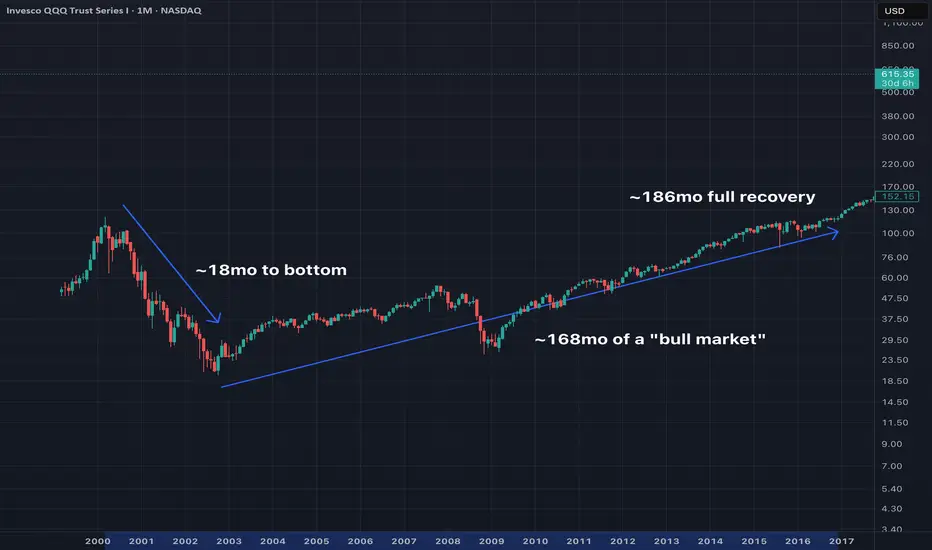
QQQ dotcom crashHere's a study of how long the 2000's dotcom crash took to play out. I think this is a useful study when considering how the '21 DeFi crash may play out
December 1 2025 - December 5 2025: Maximum NeutralityThe market is back in a neutral position. It will be important to assess whether this is the end of a mean reversion or if macro conditions will continue to improve to support a risk-on bias that will likely take us through the end of the year. I’m considering the market to currently be at a point of maximum neutrality, however I lean on the side of the market continuing to seek risk. Time will tell.
1. Macro
We should begin to see more risk confirmation here early in the week. If the regime is risk-on, I think the Dollar will underperform some of the other funding currencies (JPY, EUR, and CHF), so I will be watching to see how treasury pricing TVC:US10 responds to a flat or falling dollar. I would want to see lower real yields FRED:DFII5 (or TVC:US05Y -T5YIE) so it would be preferable to see US10 remain flat or edge higher.
Breakevens are still very low, so the risk of real yields rising is high. I think bond volatility would also bring equity volatility since rising real yields amid slower growth is classic risk-off. Nominal yields will be important to watch.
2. FX
Since the start of November, the dollar has started to lose strength in relation to high-yielding currencies (NZD & AUD), so if we continue to see forex seek yield, that will add to the risk-on bias. I will be watching currency pairs that contain NZD and AUD as well as TVC:GB02Y -US02Y to see if US yields start to lose strength against Great Britain. I would like to see British yields rise in correlation to put further pressure on the dollar.
Currently neutral but I favor the risk-on side here based on what I’m seeing.
3. Risk
Option Adjusted Spreads (corporate bond yield pts above treasuries) are still historically low and are ticking back down, easing fears that corporate bonds are selling off. Private credit recovering also suggests that credit fears are easing across the board. This supports the risk-on bias.
4. Sector Comparison
Consumer Staples AMEX:XLP started to weaken against SP:SPX during last week’s recovery while tech AMEX:XLK outperformed. As shown on the previous chart, it will be important to watch $XLK/XLP as a risk-on/risk-off bias indicator for equities. It will also be important to watch for signs that the market is rotating from healthcare AMEX:XLV to tech $XLK. No important signals on this chart.
5. Bias
Last week’s recovery was confirmed by dealers taking short-volatility positions intraday and the price propelled past monthly VWAP (dashed). The price may revert back towards November’s VWAP level but as long as the level is not breached, it should favor the risk-on bias as well. The price has already retraced 61.8% of the downtrend.
+-+-+-+-+-+-+-+-+-+-+-+-+-+-+-+-+-+-+-+-
Conclusion: As I stated in my introduction, based on my macro indicators the market closed at a point of maximum neutrality on Friday. We will need to see nominal yields mostly flat or falling while VIX sells off to confirm risk-on positioning, however an earlier indicator will be found in Forex, where yield-seeking o aversion can be assessed in real time. With credit conditions also improving, I lean to the bullish side but will keep this Idea neutral to maintain my flexibility.
How Trading Markets Show Growth1. Price Appreciation: The Most Visible Sign of Market Growth
The most straightforward indicator of market growth is price appreciation. When the overall market rises, major indices such as the NIFTY 50, S&P 500, or Dow Jones show upward movement. Price growth reflects confidence, strong earnings, and bullish sentiment.
Why Prices Rise:
Higher corporate profits
When companies post strong earnings, investors expect future growth and push stock prices higher.
Lower interest rates
Cheaper borrowing costs encourage businesses to expand and consumers to spend.
Favorable global cues
Positive geopolitical stability or rising global demand often boosts markets.
Increasing liquidity
When more money flows into markets, it naturally drives prices upward.
However, price growth alone doesn’t always reflect true market strength. Sometimes markets rise due to speculation rather than fundamentals. Therefore, analysts look at other indicators to confirm growth.
2. Market Breadth: How Many Stocks Are Participating?
Market growth is healthier when a large number of stocks across sectors move upward, not just a few heavyweights.
Key Breadth Indicators:
Advance–Decline Ratio (ADR):
A high ADR shows more stocks rising than falling.
New Highs vs. New Lows:
If more stocks hit 52-week highs, it signifies broad participation.
Sector Rotation:
Growth is stronger when multiple sectors—like IT, banking, manufacturing, FMCG—move up together.
A market driven by only a few large companies may look strong on charts but remains vulnerable to sharp corrections. Broad-based rallies indicate sustainable growth.
3. Rising Trading Volumes: Another Major Clue
Volume shows the strength behind price movements. When markets grow with rising volumes, it signals genuine participation by investors.
Why Volume Matters:
Higher trust: More traders and institutions are confident.
Liquidity: Easier to buy and sell without big price swings.
Institutional activity: Large players accumulate stocks during growth phases.
A price rise without strong volume might indicate a temporary or weak rally, but rising prices with strong volume often confirm solid market growth.
4. Increased Market Capitalization: A Structural Indicator of Growth
Market capitalization—total value of all listed companies—offers a long-term view of market expansion.
What Increases Market Cap?
IPOs and new listings
Rising stock prices
Expanding corporate earnings
Sector development (e.g., renewable energy, AI, EVs)
When a market’s total capitalization rises consistently, it reflects economic expansion, more investor participation, and confidence in the business environment.
5. Positive Earnings Trends and Corporate Expansion
Markets fundamentally grow when companies grow.
Corporate actions that signal market growth:
Increasing revenues and profits
New product launches and innovation
Expansion into foreign markets
Large capex (capital expenditure) cycles
Dividend growth
When companies deliver strong results consistently, investors reward them by driving prices higher. Markets often show sustainable growth during periods of economic expansion and rising profit cycles.
6. Foreign Institutional Investment (FII) Inflows
FIIs are major market movers in developing economies like India. When foreign investors increase their holdings, markets grow rapidly because FIIs bring large amounts of capital.
Why FIIs invest more:
Stable government policies
Rising GDP
Favorable interest rate cycle
Strong currency
Attractive valuations
FII inflows often push markets to new highs, indicating global confidence in the region’s economic future.
7. Lower Volatility and Higher Stability
Growth phases are typically marked by lower volatility. When markets rise steadily without large swings, it signals:
Confidence among investors
Predictable economic environment
Stable business cycle
Indicators like the VIX (volatility index) are monitored to gauge stability. Declining volatility during rising markets is a classic sign of sustainable growth.
8. Technological Advancements and Higher Participation
Modern markets grow not only due to fundamentals but also due to structural improvements.
Technology-driven growth factors:
Online trading platforms
Faster execution
AI-based analytics
Increased financial literacy
Global accessibility through mobile apps
The rise of retail participation, especially after 2020, shows how technology boosts market growth by democratizing access.
9. Growth in Economic Indicators
Trading markets reflect the health of the overall economy. When major economic indicators turn positive, markets also show growth.
Key Indicators:
GDP growth
Declining unemployment
Rising industrial production
Higher consumer spending
Stable inflation
Markets often rally in anticipation of strong economic data since investors forecast higher corporate earnings.
10. Strong Business & Policy Environment
Government support can fuel market growth significantly.
Pro-growth policies include:
Lower taxes
Business-friendly regulations
Infrastructure spending
Stable monetary policy
Economic reforms
When the policy environment is supportive, businesses grow faster, which reflects in rising markets.
11. Bullish Investor Sentiment
Sentiment plays a massive role in driving markets upward. When traders feel positive, they buy more aggressively, pushing markets into a bull run.
Sentiment indicators include:
Investor surveys
Derivatives data
Options Put-Call Ratio
Media trends
Social media buzz
Strong sentiment combined with good fundamentals leads to prolonged market growth.
12. The Role of Global Markets
Local markets often mirror global trends. If the U.S., European, or Asian markets rally, emerging markets also show growth due to:
Increased risk appetite
Global capital flows
Lower global inflation
Strong worldwide demand
Trading markets are interconnected, and global strength often signals local growth.
Conclusion
Trading markets show growth through a combination of rising prices, higher participation, healthy economic conditions, strong corporate earnings, and favorable global trends. Growth is not merely a quick rally but a sustained upward movement supported by broad market participation, strong volume, investor confidence, and economic expansion. Understanding these indicators helps traders identify genuine growth phases and avoid temporary or speculative spikes.
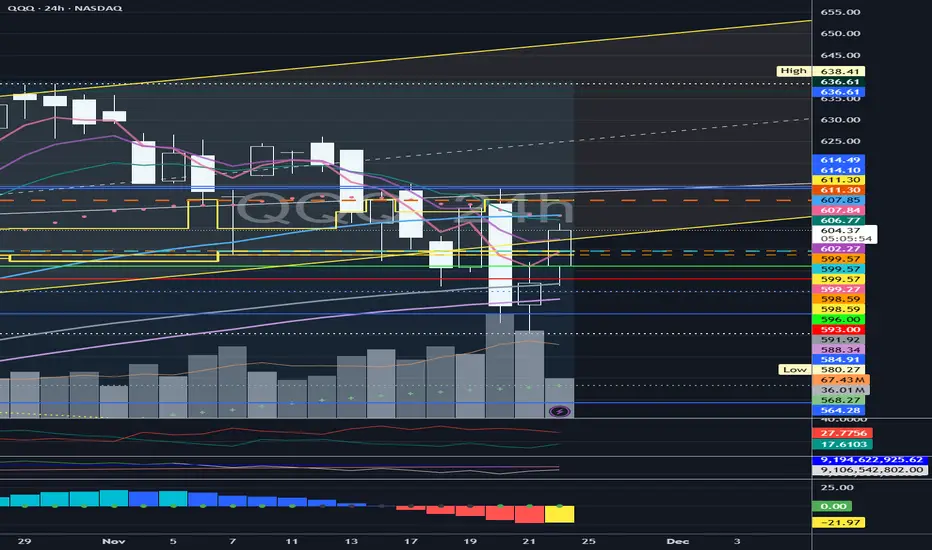
QQQ long-term TAQQQ has broken mid-term uptrend, and it's currently in distribution phase, we have to give it some time to find the bottom, weekly uptrend is still in place.
P.S.
There are many other indicators that are being used for this TA, the above snapshot is only an example.

Reserve Currency Dominance in Global Trade1. What Is a Reserve Currency?
A reserve currency is a foreign currency held in significant quantities by central banks and financial institutions. It is used for:
International trade invoicing
Cross-border payments
Foreign exchange interventions
Investment in global assets
Storing national wealth
To serve as a reserve currency, it must be stable, widely accepted, highly liquid, and backed by strong institutions.
2. Why Some Currencies Become Dominant
A dominant reserve currency does not emerge overnight. It is built through decades of economic, political, and financial advantages. Historically, currencies like the British pound during the 19th century and the U.S. dollar after World War II gained dominance because:
A. Economic Size and Influence
The issuing country must be a major economic power.
The U.S. economy is one of the world’s largest.
Its deep financial markets attract global investors.
When an economy is big, its currency naturally becomes widely used because global businesses want access to that market.
B. Trust and Stability
Reserve currency users expect:
Stable inflation
Strong legal systems
Predictable governments
Transparent financial institutions
Countries hesitate to store reserves in a currency if the issuing government is unstable or unpredictable.
C. Deep and Liquid Financial Markets
Liquidity means assets can be bought or sold easily.
U.S. Treasury bonds are considered the safest and most liquid assets on Earth.
This makes the dollar extremely convenient for global central banks and funds.
D. Network Effects
The more people use a currency, the more others are forced to use it.
It becomes a self-reinforcing cycle:
“Everyone uses the dollar because everyone else uses the dollar.”
3. The Dollar’s Dominance in Global Trade
The U.S. dollar accounts for:
Around 60% of global forex reserves
Nearly 90% of forex transactions
More than 50% of global trade invoicing
Even countries that don’t trade with the U.S. often settle in dollars. For example:
Oil, metals, and agricultural commodities are mostly priced in dollars.
Many international loans and bonds are issued in dollars.
This dominance creates a uniform standard in global transactions and reduces exchange rate risks.
4. How Reserve Currency Dominance Shapes Global Trade
A. Trade Pricing and Invoicing Power
When most global goods are priced in a single currency, it simplifies international trade.
Businesses avoid complex exchange-rate conversions and hedge only against dollar fluctuations.
For example:
India buys crude oil from Saudi Arabia in dollars, not rupees.
Japan buys Brazilian iron ore in dollars, not yen.
This standardization reduces friction in supply chains.
B. Lower Borrowing Costs for the Dominant Currency Country
Because demand for the reserve currency is high, the issuing country can borrow at lower costs.
The U.S. government benefits enormously from this:
Foreign countries buy trillions of dollars in U.S. bonds.
This demand keeps U.S. interest rates lower than they otherwise would be.
Some economists call this the “exorbitant privilege.”
C. Increased Global Influence
Countries that depend on the dollar become sensitive to U.S. policies.
For example:
U.S. sanctions become far more effective because they limit access to the global financial system dominated by the dollar.
Reserve currency dominance therefore increases geopolitical power.
D. Exchange Rate Spillovers
When the dollar strengthens:
Global importers face higher costs
Emerging markets see increased currency volatility
Countries with dollar-denominated debt struggle
Dollar cycles heavily influence global commodity prices and capital flows.
5. Benefits for the Issuing Country
A. Global Demand for Its Assets
Other countries must hold dollar assets (bonds, stocks, etc.) to participate in global trade.
This inflow of foreign capital boosts:
U.S. financial markets
Investment
Corporate growth
B. Ability to Run Larger Deficits
The U.S. can print dollars and borrow cheaply.
This allows:
Higher government spending
Larger trade deficits
A strong consumer economy
Countries with non-reserve currencies don’t enjoy such flexibility.
C. Strong Geopolitical Leverage
The U.S. can limit access to:
SWIFT
Dollar clearing banks
U.S.-based financial institutions
This gives it unmatched diplomatic influence.
6. Challenges and Risks of Reserve Currency Dominance
A. Global Dependence on a Single Currency
Overreliance on the dollar exposes the world to U.S. economic cycles.
A strong dollar can cause:
Global recessions
Debt crises in emerging markets
Commodity price spikes
B. Vulnerability to U.S. Policies
Countries trading in dollars become exposed to:
U.S. interest rate changes (Federal Reserve policy)
Political sanctions
Dollar liquidity shortages
C. Internal Weakness in the Dominant Country
A country with a reserve currency might experience:
Overvalued currency
Loss of export competitiveness
Higher trade deficits
This is sometimes called the Triffin Dilemma.
D. Shift in Global Power Balance
As emerging economies grow, the dominance of a single currency may decline.
China’s yuan, Europe’s euro, or even digital currencies could dilute dollar power in the future.
7. Possible Contenders to Replace or Challenge the Dollar
A. The Euro
Strengths:
Large economic base
Strong institutions
Weaknesses:
Fragmented political structure
Debt issues in some member states
B. The Chinese Yuan
Strengths:
World’s second-largest economy
Rising global influence
Weaknesses:
Capital controls
Limited convertibility
Concerns over regulatory transparency
C. Digital Currencies and CBDCs
Central bank digital currencies (CBDCs) could change settlement systems.
However, widespread trust and adoption are still uncertain.
8. The Future of Reserve Currency Dominance
While the dollar remains dominant, global trends suggest:
Gradual diversification of reserves
Increased regional currencies in trade
Rise of digital settlement networks
Efforts by China and Middle East economies to reduce dollar dependence
But a complete shift away from the dollar is unlikely in the near future because:
No alternative matches its liquidity and trust.
Global markets remain heavily dollar-centric.
Any transition, if it occurs, will be slow and multi-polar.
Conclusion
Reserve currency dominance is a powerful global economic force that shapes international trade, investment flows, geopolitical strategies, and financial stability. The U.S. dollar currently holds an unmatched position due to its liquidity, trust, broad acceptance, and the strength of U.S. institutions. Although challenges such as de-dollarization, digital currencies, and the rise of other economies exist, the dollar’s dominance is supported by decades of structural advantages. Understanding this dynamic is essential for countries, investors, businesses, and policymakers participating in an increasingly interconnected global system.

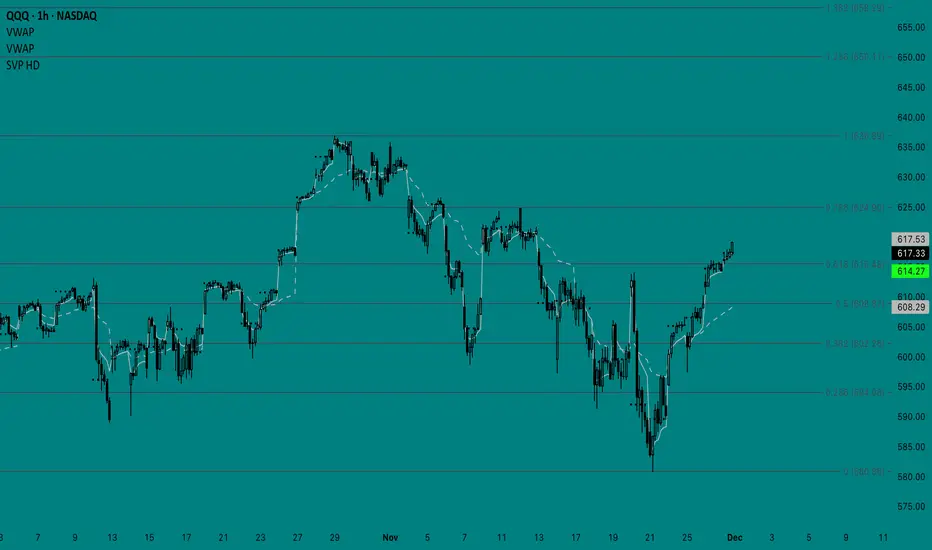
$QQQ day trading short end of day Seeing that they have sold here into close with big money as of 2:52 at 605.20
November 24 - November 28 2025I have recently identified an area of weakness in my trading style. Too often I find myself front-running trades by setting my bias based on where I think my Macro indicators are headed vs where they are positioned currently. Macro moves much slower than equities, so I should instead be looking for volatility setups that align with the current macro bias, and wait for confirmation. No longer should I try to catch the bottom or top, and instead should try to “ride the wave” as a surfer would, with the best entry being an inefficiency while the move is already underway. As a result, I think these Ideas should contain less speculative commentary and instead be more of a snapshot of where things are at heading into the new week, and for my bias to only shift when changes have already presented themselves.
1. Macro
Here, I want to make the point of what time of regime the market is currently in. The financial media is trying to spin the recent sell off as due to inflationary fears and suggestions that the AI bubble has burst. The latter point is debatable so I will not digress into that topic here, however based on what I am seeing, the inflation argument is the opposite of what the evidence shows, and instead the market is seeing lower inflation/growth, sparking fears (for now) that AI stock bets are misaligned with current macroeconomic factors, especially considering that political and trade turbulence that caused the Q1 crash are still present.
Right now, what is important to take away from this is that the dollar is catching a FX bid but is not rallying as it would if institutions were seeking it as a “safe haven”. The same can be said for TVC:GOLD , where rising real yields and falling inflation expectations have kept it flat. The hedge is still there but the buyers and sellers are currently in balance at this price level. $MOVE/VIX and the individual charts show what we already know: equities and bonds have been volatile, but equities significantly more as a proportion to the former. Next, the TVC:US10 and $US10/DXY provide further confirmation that treasuries are not seeing a “safe haven” rally either. TVC:US02Y fell at the end of last week and while the 5Y real yield ( TVC:US05Y -T5YIE) is above average, it will be important to see if it continues to weaken or will goes on to make higher highs, as it will set the tone for the rest of the Macro regime.
Going back to my point about falling inflation expectations being the underlying cause of what is pushing up real yields, the 5Y breakeven chart FRED:T5YIE shows that the downtrend in inflation expectations that began 10/31 has coincided with volatility pressure.
My commodity index (avg of corn, cotton, copper, and aluminum vs DXY) and NYMEX:CL1! also contradict the argument that inflation is making a comeback. Falling commodities i this environment provides further confirmation that growth is stalling.
My current assessment is that the market is risk-off, but the risk aversion is concentrated in equities due to growth concerns. While rate cuts can help boost growth, the rate cut-bet is not what is driving the market. The market needs evidence that growth is increasing in order to snap out of its rut.
2. FX
On FX based on what I currently see (no speculation), the market is risk-off - so the market is seeking safety/liquidity. TVC:DXY has outperformed the other currency indices this month, while US 2Y bond yields are moving lower compared to other “funding” countries. This signals that USD is in fact acting as a safe-haven and the market is expecting lower rates in the US in the future.
The way I’m seeing this tie back into Macro is that the market is expecting lower nominal yields in the near future and is seeking liquidity in USD. The Fed will likely cut into lower growth, but the market will still be risk-averse if falling growth/inflation outpaces falling nominal yields (which could cause real yields FRED:DFII10 to continue rising).
3.Risk
Not much to add here. Pressure continues in private-credit, which is high-risk and highly leveraged. This is definitely a driver of the sell off which does not make the headlines often. IMO private credit could one day act as a major accelerator for market turmoil if bankruptcies are increasing. With rates set to come down and growth declining, this could push private credit to seek higher yields from even riskier bets. $XLK/XLP illustrates the risk-off activity we have been seeing.
4. Bias
Since I’m trying to focus these Ideas on Macro and FX analysis, I’ll have more to say about my short-term analysis in Minds. What I am seeing here on the CME_MINI:NQ1! 1h Renko chart with monthly VWAP overlaid is that the market is very weak in November, as we already know. This pattern seems reminiscent of December 2024. With the Macro picture looking so bad for growth, I think a rise back to ATH would require a major VIX compression.
+-+-+-+-+-+-+-+-+-+-+-+-+-+-+-+-+-+-+
Conclusion: It is important to understand what is driving sentiment in the market, and what I have outlined here shows that it is not rising inflation, as some would like to make us believe. Instead, we should expect weak growth to continue and the Fed to cut interest rates to drive up demand. This creates poor conditions for high-growth bets on tech/AI, especially if disinflation outpaces nominal yields falling. If the Macro/FX/Credit structure stays the same this week, I will only treat daily short-volatility (bullish) positioning to be part of a larger reversion higher (temporary). Long volatility (bearish) days that align with current macro conditions (also bearish for equities), will provide the most profitable trading opportunities.

QQQ rally to 700Chart is about as simple as can be. If the COVID rally can do it, then the AI rally can to.
