NASDAQDO YOU KNOW WHATS BEHIND THIS OR OTHER IDEAS?? in bio..
Preferably suitable for scalping and accurate as long as you watch carefully the price action with the drawn areas.
With your likes and comments, you give me enough energy to provide the best analysis on an ongoing basis.
And if you needed any analysis that was not on the page, you can ask me with a comment or a personal message.
Enjoy Trading ;)
Trade ideas

USNAS100: Key Breakdown Levels Ahead — 24150 Next?USNAS100 | Technical Overview
The Nasdaq index continues to show weakness below 24460, keeping bearish pressure dominant in the short and medium term.
Technical Outlook
As long as the price remains below the pivot line at 24460, the bearish momentum is expected to continue toward 24150.
A break below 24150 opens the door for a deeper move toward 23930.
If the market closes a 4H candle below 23930, this will confirm a stronger bearish trend targeting 23700.
On the other hand, bullish momentum will only be activated if the price closes a 1H or 4H candle above 24760, which would signal a reversal toward higher levels.
Key Levels
Pivot Line: 24460
Support: 24150 · 23930 · 23700
Resistance: 24580 · 24760 · 25200

Could the drop be over?Technical: The index is sitting around 22,078 points, dropping approximately 2.15%.
Fundamental: The decline is linked to a reversal of momentum after NVIDIA Corporation’s strong earnings; although the results were solid, the market interpreted that risks related to interest rates and valuations may still persist.
Key: Keep an eye on the upcoming Federal Reserve interest rate decision and the evolution of employment data, as the market remains sensitive to whether rate cuts will occur or not.

NAS100 Trade Set Up Nov 25 2025Price remains bullish making HH/HL on the 1h so i will be looking to take buys above PDH to target higher BSL levels but first i will wait for more internal structure on the 5m

NAS100 –Long Liquidation, Short Squeeze,LVN Above Still a MagnetNasdaq futures just went through a classic two-step sequence:
Thursday – long liquidation (b-profile)
Fast drop from ~25 200 down to ~23 700.
Single-print style profile, almost no rotations, no absorption.
Price sliced straight through a low-volume void (LVN) between 25 150 → 24 650 – basically “air”.
Friday – short covering (P-profile)
Buyers stepped in around 23 700–23 900 and pushed price back to ~24 5xx.
The daily/session profile built a clear P-shape:
fat upper node around 24 380–24 480, long lower tail.
This is typical short squeeze / covering, not clean accumulation.
From a market-profile / order-flow perspective, that big LVN above is still unfinished business. Markets usually like to come back and “repair” such areas after a liquidation event.
Key Profile Levels
🔵 Thursday VPOC / support: 23 950–24 050
🔵 Friday HVN / acceptance: 24 380–24 480
🔵 Major LVN (thin air): 24 650 → 25 150
🔵 Pre-liquidation VPOC / destination: ~25 150
The rotation path that makes the most sense for me is:
23 950 → 24 380 → 24 650 → 25 150
…as long as we don’t get a fresh macro shock.
Trading Plan (not a signal, just how I see it)
Bias:
Cautiously bullish as long as price holds above 23 950–24 000, looking for the market to rotate back into the LVN above.
1️⃣ Long scenario (base case)
Ideal: early dip / chop above 23 950–24 050, then rotation higher.
First magnet: 24 380–24 480 (Friday HVN).
If price accepts above that zone (multiple 15m / 1H closes and volume building there), I expect a push into the 24 650 LVN edge, with potential extension toward 25 000–25 150 to “repair” the pre-crash profile.
2️⃣ Retest-lower scenario
If sellers hit us right from the open and we break below 24 100, I’m watching 23 950–24 000 as must-hold support.
A clean bounce from there still fits the rotation idea toward 24 380 → 24 650.
Acceptance below 23 900 would invalidate the bullish repair scenario for me and re-open the door to the weekly low 23 700 and even 23 150 HTF demand.
Invalidation
For this LVN-fill view I consider it wrong if:
We build value below 23 900,
Or we see a fresh b-profile / liquidation day under Thursday’s low.
In that case I’d step aside and reassess – that would mean the market is not finished with the downside.
How I’ll Use Order Flow
On intraday order-flow charts (NQ futures):
Looking for buying imbalances / absorption around 23 950–24 050 if we retest it.
Watching 24 380–24 480 for the battle between new sellers and short covering:
Acceptance above → bullish continuation toward 24 650+.
Sharp rejection with heavy sell imbalances → we might just be in a bigger range and the LVN can stay unfilled longer.
Final Thoughts
Thursday looked like forced-out longs (b-profile).
Friday looked like shorts scrambling to cover (P-profile).
There is still a huge LVN above, and these areas are often magnets once the panic phase is over.
As always, this is not financial advice, just my personal read of the auction.
Manage your own risk and sizing – especially after such high-volatility days.

NAS100 – Strong Order Block Explained | High-Volume Breakout & CA Strong Bearish Order Block formed on NAS100 after a powerful bearish Marubozu breakout candle, showing clear displacement and confirming aggressive institutional selling pressure.
1. Large Breakout Candle (Marubozu)
A strong bearish candle broke through previous structure with real displacement.
This is the first sign of a valid Order Block — a move driven by actual institutional flow, not just a liquidity sweep.
2. Clean Imbalance (IMB) Created
Right after the breakout, price left behind a clean Imbalance.
This IMB highlights urgency and confirms that big players were actively pushing the market.
3. Price Returned to the Strong Order Block
After the breakout, price slowly retraced back to the origin of the move — the Strong Order Block.
Once price tapped the OB, it reacted sharply and immediately moved lower, showing that institutional sellers were defending this level.
4. Volume Confirmation
Volume during the breakout was significantly higher than average.
This reinforces that the move was driven by institutional order flow, not retail traders.
🔑 Key Takeaways
This setup is a textbook Strong Bearish Order Block, meeting all core criteria:
Clear displacement
Clean Imbalance formation
Strong volume confirmation
Price returning to the OB and reacting decisively
A high-probability bearish setup built on structure, volume, and institutional footprints.

Nasdaq NAS100 Analysis: The Conditions I Need Before Going ShortI'm keeping a close eye on NAS100 (Nasdaq) right now. 📉✨ On the 4H timeframe, price remains in a clean, sustained bearish trend, and I'm anticipating a potential continuation lower.
If price rejects the current level and fails to retrace through the 1H imbalance, and we see a rotation followed by a bearish break of structure, I'll be preparing for a short opportunity. 📊🔻
Not financial advice.


NAS100 (Buy)All trades and analyses presented here are based on the **Smart Money Concept (SMC)**.
These analyses reflect only my personal perspective on market structure and price behavior, with charts clearly illustrating the details. The main purpose of sharing this content is strictly for **educational purposes** and to exchange personal experiences in trading.
⚠️ **Disclaimer:**
This content does not constitute financial advice, investment signals, or any guarantee of profitability. Financial markets inherently involve risk, and losses are possible. Each individual is fully responsible for their own trading decisions and outcomes. It is strongly recommended to consult with licensed financial advisors before making any investment decisions.

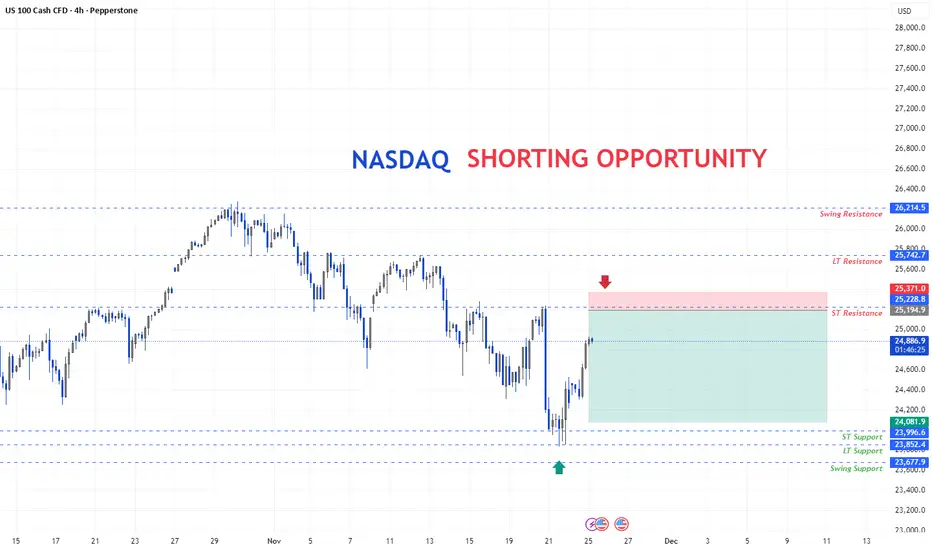
Nasdaq wait for the level for the short entry after market structure broken at the nasdaq, it give a sharp pullback, wait for the entry on the short side at the ST resistance.
NASDAQ Analysis – Accumulating at Resistance With Bullish CorrelThe Nasdaq is currently accumulating right beneath a key resistance zone, showing strength despite last week’s volatility. A positive factor heading into today’s session is Bitcoin’s strong weekend recovery — a move that often correlates with green momentum in equity markets, especially tech.
If the Nasdaq manages to break this resistance with conviction, price could push toward the 25,000 trendline during the week, as we are still roughly 2.5% below that level.
The ideal scenario would be:
A strong breakout,
A clean retest of the broken resistance acting as new support, and
A controlled long-position continuation toward 25,000.
As long as accumulation holds and risk sentiment stays positive, the bias remains bullish — waiting for confirmation and a structured entry.

Next NAS100 TPVolume remains steady, which confirms the reliability of the ongoing trend.
These combined technical factors typically precede price appreciation in the Nasdaq 100 , suggesting the index will likely continue to declineshortly based on trend-following and momentum-based trading strategies with limited immediate overbought risk.

Bullish signalsThe price is bouncing from 100-day EMA and VWAP from late June low on US100 chart (not on NDX though). WXY correction structure looks complete. It can still go lower to test 0.618 fib from August 1 low to top or August 13 peak. RSI shows 2h bullish divergence on all Nasdaq and S&P500 charts. A reversal to new ATH is highly probable from this area (or atleast a high bounce to draw another right shoulder).

NAS100 Professional Technical Analysis
Asset: NAS100 (CFD SPOT INDEX)
Current Price: 24,434.00
Date: November 24, 2025
Market Sentiment: The NAS100 is currently testing a critical psychological barrier at the 24,450 level. Volatility is expected to increase as we approach the US session open.
📊 Technical Indicators & Trend Analysis
Trend Direction: The primary trend remains BULLISH 🐂 on the 4H timeframe, though signs of exhaustion are appearing on the 15m chart.
Relative Strength Index (RSI): Currently reading at 72.5 , indicating overbought conditions. A divergence is forming, suggesting a potential short-term pullback before continuation.
Bollinger Bands: Price is hugging the upper band, with a "squeeze" formation likely resolving in a high-momentum breakout or rejection.
📐 Fibonacci & Harmonic Patterns
Fibonacci Retracement: Key support lies at the 0.382 level (24,380) and the Golden Pocket 0.618 level (24,310) from the recent swing low.
Harmonic Pattern: A potential Bearish Bat Pattern is completing near 24,460. This harmonic reversal zone (PRZ) aligns with our immediate resistance.
🛡️ Support and Resistance Levels
Resistance 1: 24,460 (Daily High / Harmonic Completion)
Resistance 2: 24,525 (Weekly Extension)
Support 1: 24,380 (0.382 Fib)
Support 2: 24,310 (Key Pivot Zone)
🎯 Trade Setup & Forecast
Scenario A: Reversal (Short)
If price rejects 24,460 with bearish engulfing candle:
Entry: Below 24,440
Target 1: 24,380
Target 2: 24,310
Stop Loss: 24,485
Scenario B: Breakout (Long)
If price closes above 24,465 on 1H volume:
Entry: Retest of 24,465
Target: 24,550
Stop Loss: 24,420
⚠️ Summary: Watch for a reaction at the 24,460 zone. The confluence of the Bearish Bat pattern and RSI overbought conditions favors a short-term correction, but the overall trend remains strong. Trade with caution. 📉📈

US100 Reversal Map – Hull MA + Heikin Ashi Confirmation🧠 US100 / NASDAQ100 Profit Pathway Setup — The Thief’s Bullish Escape Plan! 💰🚀
📊 Market Bias: Bullish (Day Trade Setup)
The Thief Trader has spotted a golden pathway in the NASDAQ100 (US100)!
Here’s the breakdown of the plan — straight from the thief’s vault 🕵️♂️📈
🎯 Plan Overview
Bias: Bullish continuation confirmed
Technical Confirmation:
✅ Double Pullback on Hull Moving Average
✅ Retest Zone successfully defended
✅ Heikin Ashi Bullish Doji signaled a trend reversal confirmation
💡 Momentum is shifting upward — the trend has officially changed!
💎 Entry Strategy (Layered Thief Style)
The Thief Strategy applies a layered entry method — multiple buy limits to average into strength.
📥 Buy Limit Layers:
25,300
25,400
25,500
25,600
(Traders can adjust or add more layers based on risk appetite and confirmation zones.)
🛡️ Stop-Loss Setup
This is the Thief SL @ 25,100
⚠️ Note to Thief OG’s:
I’m not recommending my SL as your SL — always customize risk and secure your own bag. Manage your position with discipline and independence! 💼
🎯 Take-Profit Zone
Target: 26,200
🚨 The Police Barricade Zone acts as a strong resistance — overbought levels spotted and potential bull trap alert!
Kindly exit with profit before the officers arrive. 😎
⚠️ Note: Profit-taking is at your discretion. Book and Run!
📈 Related Pairs to Watch (Correlation Insight)
NASDAQ:NDX / CAPITALCOM:US100 / NASDAQ:QQQ : All mirror NASDAQ movement.
SP:SPX / AMEX:SPY : Often correlate with NASDAQ’s momentum (watch divergence for clues).
TVC:VIX : If volatility spikes, expect pullbacks on tech-heavy indices.
TVC:DXY : A weak dollar often fuels US100 bullish legs — keep an eye on it.
NASDAQ:AAPL / NASDAQ:MSFT / NASDAQ:NVDA : Leading drivers of NASDAQ — if they pump, the index follows. 💪
🧩 Key Insights
Hull MA alignment confirms momentum shift.
Retest + bullish Heikin Ashi Doji = market reversal confirmation.
Layered entries give flexibility in volatile intraday conditions.
Dynamic risk management is key — never marry a position.
✨ “If you find value in my analysis, a 👍 and 🚀 boost is much appreciated — it helps me share more setups with the community!”
#US100 #NASDAQ100 #ThiefTrader #DayTrading #IndexTrading #HullMA #HeikinAshi #LayeredEntries #TechnicalAnalysis #TradingSetup #PriceAction #MarketReversal #TradingCommunity #BullishPlan #SmartMoneyFlow #TradeIdeas #ThiefStrategy

NASDAQ: Got a A plus Setup for the Nasdaq 100, Just long and chiNasdaq index seems like buy the dip and forget... NASDAQ: Got a A plus Setup for the Nasdaq 100, Just long and chi

US NAS 100DO YOU KNOW WHATS BEHIND THIS OR OTHER IDEAS?? in bio..
Preferably suitable for scalping and accurate as long as you watch carefully the price action with the drawn areas.
With your likes and comments, you give me enough energy to provide the best analysis on an ongoing basis.
And if you needed any analysis that was not on the page, you can ask me with a comment or a personal message.
Enjoy Trading ;)

Nasdaq Short: Ride the wave 3 of 3 of 3In this video, I updated the Elliott Wave counts for Nasdaq and shows how wave 3 has formed as a series of sub-waves. I also showed that the last wave up (wave 2 of 3 of 3) was stopped at 50% retracement of wave 1 of 3 of 3. So my expectation is that next week we are going to crash in a wave 3 of 3 of 3.
Set the stop for this idea will be above wave 2 of 3 of 3 (around $24,540).
Good luck!

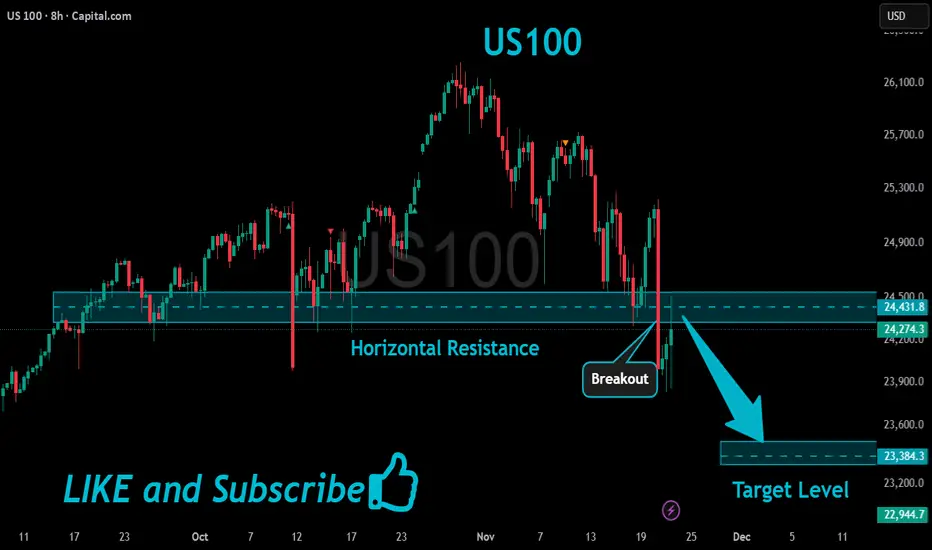
US100 Potential Short!
HI,Traders !
#US100 is making a rebound
But we are bearish biased
And after hits the
Horizontal resistance of 24431.8
We will be expecting a
Local bearish correction !
Comment and subscribe to help us grow !
Rising Expanding Wedge BreakdownI’ve spotted this expanding wedge pattern on the Nasdaq and there is probably more downside imminent for the Nasdaq. I'm sure this isn’t new to most of you. A bearish price target around 23,000 (for now) is highly likely. Long-term I remain bullish (see my other ideas), but right now the extreme fear is handing control to the bears for a while.

Nasdaq The #1 Fear Of Investors BuyingLet me tell you what i did
i searched google and then i type
fear and greed index of the stock market
A page appeared and i saw the link
it took me to a famous
news website
where i saw something very shocking.
The gauge was on extreme fear.
The last time this appeared was in April
of 2025.
Now look at this chart on top..
You will see the RSI
its in the buying channel
because its oversold
This channel is showing
you the right place to buy this stock at a affordable price.
The main stream media
and your favourite Guru
is not talking about this
market recovery
Because its not easy to see unless you
understand trading systems.
Am ready to buy this
are you?
Rocket boost this content to learn more
Disclaimer: Trading is risky please learn risk management and profit
taking strategies.Make sure
you use a simulation trading account before you
trade with real money.

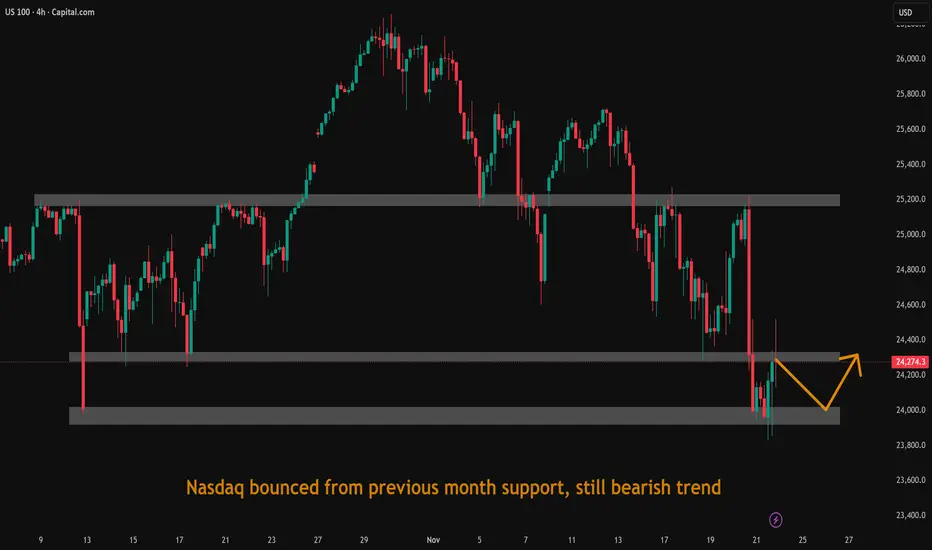
Nasdaq bounced from previous month support, still bearish trendNasdaq bounced from previous month support, still bearish trend.
NAS100 at Crossroads: Bulls Eye 25K Breakout or Pullback Trap?Spot Price: 24,875 | Session: London-NY Overlap | 09:43 UTC+4
━━━━━━━━━━━━━━━━━━━━━━━━━━━━━━
🔎 Market Structure Overview
Price action on NAS100 reveals a consolidation phase following last week's bullish momentum. The index is currently hovering near a critical demand zone, with buyers defending the 24,800 handle aggressively. On the higher timeframes, the trend remains intact, but shorter intervals suggest a potential retracement before continuation.
📈 Multi-Timeframe Breakdown
5M & 15M: Minor bearish divergence forming on RSI as price prints higher highs while momentum weakens. Watch for a pullback toward 24,820 for scalp entries.
30M: Price respecting the ascending trendline from Friday's lows. A breach below 24,790 invalidates this structure.
1H: Ichimoku Cloud providing solid support – Tenkan crossing above Kijun signals short-term bullish bias.
4H: Bollinger Bands tightening, hinting at an imminent volatility expansion. VWAP anchored at 24,850 acting as intraday pivot.
🧠 Technical Confluence Zones
Key Resistance: 24,950 – 25,020 (psychological barrier + prior swing high)
Key Support: 24,780 – 24,720 (demand cluster + 50 SMA on 1H)
⚡ Pattern Recognition
A potential ascending triangle is developing on the 30M chart, with horizontal resistance near 24,920 and rising lows. A decisive breakout above this ceiling could trigger acceleration toward 25,050. Conversely, failure at resistance may initiate a corrective wave toward the 24,700 region.
📐 Wyckoff & Elliott Perspective
Current price action resembles Phase C of accumulation under Wyckoff methodology – a spring or shakeout below 24,800 would confirm smart money absorption before markup. From an Elliott standpoint, we appear to be completing wave (iv) of a larger impulse sequence, with wave (v) extension targeting 25,100+.
━━━━━━━━━━━━━━━━━━━━━━━━━━━━━━
🎯 Trade Setup – Intraday Long
Entry Zone: 24,820 – 24,850 (on pullback to demand)
Stop Loss: 24,740 (below structure invalidation)
Take Profit 1: 24,950 (initial resistance)
Take Profit 2: 25,020 (extended target)
Risk-Reward: Approximately 1:2.5
🎯 Alternative Setup – Short Scalp (Counter-Trend)
Entry: 24,940 – 24,960 (rejection at resistance)
Stop Loss: 25,010
Take Profit: 24,850
━━━━━━━━━━━━━━━━━━━━━━━━━━━━━━
⚠️ Risk Note: Monitor US economic calendar for potential catalysts. Thin pre-holiday liquidity could amplify volatility – adjust position sizing accordingly.
Trade wisely. Protect capital first. 💼
