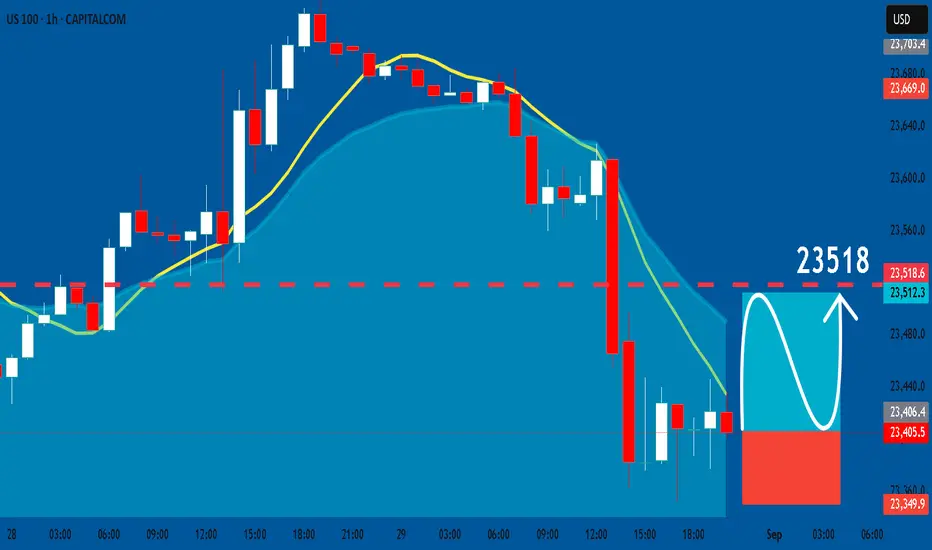
US100: Bullish Continuation & Long Trade
US100
- Classic bullish formation
- Our team expects growth
SUGGESTED TRADE:
Swing Trade
Buy US100
Entry Level - 23405
Sl - 23349
Tp - 23518
Our Risk - 1%
Start protection of your profits from lower levels
Disclosure: I am part of Trade Nation's Influencer program and receive a monthly fee for using their TradingView charts in my analysis.
❤️ Please, support our work with like & comment! ❤️
US100 trade ideas
US NAS100Preferably suitable for scalping and accurate as long as you watch carefully the price action with the drawn areas.
With your likes and comments, you give me enough energy to provide the best analysis on an ongoing basis.
And if you needed any analysis that was not on the page, you can ask me with a comment or a personal message.
Enjoy Trading ;)

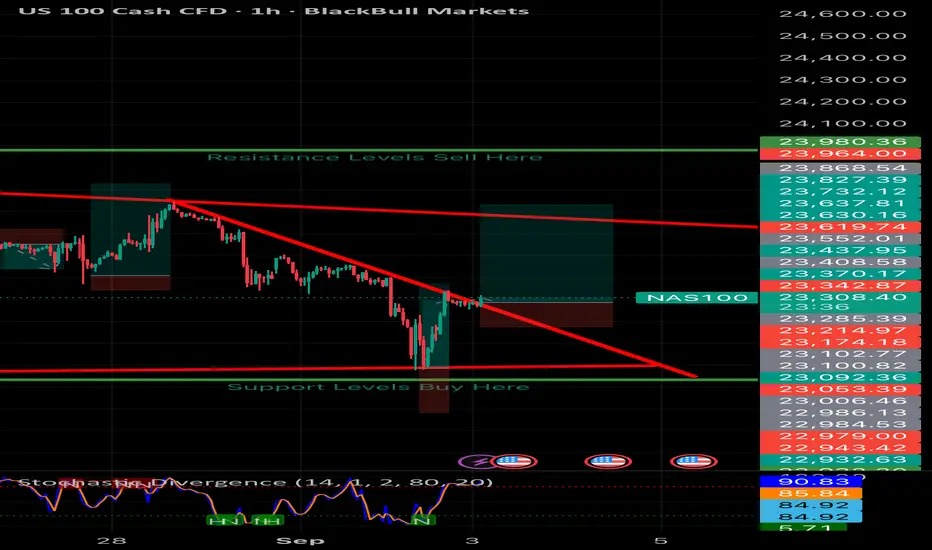
NAS100 technical analysisNAS100 technical analysis. Price just broke through trend line. Confirms price should continue to be bullish and go up to resistance levels.
US100 Consolidating? With raection around 2300 area level, its clear to see that bulls are not ready to let go yet. This purely based of technicals. I'm expecting a bit of a pull to get an entry @ 23211 hopefuly the market will be in our favour.

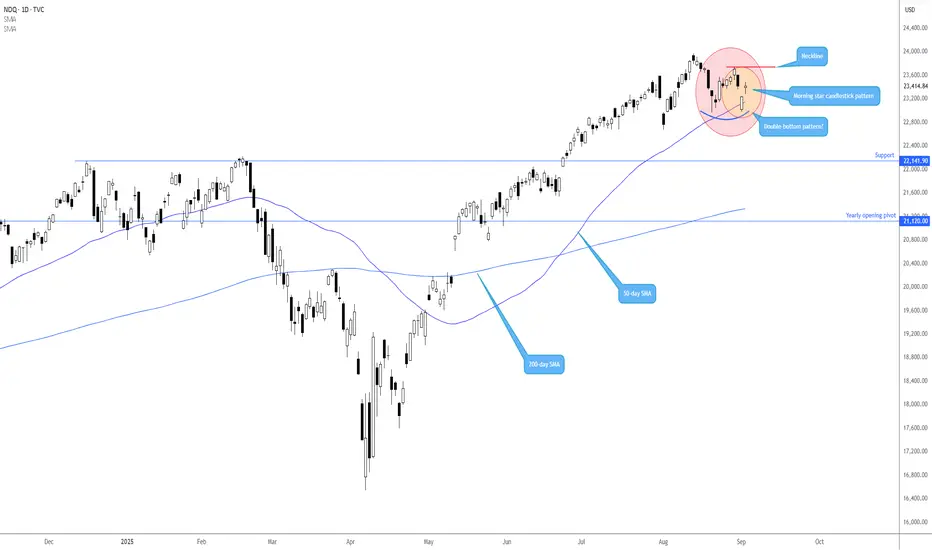
Interesting price action out of the Nasdaq 100Following the Nasdaq 100's rebound from the 50-day SMA at 23,143 on Tuesday, this has delivered two potential bullish scenarios worthy of being added to the watchlist.
First is a potential double-bottom pattern at 22,958, with a neckline calling for attention at 23,741. A breakout north of the neckline sheds light on the Stock Index potentially refreshing all-time highs beyond the current record of 23,969 (13 August).
Second is a possible morning star bullish candlestick pattern formed from the mentioned 50-day SMA. As a note, traders tend to attack this pattern’s structure by placing buy-stop orders above the pattern’s high (third candle in the formation) and positioning protective stop-loss orders beneath the pattern’s low.
Written by FP Markets Chief Market Analyst Aaron Hill
MONDAY EYESIt is better to know what we are up against already, I suspect the push has already been exhausted and might take a break through some small buys to the gap that is over the zone and probably continue lower, gathering sellers into what might turn out to be an overall weekly buy, Anyway, we let the market direct us.
Whats your take?

Bullish bounce off 61.8% Fibonacci support?US100 is falling towards the support level which is a pullback support that aligns with the 61.8% Fibonacci retracement and could bounce from this level to our take profit.
Entry: 23,289.88
Why we like it:
There is a pullback support that aligns with the 61.8% Fibonacci retracement.
Stop loss: 22,983.03
Why we like it:
There is a multi-swing low support.
Take profit: 23,729.56
Why we like it:
There is a pullback resistance.
Enjoying your TradingView experience? Review us!
Please be advised that the information presented on TradingView is provided to Vantage (‘Vantage Global Limited’, ‘we’) by a third-party provider (‘Everest Fortune Group’). Please be reminded that you are solely responsible for the trading decisions on your account. There is a very high degree of risk involved in trading. Any information and/or content is intended entirely for research, educational and informational purposes only and does not constitute investment or consultation advice or investment strategy. The information is not tailored to the investment needs of any specific person and therefore does not involve a consideration of any of the investment objectives, financial situation or needs of any viewer that may receive it. Kindly also note that past performance is not a reliable indicator of future results. Actual results may differ materially from those anticipated in forward-looking or past performance statements. We assume no liability as to the accuracy or completeness of any of the information and/or content provided herein and the Company cannot be held responsible for any omission, mistake nor for any loss or damage including without limitation to any loss of profit which may arise from reliance on any information supplied by Everest Fortune Group.

NASDAQ Index Analysis (US100 / NASDAQ)At today’s market open, the NASDAQ index started to decline and is currently heading to test the key support level at 23,000.
🔻 Bearish Scenario:
If the price breaks below 23,000 and holds, it is likely to move lower towards the next support level at 22,700.
🔺 Bullish Scenario:
If the price rebounds and breaks above 23,260, holding above it may support further upside toward 23,350.
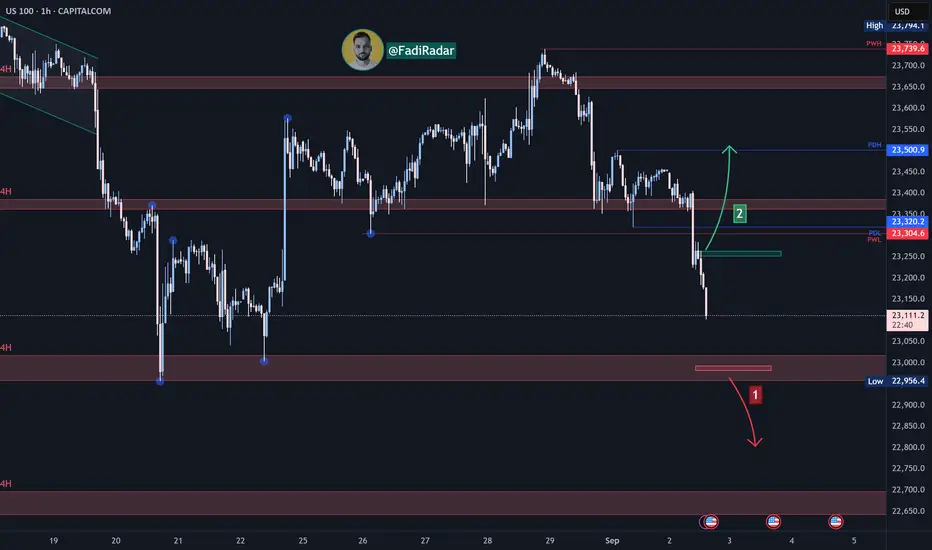
Nas100 Trade Set Up Sep 1 2025FX:NAS100
www.tradingview.com
Price has made LH/LL and has respected a 1h FVG so id like to see price continue lower to take out SSL

BUY STOP (NAS100)NAS is bullish
Inverse H&S
Buy stop on neckline and hold the buy until next psychological number = 24000.00

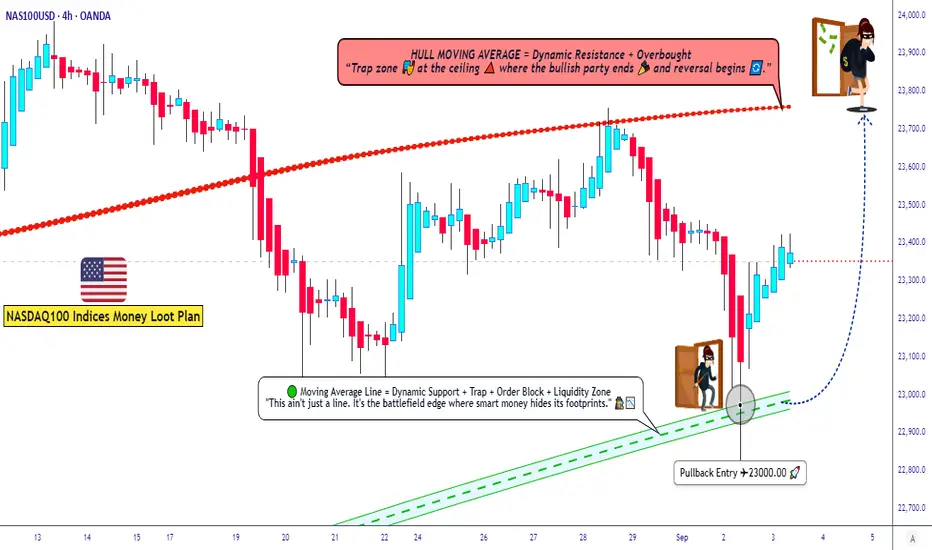
US100 Trading Plan ¦ Layering Strategy + Macro Sentiment Drivers🚀 NASDAQ100 / US100 Index – Thief Money Heist Plan 🎭
📌 Plan: Bullish Swing / Scalping Setup
Dear Ladies & Gentlemen (Thief OG’s), here’s the heist-style breakdown for US100 🔑:
🏴☠️ Entry Style (Thief Layering Strategy)
Using layered limit orders for flexibility & precision:
• 23200.0
• 23250.0
• 23300.0
• 23350.0
(You may increase limit layers based on your strategy & risk appetite)
📉 Moving Average Pullback Entry Plan
• Buy entries on pullbacks to the Fibo level 382 Triangular Moving average zone.
• Look for bullish candles confirming the bounce from these MAs.
• This offers better risk-to-reward by catching momentum on retracements instead of chasing highs.
❓ Why This Works?
• Moving averages often act as dynamic support/resistance in trending markets.
• Institutional traders & algos track them heavily, making them high-probability zones.
• Combining with layering entries = higher flexibility + reduced risk of mistimed single entry.
🛡️ Stop Loss (Protect the Vault)
• Thief SL: @23000.0
• Reminder: Adjust your SL based on your own strategy & risk tolerance.
🎯 Target (Escape Zone)
• Overbought + Trap Zone ahead!
• Escape target: @23750.0
• Note: Don’t rely only on my TP — secure profits at your own pace and risk.
📊 US100 Index CFD Real-Time Data Sep 03
📈 Daily Change: +133.47 (+0.57%)
📅 Monthly Performance: +0.76%
📆 Yearly Performance: +23.48%
😰😊 Fear & Greed Index
📊 Current Reading: 53/100 (Neutral)
🧐 Interpretation: Market sentiment is balanced, showing neither extreme fear nor greed. Investors are cautious but not panicked.
🧠 Retail vs. Institutional Sentiment
👥 Retail Traders: Moderately bullish (55% Long, 45% Short)
🏦 Institutional Traders: Slightly cautious (50% Long, 50% Short)
🔑 Key Drivers: Mixed signals from manufacturing data and upcoming labor market reports.
📉📈 Fundamental & Macro Score
📊 Macro Score: 6/10
Manufacturing PMI (48.7) still in contraction but improving.
Labor market data (JOLTS) awaited for clarity.
⚡ Volatility Score: 5/10 (Moderate)
VIX near average levels, indicating stable expectations.
💧 Liquidity Score: 7/10
Strong volume and breadth in large-cap tech stocks.
🐂🐻 Overall Market Outlook
✅ Bullish (Long): 60%
Supported by strong yearly gains and resilience in big tech.
⚠️ Bearish (Short): 40%
Concerns over manufacturing contraction and inflation pressures.
💡 Key Takeaways
📈 US100 is trending mildly positive today (+0.57%).
😐 Sentiment is neutral—no extreme fear or greed.
📊 Macro data hints at cautious optimism but watch for upcoming labor reports.
🐂 Overall bias leans slightly bullish for long-term holders.
📊 Related Pairs to Watch
FOREXCOM:SPX500
TVC:DJI
TVC:VIX
NASDAQ:NDX
FX:USDOLLAR
✨ “If you find value in my analysis, a 👍 and 🚀 boost is much appreciated — it helps me share more setups with the community!”
#NASDAQ100 #US100 #NDX #SPX500 #DJI #TradingView #SwingTrade #ScalpTrading #LayeringStrategy #MarketAnalysis
NAS100USD (SHORT)
Fib Level to continue Down trent
Break and retest on bullish flag
Nasdaq is a Downtrend

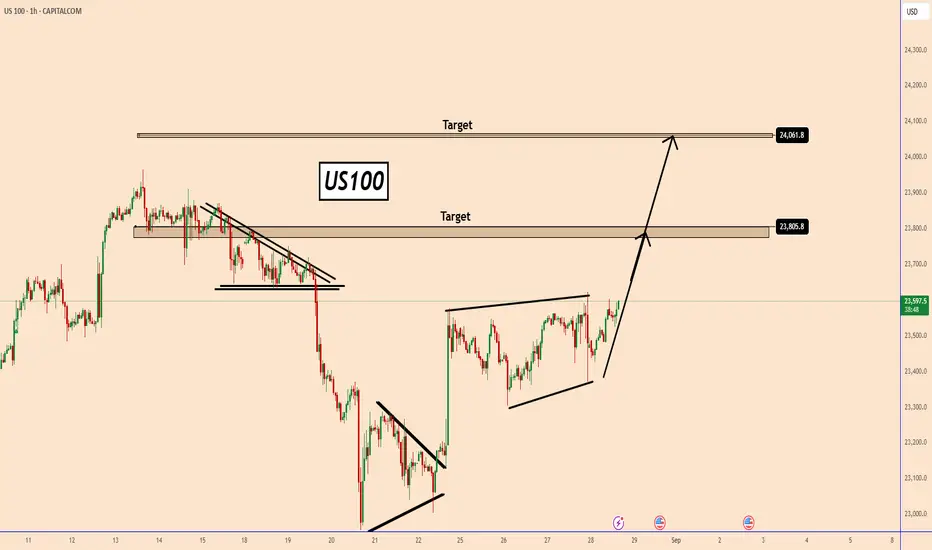
US100: Ready to rise further after good US dataUS100: Ready to rise further after good US data
Today the US reported very good data in general. Despite being preliminary data, they are still showing signs of a strong economy.
Tomorrow the US will report the final data and they have a good chance of being higher than expected.
Given that the US continues to have strong data despite the mess that Trump is creating, there is a good chance that the indices will continue to rise further. They are a clear indicator of the US economy. We must be careful of any manipulation that may occur or from Trump's comments.
US100 completed a clear bullish pattern and it could reach 23800 and 24100 soon
You may find more details in the chart!
Thank you and Good Luck!
PS: Please support with a like or comment if you find this analysis useful for your trading day
US initial jobless claims 229K vs 230K expected
US GDP 2nd estimate for Q2 3.3% vs 3.1% estimate
US PCE prices preliminary 2.0% vs 2.1% preliminary
PCE ex food and energy housing 2.2% versus 2.2% preliminary
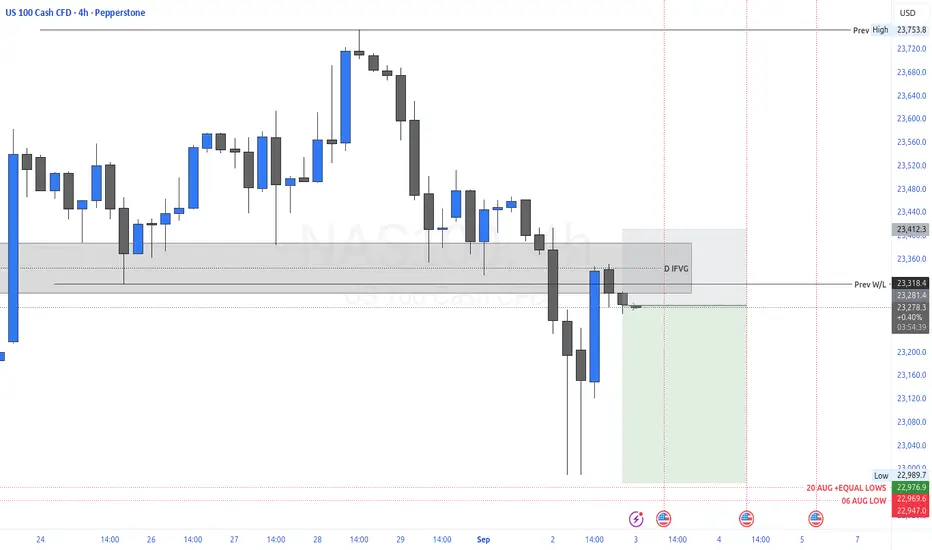
Nas100 Trade Set Up Sep 4 2025FX:NAS100
www.tradingview.com
price has made HH/HL with a big gap in between. It had came up and swept PDH in london session with a close below so what i want to see is either a sweep of SSL, close above, followed by 1m IFVG to go higher or a close below SSL levels to go lower towards HL/PDL

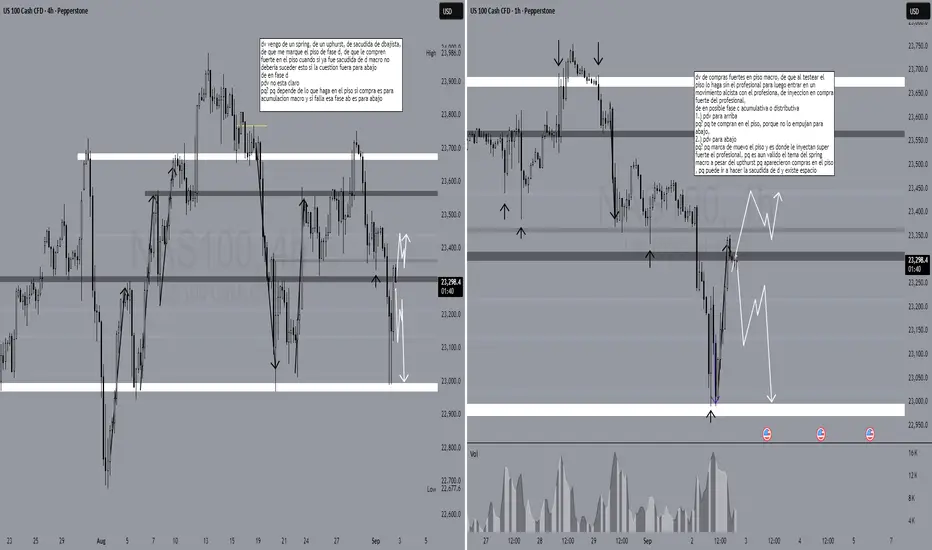
key levels for the nqIf the nq breaks 23362 we have enough information to wait for a shakeout and then enter. if it breaks 23210.7 we got to wait for a retracement and then a shakeout to sell. But, be aware that for sales the target should be more aggressive which means to cover on 23k, and just in case, we can leave a small portion of the position open but cover more than 70% because it might be the macro shakeout.
NAS100 LongThis is now oversold on all timeframes, showing sellers exhaustion
There is a deep crab pattern on H4 and H1 displaying a potential reversal zone
There is great support at this level as daily trend is also pointing up
Double bottom on M15 showing divergence
Stoploss of 150 pips

NASDAQ at Record Highs after US CPI report, but can it last?In today’s video, we break down the major market moves triggered by the July US CPI report. Headline CPI rose 0.2% month-over-month—right in line with expectations and a slowdown from the previous month. Year-over-year, headline inflation came in at 2.7%, just under the 2.8% forecast, while Core CPI rose 0.3% MoM (matching forecasts) but was a bit hotter at 3.1% YoY (vs. 3.0% expected).
These “not as bad as feared” inflation numbers kept hopes alive for a September Fed rate cut, pushing the odds of a cut to 96%. Markets responded strongly: the NASDAQ 100 closed at a record high, just shy of the 24K handle, with broad gains in tech and communication stocks, as traders bet on a more dovish Fed.
We also cover the technical setup for the NASDAQ 100 and key risk factors heading into the second part of August.
This content is not directed to residents of the EU or UK. Any opinions, news, research, analyses, prices or other information contained on this website is provided as general market commentary and does not constitute investment advice. ThinkMarkets will not accept liability for any loss or damage including, without limitation, to any loss of profit which may arise directly or indirectly from use of or reliance on such information.

NAS100 H4 | Bearish Reversal off Pullback Resistance"NAS100 is rising towards the sell entry at 23,679.28, which is a pullback resistance and could reverse from this level ot the take profit.
Stop loss is at 23,939.64, which is a swing high resistance.
Take profit is at 23,292.38, which is a pullback support that alignss with the 50% Fibonacci retracement.
High Risk Investment Warning
Trading Forex/CFDs on margin carries a high level of risk and may not be suitable for all investors. Leverage can work against you.
Stratos Markets Limited (tradu.com ):
CFDs are complex instruments and come with a high risk of losing money rapidly due to leverage. 65% of retail investor accounts lose money when trading CFDs with this provider. You should consider whether you understand how CFDs work and whether you can afford to take the high risk of losing your money.
Stratos Europe Ltd (tradu.com ):
CFDs are complex instruments and come with a high risk of losing money rapidly due to leverage. 66% of retail investor accounts lose money when trading CFDs with this provider. You should consider whether you understand how CFDs work and whether you can afford to take the high risk of losing your money.
Stratos Global LLC (tradu.com ):
Losses can exceed deposits.
Please be advised that the information presented on TradingView is provided to Tradu (‘Company’, ‘we’) by a third-party provider (‘TFA Global Pte Ltd’). Please be reminded that you are solely responsible for the trading decisions on your account. There is a very high degree of risk involved in trading. Any information and/or content is intended entirely for research, educational and informational purposes only and does not constitute investment or consultation advice or investment strategy. The information is not tailored to the investment needs of any specific person and therefore does not involve a consideration of any of the investment objectives, financial situation or needs of any viewer that may receive it. Kindly also note that past performance is not a reliable indicator of future results. Actual results may differ materially from those anticipated in forward-looking or past performance statements. We assume no liability as to the accuracy or completeness of any of the information and/or content provided herein and the Company cannot be held responsible for any omission, mistake nor for any loss or damage including without limitation to any loss of profit which may arise from reliance on any information supplied by TFA Global Pte Ltd.
The speaker(s) is neither an employee, agent nor representative of Tradu and is therefore acting independently. The opinions given are their own, constitute general market commentary, and do not constitute the opinion or advice of Tradu or any form of personal or investment advice. Tradu neither endorses nor guarantees offerings of third-party speakers, nor is Tradu responsible for the content, veracity or opinions of third-party speakers, presenters or participants.

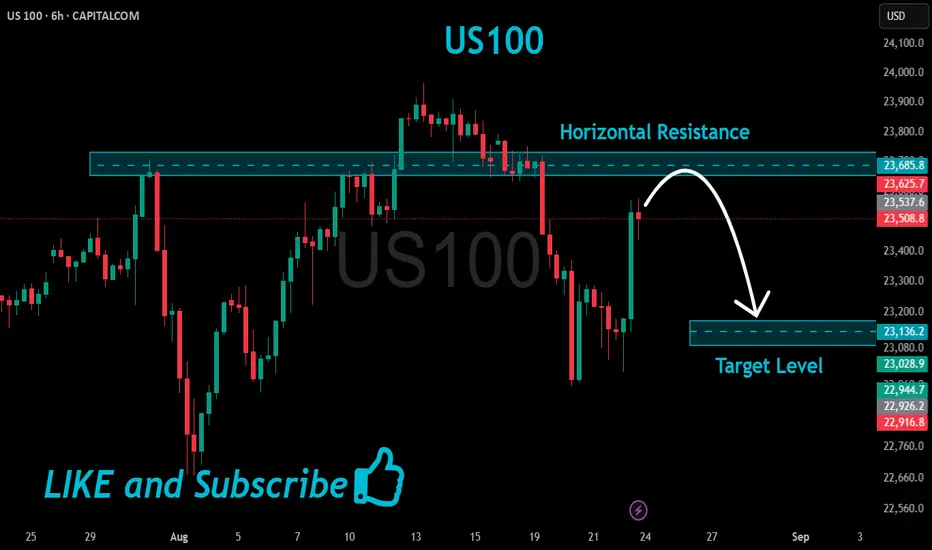
US100 Resistance Ahead!
HI,Traders !
#US100 is trading in an
Uptrend and Silver shot
Up sharply today and it
Is now locally overbought
So after the retest of the
Horizontal resistance above
At 23685.8 from where we
Will be expecting a local
Bearish move down!
Comment and subscribe to help us grow !
SPY/QQQ Plan Your Trade Update For 8-26This new video should help you understand the dynamics playing out related to SPY/QQQ, BTCUSD and GOLD/SILVER.
Get some.
#trading #research #investing #tradingalgos #tradingsignals #cycles #fibonacci #elliotwave #modelingsystems #stocks #bitcoin #btcusd #cryptos #spy #gold #nq #investing #trading #spytrading #spymarket #tradingmarket #stockmarket #silver

Nas100 Trade Set Up Sep 2025FX:NAS100
www.tradingview.com
Price broke PDL and approaching daily SSL while making LH/LL so i want to see a slight pull back before continuing lower

Naz 100 in a tricky spotIts trying to break that downtrend as it got oversold on the way down.lets see if it can break the trend
