Naz 100 in a tricky spotIts trying to break that downtrend as it got oversold on the way down.lets see if it can break the trend
US100 trade ideas

NAS100Currently in bullish movement. Waiting for retracement or pullback to the marking zone and looking for a buy opportunity. Please wait for the close candle to make a decision or execute for trade.
H4-H1-M15

Nas100 Trade Set Up Sep 3 2025FX:NAS100
www.tradingview.com
Price is within a LH and LL range so i would like to see LH or PDH swept as liquidity before a continuation back down towards SSL

NAS100 SELL 15 MINUTE TIMEFRAMESTRONG SUPPLY ZONE Fair value gaps to fill Amazing Range 3:1 Risk Reward, Let's See!

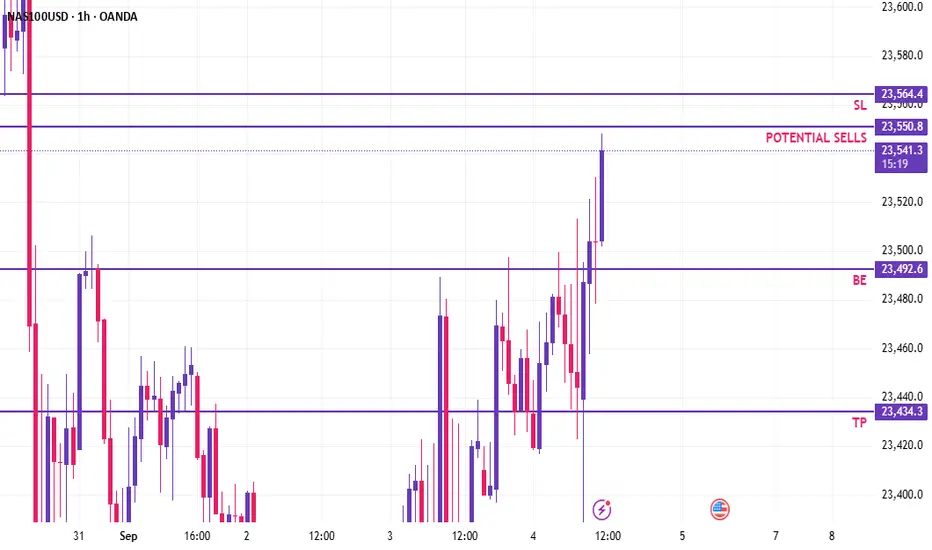
NAS100 | Price is approaching a key level for potential sellsAs price approaches this key level price could potentially sell off if we see good rejection. Let price play out and see if sellers step in at this level. If we are below look for sells above buys.
USD100 BULLISH CONTINUATION IDEA 📈 Bullish Continuation Idea
🔹 Technical Analysis
Trend Bias: All higher timeframes confirm a bullish continuation trend.
Key Structure: On the H4 timeframe, price formed a higher low (HL) at the 38.2% Fibonacci retracement, supporting the bullish bias.
Profit Target: First TP at the -27% Fibonacci extension (24,000 – 24,070 zone).
Liquidity Targets: Markets typically hunt liquidity (daily highs/lows, swing points, equal highs/lows). The prior swing high on the daily provides additional confluence for this target.
Lower Timeframe Structure: H1 shows bullish HH/HL structure. Price fully mitigated the recent H1 Fair Value Gap (FVG) and swept the recent data low, possibly offering a strong entry zone for continuation upwards.
🔹 Fundamental Analysis
While N100 often moves independently of news, key events can act as catalysts:
Wednesday 09/10/2025 – Core PPI (Low-Moderate Impact):
If PPI prints lower as expected, this should fuel bullish momentum.
No major rallies or crashes expected, but could provide continuation fuel.
Thursday 09/11/2025 – CPI Y/Y (High-Moderate Impact):
Historically, N100 reacts inversely to bullish CPI prints.
Based on past CPI releases (08/12/25, 07/15/25, 06/11/25, 02/12/24), expect a possible short-term dip before resuming the trend.
Best opportunities may come after NY open liquidity grabs.
⚠️ Risk Disclaimer
This is not financial advice – just my personal analysis. If we all knew exactly where the market was going, we’d all be millionaires. Trade cautiously and always prioritize risk management.
Happy Trading ❤️

QQQ Concentration RiskSince mid-2023, the gap has steadily widened - it doesn’t mean an immediate reversal, but it does mean QQQ is very top-heavy (the NDX/NDXE ratio tends to oscillate in bands; rather than, trend infinitely higher)
Strong NDX vs weak NDXE suggests a fragile rally
If mega-caps stumble, the whole index could pull back hard
However, if breadth improves (NDXE starts outperforming), that would strengthen the rally base
Current leadership concentration favors short-term bullish momentum (45%), but the rally is fragile, if mega-caps falter, the downside could open quickly (30%)
1. FAANG + NVDA/TSLA Leadership Persists
Ratio keeps rising (NDX > NDXE)
Leaders continue to attract flows (AI, cloud, semis).
QQQ pushes to new highs with narrower breadth
Rally vulnerable if just one or two leaders stumble (NVDA, AAPL, etc.)
+5–10% upside near term if momentum holds
2. Pause & Rotation (25%)
Ratio stalls near highs
Equal-weight (NDXE) starts to catch up
Breadth improves modestly, but QQQ as a whole chops sideways
QQQ consolidates in a 5%–7% band
3. Breadth Divergence Resolves Lower (30%)
Concentration risk unwinds
Leaders mean-revert (profit-taking, earnings disappointments)
NDX underperforms NDXE, ratio falls from highs
QQQ could correct −10% or more
The ratio at 2.88 is stretched relative to historical balance
A “reasonable” medium-term range would be closer to 2.3–2.5 (15% to 25% on percentage scale)
Implies QQQ pause/correction while NDXE holds steady or outperforms, or broadening participation (small/mid Nasdaq catching up)

NAS100 - Stock Market, Waiting for Inflation Index?!The index is above EMA200 and EMA50 on the one-hour timeframe and is in its long-term ascending channel. If the drawn upward trend line is maintained, we can expect Nasdaq to reach its previous ATH. In case of its valid breakdown, its downward path will be smoothed to the specified demand zone, where it can be bought with appropriate risk-reward.
U.S. equities closed lower on Friday after a volatile session, capping off a turbulent week in negative territory. Initially, weaker-than-expected employment data fueled optimism that the Federal Reserve would move toward further rate cuts. However, growing fears of an economic recession quickly overshadowed that optimism and pushed the indexes into the red.
Following the labor market report, expectations for a 25-basis-point rate cut at the Fed’s September meeting are now virtually certain. The main question, however, is how fast subsequent cuts might unfold. Some analysts have even floated the possibility of a surprise 50-basis-point cut on September 17. Fed Chair Jerome Powell, speaking at the Jackson Hole symposium, stressed that risks stemming from labor market weakness may now outweigh inflation risks—a factor that could justify a shift in the central bank’s policy approach.
Nick Timiraos, a prominent Wall Street Journal reporter closely tracking Fed policy, noted that the sharp slowdown in job growth over the summer has likely cemented the Fed’s decision to cut rates by 25 basis points in the upcoming meeting.
Still, he made no explicit mention of a 50-basis-point move. While markets have raised the probability of that scenario to 14%, Timiraos believes the main focus remains on a more moderate reduction. He also observed that the latest jobs report has deepened uncertainty over the pace and scope of cuts beyond September—a challenge that policymakers and markets will grapple with in the months ahead.
Barclays Bank now projects the Fed will lower rates three times in 2025—each time by 25 basis points in September, October, and December. This is an upward revision from its earlier forecast of just two cuts in September and December.
President Donald Trump once again lashed out at Fed policy in a post on his social media platform, writing: “Jerome Powell should have cut rates long ago. But as usual, he has acted too late.”
Meanwhile, mounting concerns over ballooning fiscal deficits—not only in the U.S. but also in countries like Japan, France, and the U.K.—have placed added pressure on long-dated bonds. The yield on the 30-year U.S. Treasury briefly climbed to a one-and-a-half-month high last week. At the same time, the Treasury Department plans to issue new three-year, ten-year, and thirty-year securities next week, an event that could further fuel volatility in the bond market.
The coming week will be light in terms of data volume, yet the few scheduled releases will carry significant weight as inflation once again takes center stage. On Wednesday, the Producer Price Index (PPI) for August will be published. Forecasts suggest both the headline and core readings will show sharp declines compared to July.
On Thursday, the European Central Bank (ECB) will hold its policy meeting, where markets currently expect the deposit rate to remain unchanged at 2.15%. Shortly afterward, traders will turn their attention to the U.S. Consumer Price Index (CPI) for August, along with weekly jobless claims data—closely monitored for signs of potential weakness in the U.S. labor market.
Finally, on Friday, the preliminary University of Michigan Consumer Sentiment Index will be released. This survey has been a particularly important gauge of inflation expectations this year, offering deeper insights into how U.S. households perceive price trends.
The PPI, which reflects changes in goods prices at the factory gate, often provides more forward-looking signals than the CPI. As shown in July’s data, any unexpected surge in August’s numbers could temper investors’ optimism about the pace of rate cuts. For now, the impact of tariffs on goods prices appears limited, while the Fed’s main concern remains the risk of renewed inflationary pressures in the services sector. According to the Cleveland Fed’s Nowcast model, headline inflation rose 0.1% in August to reach an annualized rate of 2.8%, while core inflation held steady at 3.1%.

ZGM | NASDAQ SNIPER ZONES FOR LONGTERM BASED ON SNR Nasdaq Trade !
NASDAQ H4 BREAKOUT THE SELL TRENDLINE FIRST , AND BOX OF RBS CALLED (RESISTANCE BECOME SUPPORT) HAVE A X SETUP
X SETUP EXPLAINED !
The Sell TL Broke And Nasdaq Have A Buy TL Thats Means Its The XSetup
X SETUP + QM SETUP + SUPPORT
FOLLOW US FOR MORE KNOWLEDGE AND TRADE IDEAS

Nas100 Trade Update Sep 4 2025FX:NAS100
www.tradingview.com
Price came into bearish 1h FVG then formed 2m IFVG and hit tp3 60 pips at asia lows. Then hit bullish 1h FVG and formed 2m IFVG to hit tp3 60 pips at BSL

Nas100 Trade Set Up Sep 1 2025FX:NAS100
www.tradingview.com
Price has made LH/LL and has respected a 1h FVG so id like to see price continue lower to take out SSL

NAS100 H4 | Bearish Reversal off Pullback Resistance"NAS100 is rising towards the sell entry at 23,679.28, which is a pullback resistance and could reverse from this level ot the take profit.
Stop loss is at 23,939.64, which is a swing high resistance.
Take profit is at 23,292.38, which is a pullback support that alignss with the 50% Fibonacci retracement.
High Risk Investment Warning
Trading Forex/CFDs on margin carries a high level of risk and may not be suitable for all investors. Leverage can work against you.
Stratos Markets Limited (tradu.com ):
CFDs are complex instruments and come with a high risk of losing money rapidly due to leverage. 65% of retail investor accounts lose money when trading CFDs with this provider. You should consider whether you understand how CFDs work and whether you can afford to take the high risk of losing your money.
Stratos Europe Ltd (tradu.com ):
CFDs are complex instruments and come with a high risk of losing money rapidly due to leverage. 66% of retail investor accounts lose money when trading CFDs with this provider. You should consider whether you understand how CFDs work and whether you can afford to take the high risk of losing your money.
Stratos Global LLC (tradu.com ):
Losses can exceed deposits.
Please be advised that the information presented on TradingView is provided to Tradu (‘Company’, ‘we’) by a third-party provider (‘TFA Global Pte Ltd’). Please be reminded that you are solely responsible for the trading decisions on your account. There is a very high degree of risk involved in trading. Any information and/or content is intended entirely for research, educational and informational purposes only and does not constitute investment or consultation advice or investment strategy. The information is not tailored to the investment needs of any specific person and therefore does not involve a consideration of any of the investment objectives, financial situation or needs of any viewer that may receive it. Kindly also note that past performance is not a reliable indicator of future results. Actual results may differ materially from those anticipated in forward-looking or past performance statements. We assume no liability as to the accuracy or completeness of any of the information and/or content provided herein and the Company cannot be held responsible for any omission, mistake nor for any loss or damage including without limitation to any loss of profit which may arise from reliance on any information supplied by TFA Global Pte Ltd.
The speaker(s) is neither an employee, agent nor representative of Tradu and is therefore acting independently. The opinions given are their own, constitute general market commentary, and do not constitute the opinion or advice of Tradu or any form of personal or investment advice. Tradu neither endorses nor guarantees offerings of third-party speakers, nor is Tradu responsible for the content, veracity or opinions of third-party speakers, presenters or participants.

A Crucial Test Lies Ahead for the Nasdaq 100The Nasdaq 100 faces a major test over the remainder of this week, with Nvidia reporting results after the close on 27 August and the US PCE report due on the morning of 29 August. The index has struggled to regain its losses after peaking on 13 August, facing stiff resistance just below the 61.8% retracement level at 23,670. In addition, the 10- and 20-day moving averages have proved to be sticking points, with the index unable to break away from either.
Momentum, as measured by the relative strength index, has also turned lower, forming a series of lower highs. Furthermore, a bearish divergence has emerged, with the RSI making lower highs while the Nasdaq 100 registered higher highs from the end of July through to mid-August.
Looking more closely, we see that the Nasdaq 100 had a straight-line rally on 22 August, and such rallies can sometimes be treated in a similar fashion to gaps. As a result, it is entirely possible that the index could give back its recent gains and fall back to 23,210, especially if it continues to struggle to surpass resistance at 23,620.
A breakout above 23,620 would be a bullish development despite a number of bearish signals. It would suggest the potential for the index to rise to 23,800 and possibly back to the previous highs.
Written by Michael J. Kramer, founder of Mott Capital Management.
Disclaimer: CMC Markets is an execution-only service provider. The material (whether or not it states any opinions) is for general information purposes only and does not take into account your personal circumstances or objectives. Nothing in this material is (or should be considered to be) financial, investment or other advice on which reliance should be placed.
No opinion given in the material constitutes a recommendation by CMC Markets or the author that any particular investment, security, transaction, or investment strategy is suitable for any specific person. The material has not been prepared in accordance with legal requirements designed to promote the independence of investment research. Although we are not specifically prevented from dealing before providing this material, we do not seek to take advantage of the material prior to its dissemination.

US100: Ready to rise further after good US dataUS100: Ready to rise further after good US data
Today the US reported very good data in general. Despite being preliminary data, they are still showing signs of a strong economy.
Tomorrow the US will report the final data and they have a good chance of being higher than expected.
Given that the US continues to have strong data despite the mess that Trump is creating, there is a good chance that the indices will continue to rise further. They are a clear indicator of the US economy. We must be careful of any manipulation that may occur or from Trump's comments.
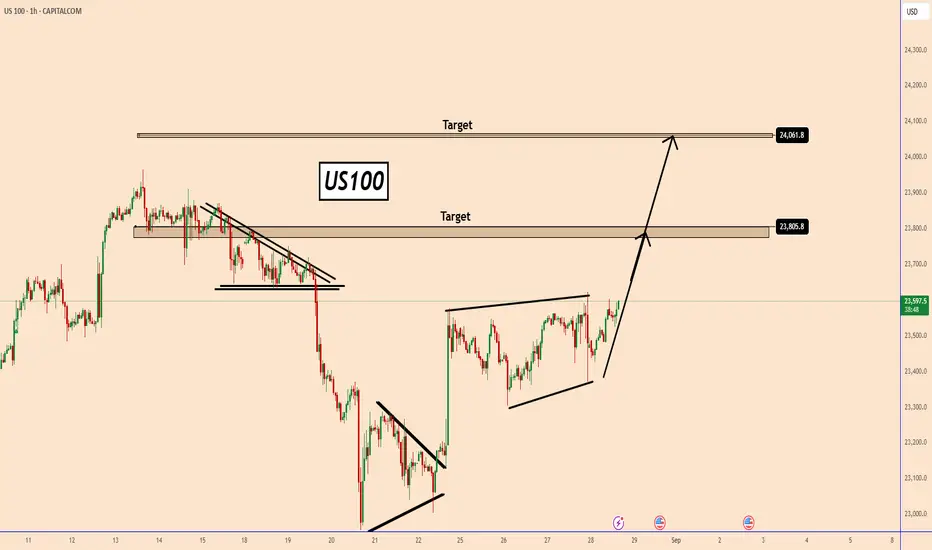
US100 completed a clear bullish pattern and it could reach 23800 and 24100 soon
You may find more details in the chart!
Thank you and Good Luck!
PS: Please support with a like or comment if you find this analysis useful for your trading day
US initial jobless claims 229K vs 230K expected
US GDP 2nd estimate for Q2 3.3% vs 3.1% estimate
US PCE prices preliminary 2.0% vs 2.1% preliminary
PCE ex food and energy housing 2.2% versus 2.2% preliminary
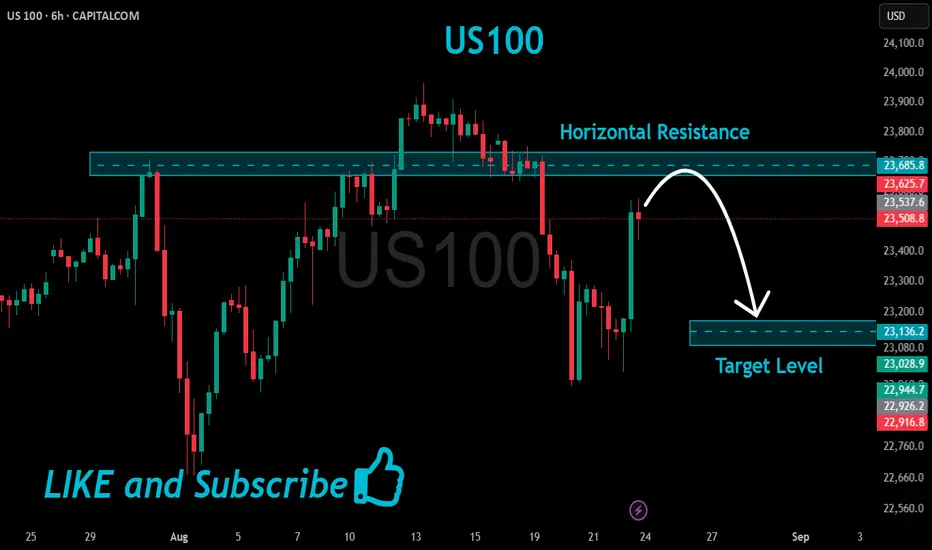
US100 Resistance Ahead!
HI,Traders !
#US100 is trading in an
Uptrend and Silver shot
Up sharply today and it
Is now locally overbought
So after the retest of the
Horizontal resistance above
At 23685.8 from where we
Will be expecting a local
Bearish move down!
Comment and subscribe to help us grow !
Bullish momentum to extend?US100 is falling towards the support level, which is an overlap support that aligns with the 23.6% Fibonacci retracement and could bounce from this level to pir tale prpft.
Entry: 23,546.52
Why we like it:
There is an overlap support level which aligns with the 23.6% Fibonacci retracement.
Stop loss: 23,300.44
Why we like it:
There is a pullback support that lines up with the 61.8% Fibonacci retracement.
Take profit: 23,938.06
Why we like it:
There is a swing high resistance.
Enjoying your TradingView experience? Review us!
Please be advised that the information presented on TradingView is provided to Vantage (‘Vantage Global Limited’, ‘we’) by a third-party provider (‘Everest Fortune Group’). Please be reminded that you are solely responsible for the trading decisions on your account. There is a very high degree of risk involved in trading. Any information and/or content is intended entirely for research, educational and informational purposes only and does not constitute investment or consultation advice or investment strategy. The information is not tailored to the investment needs of any specific person and therefore does not involve a consideration of any of the investment objectives, financial situation or needs of any viewer that may receive it. Kindly also note that past performance is not a reliable indicator of future results. Actual results may differ materially from those anticipated in forward-looking or past performance statements. We assume no liability as to the accuracy or completeness of any of the information and/or content provided herein and the Company cannot be held responsible for any omission, mistake nor for any loss or damage including without limitation to any loss of profit which may arise from reliance on any information supplied by Everest Fortune Group.

US 100 – All Eyes on the NVIDIA Earnings UpdateLast week was a challenging one for US 100 traders who had to negotiate a period of increased volatility caused by concerns of the development of an AI bubble leading to over extended valuations for key technology companies, and then a headline speech from Federal Reserve Chairman Powell at the Jackson Hole symposium where he hinted at the potential for rate cuts later in the year. This saw prices drop 3% from opening levels at 23745 on Monday August 18th down to lows of 22970 on August 20th, before rebounding strongly on Friday, back up to current levels around 23545 (0730 BST).
While the potential for Fed rate cuts may still be an important driver for the US 100 index, traders are waiting for key future economic data updates to provide more clarity on whether a 25bps (0.25%) cut is possible when the Fed meet next on September 17th. Before then traders will be waiting on the Friday August 29th PCE Index release, (Fed’s preferred inflation gauge), Friday September 5th Non-farm Payrolls release, especially given how Chairman Powell indicated a link between the health of the US labour market and potential rate cuts, and then the next US CPI update on Thursday September 11th.
This data waiting game means volatility for the US 100 index could be determined this week by details provided by NVIDIA in their Q2 earnings update which is due after the market close later today. NVIDIA is the world’s biggest company by market capitalisation (circa $4.4 trillion) and is considered the bellwether for AI demand and revenue performance. While traders may be focused on judging actual earnings performance against expectations, they could also be looking for reassurance regarding the strength of AI spending, as a more cautious outlook for future earnings could bring a negative reaction to AI stocks in the US 100.
Being prepared for an extended period of volatility in the US 100 index may be a wise move.
Technical Update: Still Positive Sentiment into NVIDIA Earnings?
Although the US 100 index entered a correction phase from the August 13th high of 23986 to the August 20th low of 22970, the overall positive trend that began at the April 7th low of 16290, appears to remain intact.
As the chart above shows, since the April 7th low, the US 100 index has traced out a pattern of higher highs and higher lows in price. This suggests positive sentiment, with buyers appearing at higher levels after each pullback. As long as this pattern of rising lows continues, the outlook could be viewed as skewing risks toward further attempts at upward movement in price.
While positive sentiment does currently appear to remain in place, NVIDIA’s upcoming earnings report has the potential to shift market sentiment. Therefore, it’s important to identify and monitor the next key support and resistance levels to be prepared in case an increase in volatility develops.
Potential Support Levels:
After finding support at 22970 on August 20th, traders are likely still watching this level. As long as prices continue to close above 22970, a more positive outlook could still be viewed as valid. However, a negative reaction to NVIDIA earnings if seen, may result in closes below this support level, even signal a sentiment shift toward the possibility of further price declines.
While a break below 22970 doesn’t guarantee further price weakness, it could open the door toward a test of 22678, the August 1st low, and potentially even 21375, which marks the June 23rd downside extreme.
Potential Resistance Levels:
Following the recent rebound from the August 20th low of 22970, the first key resistance is likely to be the all-time high of 23986 set on August 13th.
A close above this resistance level at 23986 could signal improving momentum and the potential for further attempts at price strength. If this break is sustained, traders may start to focus on levels at 24,421 and 24,665, corresponding to the 38.2% and 61.8% Fibonacci extension levels, respectively.
The material provided here has not been prepared accordance with legal requirements designed to promote the independence of investment research and as such is considered to be a marketing communication. Whilst it is not subject to any prohibition on dealing ahead of the dissemination of investment research, we will not seek to take any advantage before providing it to our clients.
Pepperstone doesn’t represent that the material provided here is accurate, current or complete, and therefore shouldn’t be relied upon as such. The information, whether from a third party or not, isn’t to be considered as a recommendation; or an offer to buy or sell; or the solicitation of an offer to buy or sell any security, financial product or instrument; or to participate in any particular trading strategy. It does not take into account readers’ financial situation or investment objectives. We advise any readers of this content to seek their own advice. Without the approval of Pepperstone, reproduction or redistribution of this information isn’t permitted.

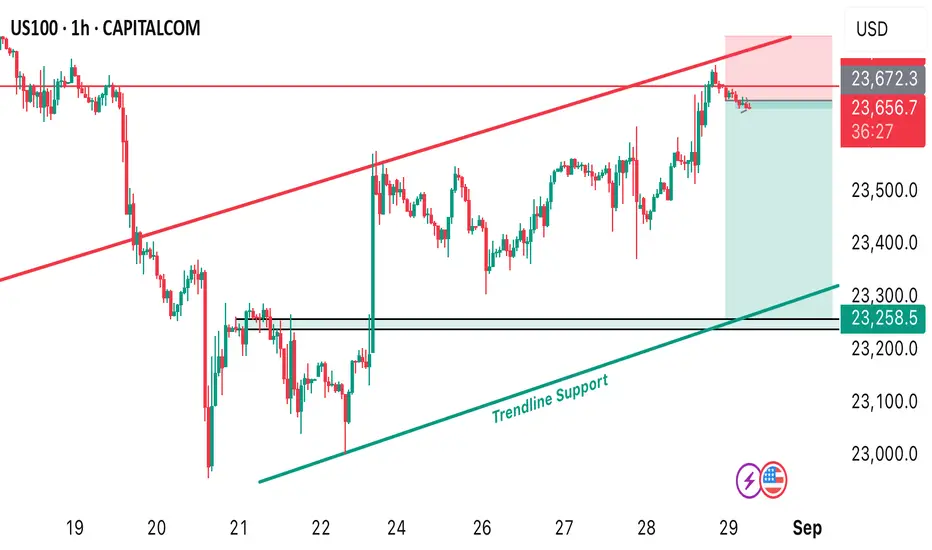
US100-POTENTIAL SELL IDEAThe long awaited sell opportunity that we envisaged on US100 is confirmed today and we’re ready to ride the sell from the current market price. Our first take profit level is at 23258.5 our stop loss is at 23699
SPY/QQQ Plan Your Trade Update For 8-26This new video should help you understand the dynamics playing out related to SPY/QQQ, BTCUSD and GOLD/SILVER.
Get some.
#trading #research #investing #tradingalgos #tradingsignals #cycles #fibonacci #elliotwave #modelingsystems #stocks #bitcoin #btcusd #cryptos #spy #gold #nq #investing #trading #spytrading #spymarket #tradingmarket #stockmarket #silver

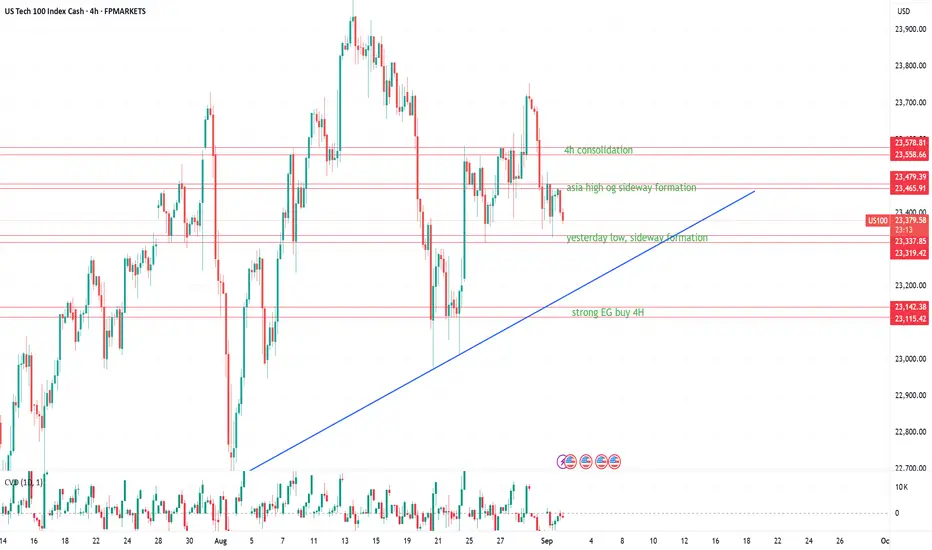
US100 – London Session Trade LevelsMarket Context
The Nasdaq-100 is currently trading within a consolidation pattern after being rejected around ~23,700. Momentum has slowed, and the market is searching for direction. During the London session, the focus is on intraday reactions around key levels. These zones may act as catalysts for either continuation or short-term reversals, depending on price action.
Sell Zones
23,465–23,480 (Asia high / sideways formation)
This zone represents the top of the Asian range and extends from a sideways structure.
A retest during London hours may trigger short-term selling momentum, especially if volume fades compared to Asian trading.
23,558–23,579 (4H consolidation)
A clear resistance area from the latest 4H consolidation, where several bullish attempts were previously absorbed.
If price fails to break this area with strong momentum, it is likely to act as a solid supply zone.
Buy Zones
23,320–23,338 (Yesterday’s low / sideways formation)
Represents yesterday’s low and a key intraday balance point.
If price dips into this area during London hours and shows absorption (e.g., long wicks / stronger CVD on the bid), it may serve as a springboard for a bounce.
23,115–23,140 (Strong 4H demand)
The strongest buy zone on the chart, aligning with both a structural support level and a prior reaction zone on 4H.
A test of this zone may indicate a “capitulation move,” where stronger buyers could be waiting.
Market Update and Sentiment Analysis
Overall Assessment
The Nasdaq-100 (US100) currently finds itself in uncertain territory. The technology sector, historically the driving force behind the index’s performance, faced headwinds toward the end of August. Rotation into small-cap equities, rising uncertainty ahead of key macroeconomic data and the Federal Reserve’s rate decision, as well as weak technical signals, are all contributing to a mixed sentiment picture.
Market Developments
End of August: The Nasdaq-100 closed the month down approximately –1.2%, bringing the index to around 23,415. Despite the pullback, year-to-date performance remains up by roughly 10–11%.
Sector Rotation: The small-cap segment (Russell 2000) gained 7.3% in August, significantly outperforming the Nasdaq-100. The shift away from technology reflects both concerns about AI profitability and expectations of future rate cuts, which traditionally favor smaller companies.
Earnings Pressure: Weak earnings from companies such as Dell, Nvidia, and Marvell Technology disappointed the market. Margin pressure within the tech sector has raised concerns about growth prospects.
Macroeconomic Context
Data Sensitivity: The market is displaying extreme sensitivity to employment and inflation data. Even minor deviations in key figures can trigger significant price movements.
Federal Reserve: Investor attention is focused on the Fed’s upcoming rate decision. Expectations of a rate cut later in the year serve as a supportive factor, though uncertainty remains elevated.
Historical Pattern: September has traditionally been the weakest month for the Nasdaq index. This increases the risk of additional volatility in the weeks ahead.
For the London session, the focus is on short intraday moves around well-defined supply and demand zones. Given the broader negative bias in the market, traders should be extra cautious with longs — confirmation and strong absorption signals are key before entering buys.
NAS100 - Trade Setup📊 NAS100USD – Multi-Timeframe Outlook
🔎 Monthly (1M)
Price moving inside a bullish wedge structure, with resistance tested near 25,200.
Support trendline holding firm, confirming strong macro bullish pressure.
Larger structure suggests Wave (5) still has room to expand toward 26,000+ if demand zones continue to hold.
🕰 Weekly (1W)
Elliott count clear: (1) → (2) → (3) extended, now correcting into (4).
Demand/FVG zones around 20,400 – 21,000 remain the critical swing support.
Next wave (5) projection aims at 25,000 – 26,000.
⏱ Daily (1D)
Structure consolidating within daily support, reacting from demand.
Breakout above 23,900 – 24,000 reactivates bullish impulse.
Invalidation lies below 22,950, where daily demand would fail.
⏳ 4H
Clear corrective retracement into daily demand (23,200 zone).
Long setup forming:
Entry: 23,222
Stop: 22,942
Target: 23,989
R:R ≈ 2.75
Short-term price action likely resolves higher into Wave (5) unless invalidation breaks.
🎯 Trade Plan
Bias: Bullish continuation into Wave (5)
Entry Zone: 23,200 – 23,300 (daily demand)
Targets: 23,989 (short-term), 25,200 – 26,000 (swing)
Invalidation: Daily close below 22,950

NASDAQ (US100) | Bullish Bias - Continuation in Play🔹 HTF (4H): Structure is bullish and respected. Momentum is strong to the upside, and higher lows remain intact — bullish intent confirmed.
🔹 MTF (30M): Refined structure shows price slashed through the recent internal OB but held — structure remains intact. A deeper sweep into an internal OB refined the order block further.
🔹 LTF (5M): Price switched character from bearish to bullish. Previous week we caught a bullish move, now looking for a second continuation setup toward highs this week.
🔹 Execution Plan: Waiting for price to mitigate the OB zone. Once tapped, we’ll attend bullish longs with precision.
🔹 Mindset Note: Patience is the edge — let smart money reveal itself before taking the next position.

NAS100 Bullish OutlookHi there,
The NAS100 on the H2 chart appears bullish, following the (B) sequence to HH (C), then potentially pulling back up to 24,431, with two price targets. Price is stretched and unstable. Volatility seems thin but bullish over the H4 and the daily timeframes.
There will need to be monitoring.
Happy Trading,
K.
