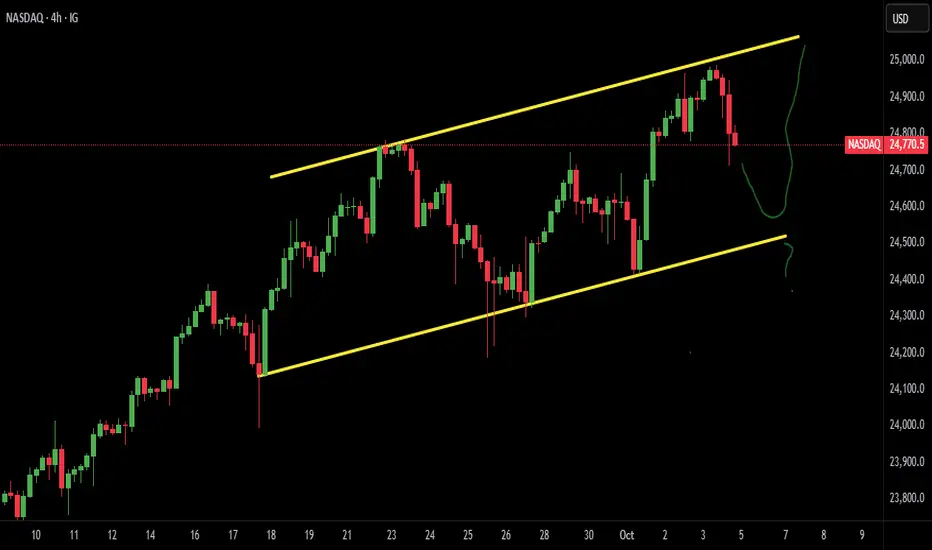
Nas100 money4/1 h range on the left. We had a push down to sweep buyers and a new leg to the upside that broke highs and created the range. Waited for price to retrace sub 702 fib to sweep liquidity, mitigate the last time sellers were in control (last down candle). Once we see that we can then expect that price can continue in its desired direction. 15 min tf gave us clear break to that direction taking profit at the creation of sellers (top of higher tf range). Clean cut same thing over and over. I hope someone can learn from the simplicity of this idea.
Trade ideas

Bearish Outlook on NQ📉 Bearish Outlook on NQ
After completing the manipulation phase, NQ has tapped perfectly into the Bearish FVG (1H) zone around 25,366.45 – 25,392.25, sweeping both SSLs in the process. This confirms premium-level distribution, suggesting the market is ready for a downside move.
Scenario 1 – Primary (Bearish Bias):
Price rejects from the Bearish FVG 1H, fails to reclaim 25,366.45, and begins its descent. Liquidity below the BSL at 25,293.65 becomes the first target, followed by a clean run toward 25,264.95, completing a liquidity sweep below recent lows.
Scenario 2 – Rejection & Re-Test:
A short-term push above 25,330.55 (NAS100FT) to re-test the Bearish FVG 1H could offer another entry opportunity before the drop resumes toward 25,293.65 and 25,264.95.
Scenario 3 – Deep Liquidity Grab Before Reversal:
Should price tap deeper into the Bullish FVG 4H, we could see a final liquidity sweep below 25,264.95 before a stronger bullish reaction emerges.
🎯 Overall Bias:
Bearish — targeting liquidity below 25,293.65 and 25,264.95. Manipulation phase complete, distribution underway.
Follow and like for more.
Greetings,
MrYounity

NASDAQ (US100) Analysis:✴️ Overall Trend: Bullish
The NASDAQ index showed strong performance yesterday, reaching 25,190, marking a new all-time high.
A price correction toward the Fibonacci golden zone at 25,000 is expected. If this level is broken, the price may move down to the liquidity zone near 24,820.
📌 Best Buy Zones: Watch for a rebound from 25,000 or 24,820
📍 Best Sell Zone: Upon breaking 25,100
⚠️ Disclaimer:
This analysis is not financial advice. It is recommended to monitor the markets and carefully analyze the data before making any investment decisions.

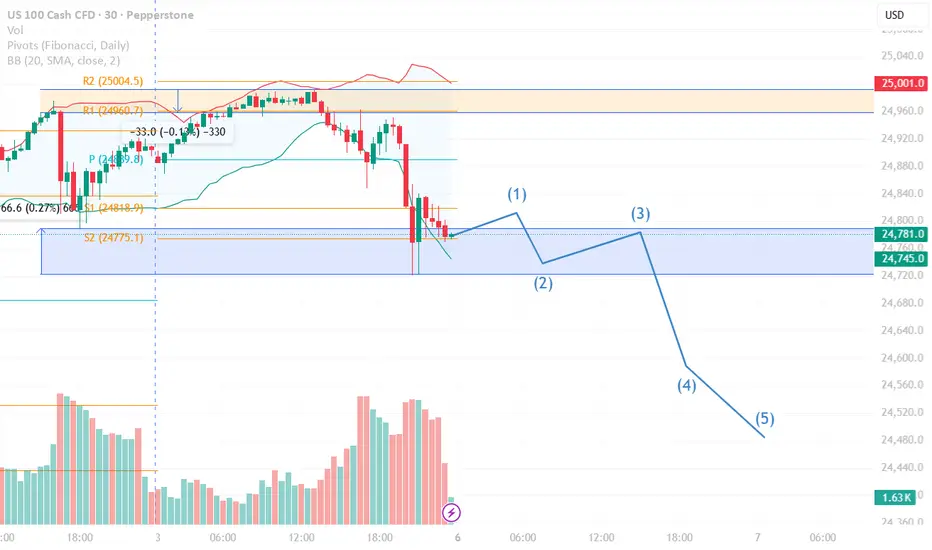
Nas100 sellsNasdaq is going to sell in the near term, because the price is making continuous lower lowers and it is going to take a very liquidity above and then continue the sell

NasdaqLit it that whole hour from the last post…..
Yum 🤤
Rolling stops, nothings going in the bin this time lol…
💵 💣
Lasssgooo!!!!

NAS shortsNasdaq attempts…
She looking for $25,012.
I’m allow $25,250 here, tag it all up….
Surely!!!
We take L here in leave her alone for a bit lmaooo
LFG light it up 🔥
Allow the next hour…

SILVER BULLET-CENTRAL STANDARD TIMESunday Open around 24,813 level..Market traded back into Sunday's open on 10/7/25 created a Silver bullet @ 1PM CST(2pm NYC)..began to trade to the upside 10/8/25..1:4-1:5 RR

NSDQ100 awaits FOMC minutes and Fed commentaryMarkets saw a cautious tone yesterday, with risk sentiment softening amid political uncertainty in France and ongoing concerns about a US government shutdown. The S&P 500 fell -0.38% from Monday’s record high, while Treasury yields eased, reflecting a mild flight to safety.
Safe-haven demand surged, with spot gold breaking above $4,000/oz for the first time ever, extending a rally of more than 50% this year. Silver is also nearing record highs. The moves highlight growing investor anxiety over the macro backdrop, despite resilience in equities overall.
In tech news, AI-related headlines continued to dominate sentiment. Elon Musk’s xAI is reportedly expanding its funding round to $20 billion, with backing from Nvidia, reinforcing market enthusiasm around the AI theme. Meanwhile, Anthropic announced plans to open its first office in India, underscoring the sector’s global expansion.
For today, Nasdaq 100 traders will watch how the AI rally balances against broader risk aversion, with the FOMC minutes and Fed commentary later in the session likely to drive direction.
Key Support and Resistance Levels
Resistance Level 1: 25090
Resistance Level 2: 25200
Resistance Level 3: 25300
Support Level 1: 24730
Support Level 2: 24590
Support Level 3: 24460
This communication is for informational purposes only and should not be viewed as any form of recommendation as to a particular course of action or as investment advice. It is not intended as an offer or solicitation for the purchase or sale of any financial instrument or as an official confirmation of any transaction. Opinions, estimates and assumptions expressed herein are made as of the date of this communication and are subject to change without notice. This communication has been prepared based upon information, including market prices, data and other information, believed to be reliable; however, Trade Nation does not warrant its completeness or accuracy. All market prices and market data contained in or attached to this communication are indicative and subject to change without notice.

Rising Inflation Expectations Put the Fed’s Credibility to the T
Rising Inflation Expectations Put the Fed in a Tight Corner
The latest release of the U.S. Consumer Inflation Expectations came in hotter than anticipated, rising to 3.4% in September, compared with 3.2% previously and a 3.1% consensus. This seemingly small uptick carries significant weight. It suggests that American households increasingly believe inflation will stay elevated, posing a new challenge for the Federal Reserve, just weeks after its controversial decision to cut rates.
For a central bank whose credibility hinges on anchoring inflation expectations, this is a warning sign. Rising expectations imply that monetary policy may already be too loose relative to price pressures, leaving the Fed with little room to maneuver between supporting growth and restraining inflation.
What It Means for the Fed
The Fed’s recent hawkish cut, a 25-basis-point reduction paired with strong rhetoric on price stability, was designed to balance two mandates: sustaining a slowing labor market and restoring confidence in inflation control. But this new data complicates that message.
A move from 3.2% to 3.4% may seem modest, but it represents an unanchoring risk. Once inflation expectations drift upward, they tend to reinforce real inflation through wage negotiations, spending decisions, and business pricing. Historically, the Fed has treated such shifts as policy alarms, often responding with tighter stances or more cautious forward guidance.
If expectations continue to rise, markets may start questioning whether the Fed’s current stance is adequate. Instead of debating “how soon” the next cut will come, investors may pivot toward “whether the Fed can cut at all” in the near term.
Implications for U.S. Markets
The reaction in financial markets could be twofold:
Read full analysis on my website
darrismanresearch com
Nasdaq Nears ATH as Volume DivergesFenzoFx—Nasdaq is up by 0.20% today. The majority of the gains were in the London session. As we approach the NY session, the price is getting closer to the $25,080.0 all-time high.
However, the cumulative volume profile signals caution. The indicator is making lower lows, while the price is in an uptrend. Therefore, we expect the price to dip in today's NY morning session.
In this scenario, we expect the price to close the opening gap, which rests at $25,000.0. The next support in focus is the October 2 and October 3 close price, $24,924.0. Please note that these levels can provide a discount price to plan long strategies.

ict rading foreign currencies can be a challenging and potentially profitable opportunity for investors. However, before deciding to participate in the Forex market, you should carefully consider your investment objectives, level of experience, and risk appetite. Most importantly, do not invest money you cannot afford to lose.
There is considerable exposure to risk in any foreign exchange transaction. Any transaction involving currencies involves risks including, but not limited to, the potential for changing political and/or economic conditions that may substantially affect the price or liquidity of a currency. Investments in foreign exchange speculation may also be susceptible to sharp rises and falls as the relevant market values fluctuate. The leveraged nature of Forex trading means that any market movement will have an equally proportional effect on your deposited funds. This may work against you as well as for you. Not only may investors get back less than they invested, but in the case of higher risk strategies, investors may lose the entirety of their investment. It is for this reason that when speculating in such markets it is advisable to use only risk capital.

ict in the mixrading foreign currencies can be a challenging and potentially profitable opportunity for investors. However, before deciding to participate in the Forex market, you should carefully consider your investment objectives, level of experience, and risk appetite. Most importantly, do not invest money you cannot afford to lose.
There is considerable exposure to risk in any foreign exchange transaction. Any transaction involving currencies involves risks including, but not limited to, the potential for changing political and/or economic conditions that may substantially affect the price or liquidity of a currency. Investments in foreign exchange speculation may also be susceptible to sharp rises and falls as the relevant market values fluctuate. The leveraged nature of Forex trading means that any market movement will have an equally proportional effect on your deposited funds. This may work against you as well as for you. Not only may investors get back less than they invested, but in the case of higher risk strategies, investors may lose the entirety of their investment. It is for this reason that when speculating in such markets it is advisable to use only risk capital.

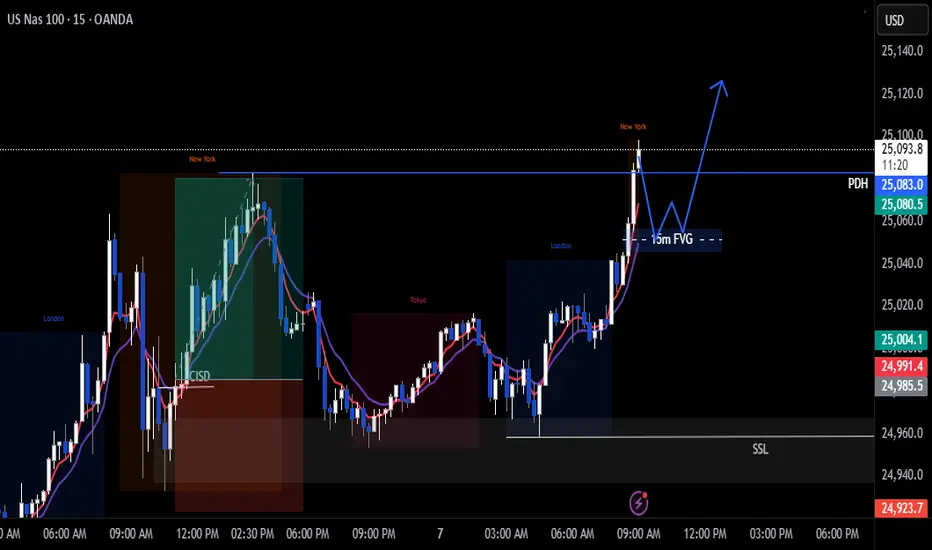
Nas100 Trade Set Up Oct 7 2025Price breaking PDH and making ATH so i am overall bullish. I want to see a pullback into 15m FVG before looking for more buys
www.tradingview.com
Wall Street pauses after record highs as investors await Fed sigWall Street pauses after record highs as investors await Fed signals
U.S. stocks were little changed Oct 7, easing after the S&P 500 and Nasdaq closed at record highs, as traders looked to upcoming Federal Reserve remarks for policy cues. Gains have slowed amid stretched valuations and uncertainty caused by the government shutdown, now in its seventh day.
Markets continue to price in a 25-basis-point Fed rate cut later this month, supported by signs of labor market softness, though the data blackout has limited visibility. Analysts say the absence of official reports leaves the Fed leaning dovish unless future labor data show improvement.
Investor focus is also shifting toward the upcoming earnings season, where forecasts and corporate commentary may play a larger role in shaping sentiment. Fed officials including Michelle Bowman, Raphael Bostic, Stephen Miran, and Neel Kashkari are set to speak this week.

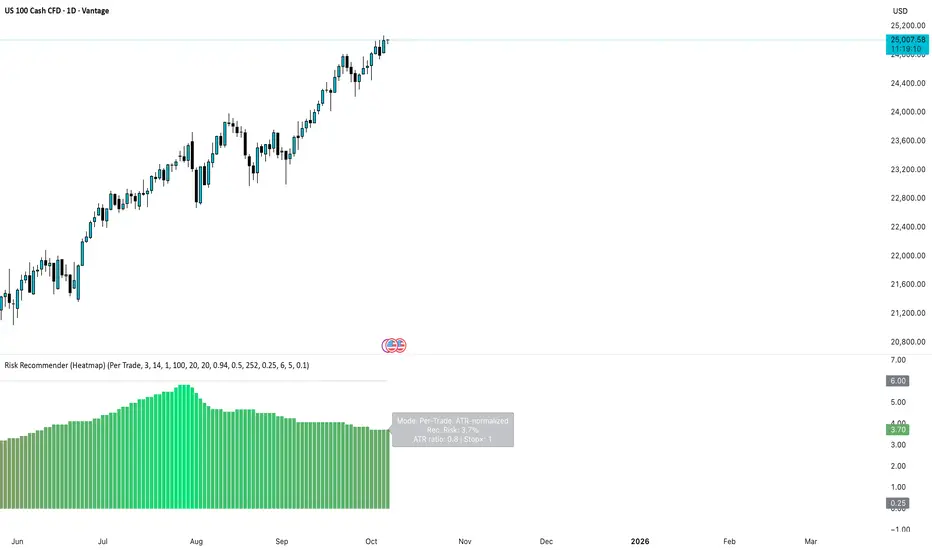
Stop Guessing Risk — Start Measuring It Like a QuantStop deciding risk based on emotion or setup. Do what quants do. Measure volatility and let it define your risk.
Most traders size positions emotionally:
• "This setup looks strong, I’ll double size."
• "I’m not sure, so I’ll go small."
→ Both are inconsistent and lead to unstable performance.
Professionals and systematic traders use a simple principle:
Risk is not a feeling, it’s a function of volatility.
⚙️ The concept
Markets breathe in volatility cycles. When volatility expands, risk should contract.
When volatility contracts, risk can expand.
Your position size should adapt automatically to those cycles.
This Idea demonstrates the logic behind the new 📊 Risk Recommender — (Heatmap) indicator, a tool that quantifies how much of your equity to risk at any time.
🧮 How it works
The indicator offers two complementary modes:
1️⃣ Per-Trade (ATR-based)
• Compares current volatility (ATR) to a long-term baseline.
• When market noise increases, it suggests smaller risk per trade.
• When conditions are quiet, it recommends scaling up—within your own floor and ceiling limits.
2️⃣ Annualized (Volatility Targeting)
• Computes realized and forecast volatility (EWMA-style).
• Adjusts your base risk so your overall exposure stays near a target annualized volatility (e.g., 20%).
• The same math used in institutional risk models and CTA frameworks.
🎨 Visual interpretation
The heatmap column acts as a “risk thermometer”:
• 🟥 Red = High volatility → scale down
• 🟩 Green = Low volatility → scale up
• Smoothed and bounded between your chosen floor and ceiling risk levels.
• The label shows current mode, recommended risk %, and volatility context.
💡 Why this matters
Risk should *never* depend on how confident you feel about a trade.
It should depend on how loud or quiet the market is.
Volatility is the market’s volume knob and this indicator helps you tune your exposure to the same frequency.
📈 Example use case
• NASDAQ volatility spikes → recommended risk drops from 3.0% → 1.2%
• SPX volatility compresses → risk rises gradually → 4.5%
You stay consistent while others overreact.
🚀 Automating it
My invite-only strategy applies this logic automatically to manage exposure in real time.
Combine it with the Risk Recommender indicator for full transparency and adaptive position sizing.
🎯 Summary
✅ Stop guessing risk size.
✅ Let volatility guide you.
✅ Keep risk constant, results consistent.
That’s how quants survive. That’s how traders evolve.
#RiskManagement #Volatility #ATR #PositionSizing #Quant #TradingStrategy #AlgorithmicTrading #SystematicTrading #Portfolio #EWMA #RiskControl
NASDAQ100 Uptrend StructureWe have a wel defined uptrend structure in place, bullish momentum is still strong and the price is confided to a clear up channel. My alert is set on the up trendline (diagonal support).
Will update as more price-data become available. See profile for link to my website.
Nasdaq updateNAS moving accordingly & really gotta come out of 962 here. Crucial….
She does we en route, manage it!!!!
London active. If we close through, should be good!!! 😊

Nasdaq updatedLooking to short it from these 2handles…
$25,012.23 holds the answers on closures.
She can do it from here…
Big ask, but also big potential if this can hold below in the next 3hr 30 mins!!!
Willing to allow $25,100 for closures. That should be at max and will also determine the next sequence of numbers to run off!!!
Full target on here is $24,714!
Then it be back to layering into longs from the previous post.
LFG Traders!! 🙌🏾

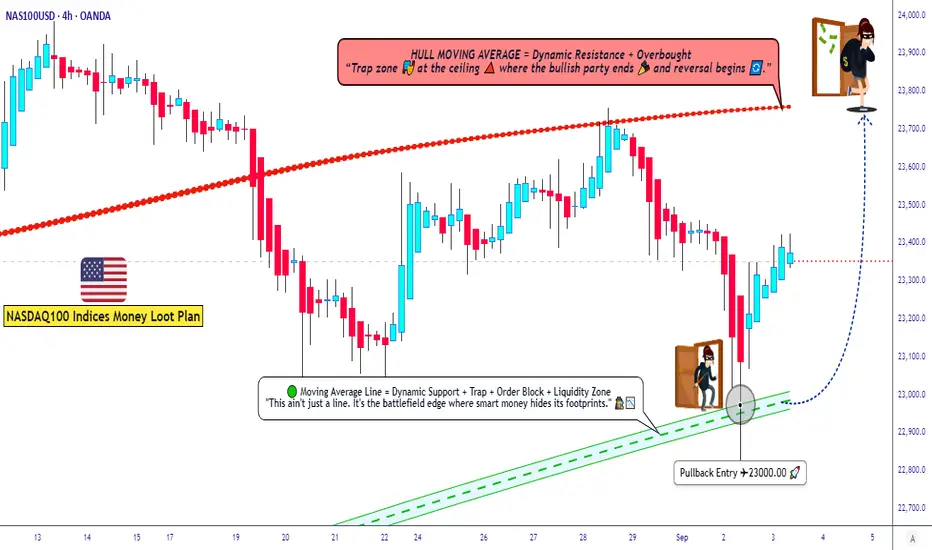
US100 Trading Plan ¦ Layering Strategy + Macro Sentiment Drivers🚀 NASDAQ100 / US100 Index – Thief Money Heist Plan 🎭
📌 Plan: Bullish Swing / Scalping Setup
Dear Ladies & Gentlemen (Thief OG’s), here’s the heist-style breakdown for US100 🔑:
🏴☠️ Entry Style (Thief Layering Strategy)
Using layered limit orders for flexibility & precision:
• 23200.0
• 23250.0
• 23300.0
• 23350.0
(You may increase limit layers based on your strategy & risk appetite)
📉 Moving Average Pullback Entry Plan
• Buy entries on pullbacks to the Fibo level 382 Triangular Moving average zone.
• Look for bullish candles confirming the bounce from these MAs.
• This offers better risk-to-reward by catching momentum on retracements instead of chasing highs.
❓ Why This Works?
• Moving averages often act as dynamic support/resistance in trending markets.
• Institutional traders & algos track them heavily, making them high-probability zones.
• Combining with layering entries = higher flexibility + reduced risk of mistimed single entry.
🛡️ Stop Loss (Protect the Vault)
• Thief SL: @23000.0
• Reminder: Adjust your SL based on your own strategy & risk tolerance.
🎯 Target (Escape Zone)
• Overbought + Trap Zone ahead!
• Escape target: @23750.0
• Note: Don’t rely only on my TP — secure profits at your own pace and risk.
📊 US100 Index CFD Real-Time Data Sep 03
📈 Daily Change: +133.47 (+0.57%)
📅 Monthly Performance: +0.76%
📆 Yearly Performance: +23.48%
😰😊 Fear & Greed Index
📊 Current Reading: 53/100 (Neutral)
🧐 Interpretation: Market sentiment is balanced, showing neither extreme fear nor greed. Investors are cautious but not panicked.
🧠 Retail vs. Institutional Sentiment
👥 Retail Traders: Moderately bullish (55% Long, 45% Short)
🏦 Institutional Traders: Slightly cautious (50% Long, 50% Short)
🔑 Key Drivers: Mixed signals from manufacturing data and upcoming labor market reports.
📉📈 Fundamental & Macro Score
📊 Macro Score: 6/10
Manufacturing PMI (48.7) still in contraction but improving.
Labor market data (JOLTS) awaited for clarity.
⚡ Volatility Score: 5/10 (Moderate)
VIX near average levels, indicating stable expectations.
💧 Liquidity Score: 7/10
Strong volume and breadth in large-cap tech stocks.
🐂🐻 Overall Market Outlook
✅ Bullish (Long): 60%
Supported by strong yearly gains and resilience in big tech.
⚠️ Bearish (Short): 40%
Concerns over manufacturing contraction and inflation pressures.
💡 Key Takeaways
📈 US100 is trending mildly positive today (+0.57%).
😐 Sentiment is neutral—no extreme fear or greed.
📊 Macro data hints at cautious optimism but watch for upcoming labor reports.
🐂 Overall bias leans slightly bullish for long-term holders.
📊 Related Pairs to Watch
FOREXCOM:SPX500
TVC:DJI
TVC:VIX
NASDAQ:NDX
FX:USDOLLAR
✨ “If you find value in my analysis, a 👍 and 🚀 boost is much appreciated — it helps me share more setups with the community!”
#NASDAQ100 #US100 #NDX #SPX500 #DJI #TradingView #SwingTrade #ScalpTrading #LayeringStrategy #MarketAnalysis
Nas100 Trade Set Up Oct 6 2025Price is bullish making HH/HL on the 1h and has swept PDH so i am overall bullish. I would want to see price trade into the 1h FVG, respect it and form internal 1m bullish structure to look for buys or trade higher above recent swing highs, sweep internal SSL and go higher
www.tradingview.com

NAS100 - Stock Market on Federal Holiday!The index is above the EMA200 and EMA50 on the four-hour time frame and is in its long-term ascending channel. If the upward momentum decreases, we can expect a correction to the demand zones and buy Nasdaq in that range with an appropriate reward for the risk.
Traders in prediction markets now estimate that the U.S. federal government shutdown could last more than a week and potentially extend into mid-October. These projections suggest that Washington’s political environment has reached a deadlock, making a swift agreement in Congress increasingly unlikely.
The shutdown began early Wednesday morning after Democrats and Republicans—along with President Donald Trump—failed to reach a compromise on a temporary funding bill. As a result, hundreds of thousands of federal employees have been placed on unpaid leave, and numerous government programs and public services have been suspended.
According to data from Bank of America, since 1990, U.S. government shutdowns have lasted an average of 14 days. Although the S&P 500 has typically risen about 1% during such periods, an extended impasse could weigh heavily on an already fragile economy and markets near record highs.
The credit rating agency Fitch stated that the current shutdown will not have a direct impact on the United States’ credit rating, which remains at AA+ with a stable outlook. However, the agency noted that repeated reliance on short-term funding resolutions reflects persistent weaknesses in U.S. fiscal governance. Still, Fitch expects the U.S. dollar’s status as the world’s reserve currency to remain intact in the near future.
Fitch also added that a short-lived shutdown is unlikely to affect most public-finance credits, though a prolonged one could pose negative risks for bond issuers—particularly those dependent on federal funding in areas such as healthcare, housing, and higher education.
Meanwhile, UBS argued that concerns over the U.S. government shutdown have been overstated, predicting that its economic impact will be limited and short-lived. The bank advised investors to look beyond political noise and instead focus on Federal Reserve rate cuts, corporate earnings, and opportunities in artificial intelligence.
Economists at Citi expect the Federal Reserve to implement two 25-basis-point rate cuts in October and December, in line with its Dot Plot projections. However, the shutdown could delay access to key labor and inflation data, forcing investors to rely more heavily on private sources such as ADP reports.
Similarly, Bank of America forecasts a rate cut in October but notes that markets have already priced in this outcome, assigning a 95% probability for October and 85% for December. In essence, this projection merely aligns with the consensus that has already formed among traders.
In actual market developments, expectations have shifted back toward easing policies. Over the past two weeks, the hawkish pressure that had supported the dollar has eased, and markets are once again pricing in a lower-rate trajectory. Currently, about 105 basis points of rate cuts are priced in for next year, compared with a previous low of 94 basis points—a shift that favors equities while weighing on the dollar.
According to Daniel Pavilonis, senior commodities broker at RJO Futures, the government shutdown will not significantly impair the Fed’s ability to assess labor market conditions. “The Fed relies more on its proprietary datasets than on official government statistics,” he explained. “Even amid a shutdown, policymakers maintain a fairly accurate picture of the economy.”
After a week dominated by employment data—some released and others delayed due to the shutdown—the upcoming week is expected to be relatively quiet for official U.S. economic releases unless a resolution is reached.Instead, market attention will pivot toward remarks from Federal Reserve officials.
On Wednesday, the minutes of the September FOMC meeting will be released, offering deeper insight into policymakers’ views on the rate path and inflation risks. Then, on Friday, the University of Michigan’s preliminary Consumer Sentiment Index for October will shed light on household perceptions of the economy and their financial conditions—a key gauge for domestic demand strength.
In addition, investors will closely monitor speeches from several Fed officials, including Bostic, Bowman, Miran, Kashkari, Barr, and Musalem. Their comments could directly influence market expectations for monetary policy and shape trading sentiment in the days ahead.
$NDX $SPX $BTC All Close at Weekly ATHPretty cool to see ₿itcoin, S&P 500 and Nasdaq all close the week at new ATH 🥳
And now we have $325B about to be dumped into the US economy in FY26Q1 along with more rate cuts on the way.
Next time you speak to a bear, reply with FU HIGHER 🚀