CFXUSDT — Symmetrical Triangle: Ready for a Rally or a Breakdown📝 Full Analysis & Narrative
CFX/USDT is currently forming a symmetrical triangle pattern on the daily timeframe after experiencing a strong rally in July–August. This pattern is characterized by a series of lower highs (descending upper trendline) and higher lows (ascending lower trendline), gradua

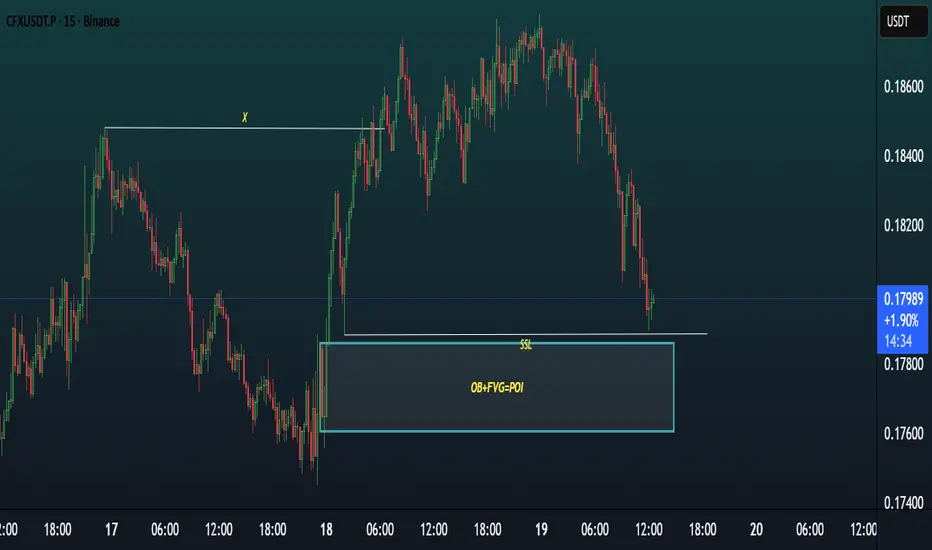
CFX/USDT Update (15m Chart)CFX/USDT Update (15m Chart)
Price is now approaching the OB + FVG confluence POI zone around 0.178 after taking out the SSL liquidity.
🔎 This is an important reaction area. If buyers step in here, we could see a potential reversal move forming.
⚡ Keep an eye on how price behaves once it taps the
CFX Market Update📊 LSE:CFX Market Update
LSE:CFX is testing the red resistance zone 🔴
If it breaks out with confirmation, the first target will be the blue line level 🎯

Conflux approaching fair value gapCFX broke down and is hovering above the fair value gap, where the lack of volume could allow the price to fall right through. A breakdown through the imbalance will allow us to buy oversold conditions at a discount.

CFX - BEARISH CONTINUATION ? LSE:CFX - update:
For some reason, bearish pressure was pretty strong.
The current bias is clearly bearish, but price is stuck inside this yellow box.
Following my previous outlook another break downard to visit the lower 0.1350 - 0.1300$ support is likely to be see next! 📉
Are you bull or bea

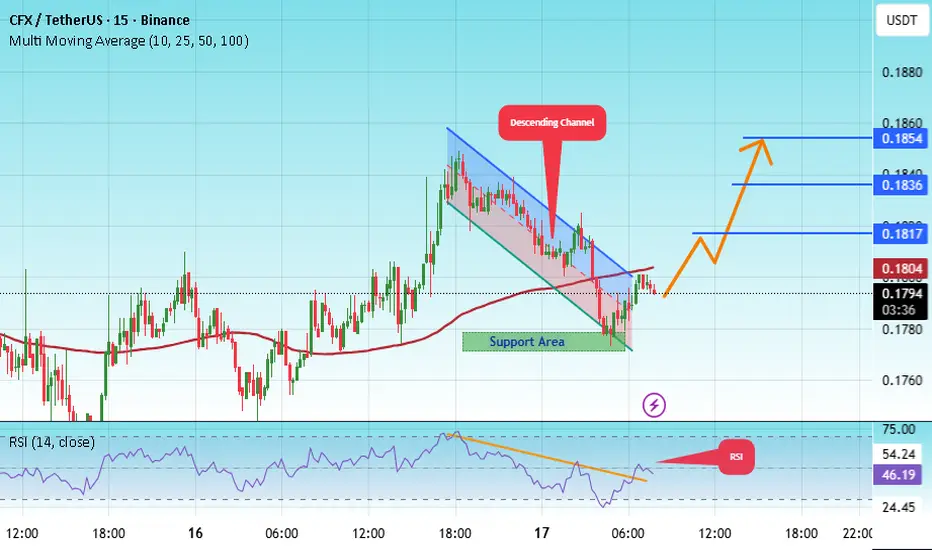
#CFX/USDT — Symmetrical Triangle: Ready for a Rally or a Breakd#CFX
The price is moving within a descending channel on the 1-hour frame, adhering well to it, and is heading for a strong breakout and retest.
We have a bearish trend on the RSI indicator that is about to be broken and retested, which supports the upward breakout.
There is a major support area i
$CFX: my green zones are back. Time to refill our bags.LSE:CFX delivered an impressive bounce during this mini-altseason, confirming it’s a project worth keeping on the radar for the upcoming full altseason.
However, its non-US listing status could limit its performance if BlackRock launches altcoin index ETFs — as it’s unlikely Conflux would be inclu

Conflux Smart Trade- All in Graphic
- i really doubt it will back to bottom but " who knows ?".
- Now : Nothing to buy yet.
- i do not play a breakout with CFX. Dangerous.
---------------------------------------------------------------
Trading Part
---------------------------------------------------------------
Buy

CFXUSDT TRADE IDEA.CFX/USDT Update (15m TF)
Market Structure: Price is currently bullish with a strong push upward after breaking structure (BOS).
Current Zone: Trading around 0.1759 after rejecting higher.
Point of Interest (POI): The highlighted demand zone near 0.1710 (OB + liquidity sweep).
Scenario:
Possible

CFXUSDT 1D#CFX has formed a bullish pennant on the daily chart. A retest of the daily SMA50 is possible before the next leg up. If it breaks out above the pennant resistance, the targets are:
🎯 $0.2140
🎯 $0.2444
🎯 $0.2689
🎯 $0.2935
🎯 $0.3285
⚠️ As always, use a tight stop-loss and proper risk management.

See all ideas
Summarizing what the indicators are suggesting.
Oscillators
Neutral
SellBuy
Strong sellStrong buy
Strong sellSellNeutralBuyStrong buy
Oscillators
Neutral
SellBuy
Strong sellStrong buy
Strong sellSellNeutralBuyStrong buy
Summary
Neutral
SellBuy
Strong sellStrong buy
Strong sellSellNeutralBuyStrong buy
Summary
Neutral
SellBuy
Strong sellStrong buy
Strong sellSellNeutralBuyStrong buy
Summary
Neutral
SellBuy
Strong sellStrong buy
Strong sellSellNeutralBuyStrong buy
Moving Averages
Neutral
SellBuy
Strong sellStrong buy
Strong sellSellNeutralBuyStrong buy
Moving Averages
Neutral
SellBuy
Strong sellStrong buy
Strong sellSellNeutralBuyStrong buy
Displays a symbol's price movements over previous years to identify recurring trends.