AUDCHF CLOSING THE GAP|SHORT|
✅AUDCHF After engineering liquidity below the previous low, price is now retracing into the imbalance created during the impulsive move up. The market is likely to close the fair value gap and resume bearish order flow. Time Frame 4H.
SHORT🔥
✅Like and subscribe to never miss a new idea!✅
Trade ideas

AUDCHF 1D IdeaPotential for a bullish pullback on the AUDCHF 1D which could lead to a price movement towards the resistance level at 0.54800. BUY levels from 0.1700

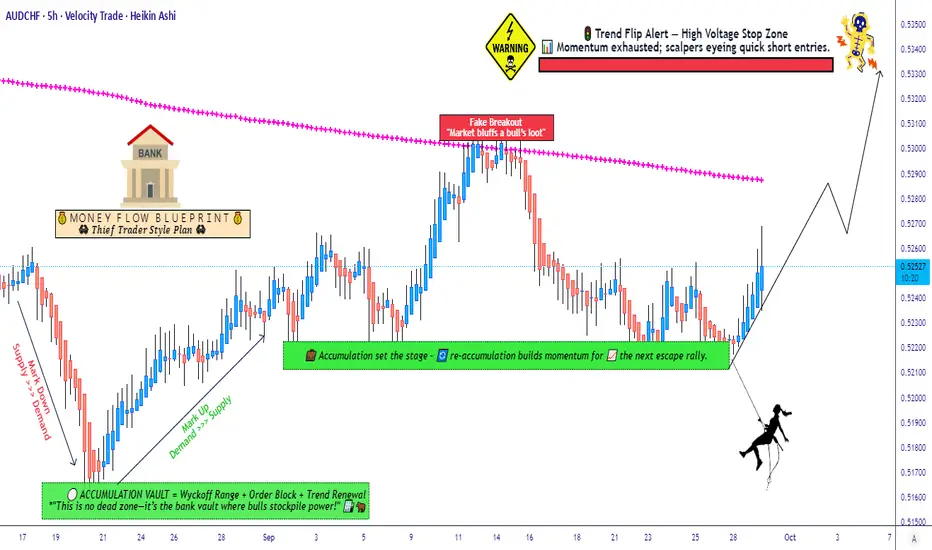
Is AUD/CHF Poised for a Bullish Breakout? Join the Surge!🚀 AUSSIE vs SWISS: AUD/CHF Wealth Heist Strategy (Swing/Day Trade) 🦘
🎯 Market: AUD/CHF (Forex)
💡 Strategy: Bullish Swing/Day Trade with Re-Accumulation Confirmation.
Buckle up, traders! It's time to pull off a slick market heist with the "Thief Strategy" on AUD/CHF. We're layering up entries like a mastermind stacking cash, aiming for a high-voltage profit zone while dodging traps. Let’s break it down with style and precision! 😎
📈 Trade Setup: The Thief’s Playbook
Bias: Bullish 🚀We’re spotting a re-accumulation pattern signaling the bulls are loading up for a breakout. AUD/CHF is primed for a move, and we’re ready to ride the wave!
Entry Strategy: Layered Buy Limit Orders (Thief Style) 🕵️♂️
Deploy multiple buy limit orders to stack the deck in your favor:
🎯 Buy Limit @ 0.52200
🎯 Buy Limit @ 0.52300
🎯 Buy Limit @ 0.52400
Pro Tip: Feel free to add more layers based on your risk appetite — scale up like a true market bandit!
Stop Loss: Thief’s Safety Net @ 0.52000 🛑
This is my suggested stop loss, but you’re the boss of your vault! Adjust based on your risk tolerance. Don’t let the market pickpocket your capital!
Take Profit: High-Voltage Resistance Zone @ 1.18700 ⚡A juicy resistance zone awaits, packed with overbought signals and a potential trap. Lock in profits here or adjust your exit to suit your style. Grab the loot and escape before the trap springs!
Note: This is a suggested target. You decide when to cash out — take profits at your own risk!
🔍 Why AUD/CHF? The Market Intel
Re-Accumulation Confirmation: The chart shows a textbook re-accumulation phase, with price consolidating before a bullish breakout. Volume and momentum are aligning for a push higher.
Market Dynamics: AUD (commodity-driven) vs. CHF (safe-haven) creates a tug-of-war. With risk-on sentiment rising, AUD could outmuscle CHF.
Trap Alert: Watch for a false breakout at the 1.18700 resistance zone. Overbought conditions may lure in early sellers — don’t get caught!
💵 Related Pairs to Watch
Keep an eye on these correlated pairs (priced in USD) to gauge market sentiment:
OANDA:AUDUSD : If the Aussie is pumping against the USD, it’s a good sign for AUD/CHF strength. Watch for bullish momentum here to confirm our bias.
OANDA:USDCHF : A weakening USD/CHF could amplify AUD/CHF’s upside as CHF loses ground. Check for bearish signals in USD/CHF to align with our trade.
OANDA:NZDCHF : Similar to AUD/CHF, NZD/CHF often moves in tandem due to AUD/NZD correlation. A bullish NZD/CHF could reinforce our setup.
Key Correlation Note: AUD and NZD often move together due to their commodity-driven economies. If AUD/USD and NZD/USD are rallying, it’s a green light for our AUD/CHF bullish bias. Conversely, a strong USD/CHF could cap our upside, so stay sharp!
🛠️ Thief Strategy Breakdown
Layering Entries: By stacking buy limit orders at 0.52200, 0.52300, and 0.52400, we’re averaging into the trade to catch the best entry zone. This minimizes risk if the market dips before blasting off.
Risk Management: The 0.52000 stop loss keeps our downside tight. Adjust your position size to keep risk below 1-2% of your account — don’t let the market rob you blind!
Profit Zone: The 1.18700 target is a high-probability resistance area. Use RSI or Stochastic indicators to confirm overbought conditions before exiting.
⚠️ Disclaimer
This is a Thief Style trading strategy crafted for fun and educational purposes. Trading involves risks, and you’re responsible for your own decisions. Always do your own research and manage your risk like a pro. No financial advice here — just a playful heist plan to spark your trading creativity!
✨ “If you find value in my analysis, a 👍 and 🚀 boost is much appreciated — it helps me share more setups with the community!”
#Hashtags: #AUDCHF #ForexTrading #SwingTrading #DayTrading #ThiefStrategy #Bullish #TechnicalAnalysis
AUDCHFAUDCHF price is in a correction phase. If the price can hold above 0.50914, it is expected that the price will rebound. Consider buying in the red zone.
*Trading is risky.
🔥Trading futures, forex, CFDs and stocks carries a risk of loss.
Please consider carefully whether such trading is suitable for you.
>>GooD Luck 😊
❤️ Like and subscribe to never miss a new idea!

AUD/CHF SENDS CLEAR BEARISH SIGNALS|SHORT
AUD/CHF SIGNAL
Trade Direction: short
Entry Level: 0.519
Target Level: 0.514
Stop Loss: 0.522
RISK PROFILE
Risk level: medium
Suggested risk: 1%
Timeframe: 6h
Disclosure: I am part of Trade Nation's Influencer program and receive a monthly fee for using their TradingView charts in my analysis.
✅LIKE AND COMMENT MY IDEAS✅

Lingrid | AUDCHF Key Zone Rejection Selling OpportunityFX:AUDCHF broke above consolidation structure after rebounding from the key support level around 0.514. The price has been oscillating inside a narrow range, capped by resistance near 0.521. A failure to break above this level could resume bearish momentum toward the 0.514–0.508 support zone since the major trend is bearish on the daily timeframe. The overall tone remains cautious as the pair stays confined within a corrective channel.
⚠️ Risks:
Strong Swiss franc buying due to risk-off sentiment could accelerate the decline.
A break above 0.521 resistance would invalidate the bearish setup.
Unexpected macro data from Australia may disrupt the current technical pattern.
If this idea resonates with you or you have your own opinion, traders, hit the comments. I’m excited to read your thoughts!

AUDCHF: Breaks Below ATLPrice is breaking below the ascending trendline (ATL), which is a signal that the counter-trend move is coming to an end.
The H1 timeframe also demonstrates confluence across price's crossover below the ATL and price's acceleration away from the EMAs.
This is further supported by the fact that price is holding below the horizontal trendline (HTL) on the daily timeframe. We can overall maintain a bearish bias for the time being.
Given that this trade signal is close to the 5 PM rollover, it may result in a closure and then re-entry to avoid a spread spike.

AUDCHF SHORT FROM SUPPLY ZONE|
✅AUDCHF is showing rejection from a major supply zone, suggesting that smart money is preparing for a bearish continuation toward the lower liquidity pool. The setup remains valid while below the supply range. Time Frame 3H.
SHORT🔥
✅Like and subscribe to never miss a new idea!✅

Bearish reversal off pullback resistance?AUD/CHF is reacting off the resistance level which is a pullback resistance that aligns with the 38.2% Fibonacci retracement and could drop from this level to our take profit.
Entry: 0.51680
Why we like it:
There is a pullback resistance level that aligns with the 38.2% Fibonacci retracement.
Stop loss: 0.52129
Why we like it:
There is an overlap resistance level that lines up with the 61.8% Fibonacci retracement.
Take profit: 0.50986
Why we like it:
There is a pullback support level.
Enjoying your TradingView experience? Review us!
Please be advised that the information presented on TradingView is provided to Vantage (‘Vantage Global Limited’, ‘we’) by a third-party provider (‘Everest Fortune Group’). Please be reminded that you are solely responsible for the trading decisions on your account. There is a very high degree of risk involved in trading. Any information and/or content is intended entirely for research, educational and informational purposes only and does not constitute investment or consultation advice or investment strategy. The information is not tailored to the investment needs of any specific person and therefore does not involve a consideration of any of the investment objectives, financial situation or needs of any viewer that may receive it. Kindly also note that past performance is not a reliable indicator of future results. Actual results may differ materially from those anticipated in forward-looking or past performance statements. We assume no liability as to the accuracy or completeness of any of the information and/or content provided herein and the Company cannot be held responsible for any omission, mistake nor for any loss or damage including without limitation to any loss of profit which may arise from reliance on any information supplied by Everest Fortune Group.

Sell AUDCHFAUDCHF good opportunity to sell with massive profit target. A bearish flag with multiple rejections on the resistance trend line. We should see strong bearish moves into Thursday and Friday.

AUDCHF – 15M Reversal WinPatience paid off. On the 15-minute chart, AUDCHF gave us exactly what we were waiting for:
✅ Strong resistance zone
✅ Engulfing candle confirmation
✅ Volume spike at 81
✅ Momentum already high and aligned with divergence
Once all the triggers lined up, the market dropped almost straight down — hitting profit quickly. 🚀
This is the power of waiting for alignment. No guessing, no chasing… just letting the VMS Strategy do its job.
⚠️ For educational purposes only. This is not financial advice.
#Forex #AUDCHF #VMSStrategy #AlignedExecution #TradingView

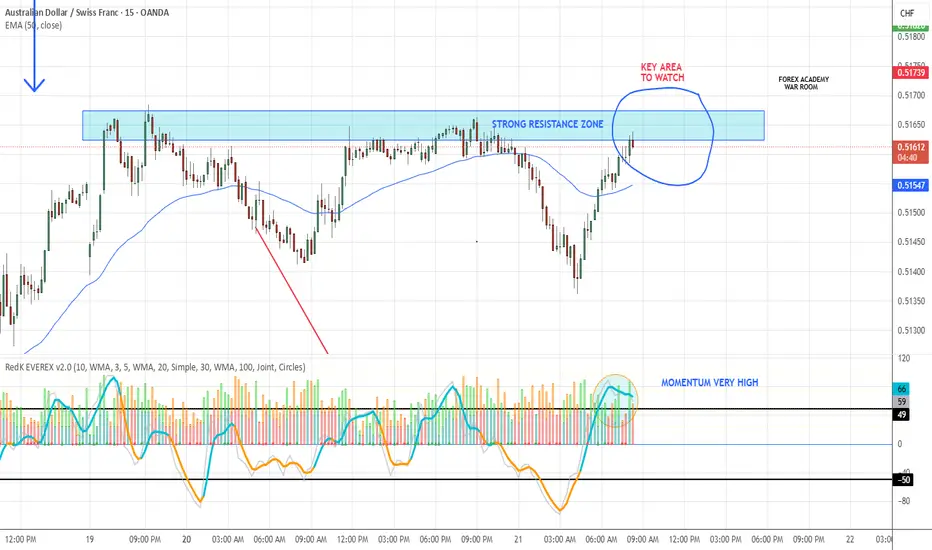
AUDCHF – Testing Strong Resistance (15M Chart)On the 15-minute timeframe, AUDCHF is pressing into a solid resistance zone. Momentum is already high, suggesting the potential for a down move.
But remember: the 15M chart can be much more volatile than higher timeframes. For a confirmed VMS setup, we still need:
✅ A clean engulfing candle to the downside
✅ Volume spike (75+) to show strong intent
Until those triggers align, this one stays on watch. Patience first — the signals will tell us when to act.
#Forex #AUDCHF #VMSStrategy #TradingView
two scenarios ahead according to price action pattern and trendline reaction we think of two scenarios will be unfolded ,depicting on the chart with red and blue color
lets see what would be the market reaction

AUD CHF - H1AUD CHF has been in a bearish trend making Lower Lows and Lower highs.
Price is currently pulling back up to the Fib golden zone of 0.5-0.618 levels. Price has also formed a hidden divergence potentially signalling a downward movement from here.
Confluences for the trade:
- Lower Lows, Lower highs being formed, showing a downtrend.
- Price Pulling back to the 0.5-0.618 Fib Levels.
- Price in a Descending Channel.
- Hidden divergence being formed indicating downward movement
- Price touching the 200 EMA which acts as dynamic support/resistance

BULLS SHOWING STRENGTH Hello traders! We are taking a look at this market for potential buy opportunities. This market made its all time low in April this year which was just below 0.50000 (around 0.49992 from Forex.com). Price dropped to 0.50777 to end the week nearly testing this low and quickly rallied back up to 0.51530. This move leaves us to safely assume the bulls are regaining control as we close above Thursday’s close (0.51427). If this bias is correct, this market could potentially breakout of this downtrend channel to revisit 0.52000 next week. We will continue to looking for other confirmations to support this idea.

Long Audchf Long audchf with entry level at 0.62 fib level. That fib level is 0.62 of a FVG which I expect it to act as support

AUDCHF: Bullish Continuation & Long Trade
AUDCHF
- Classic bullish formation
- Our team expects growth
SUGGESTED TRADE:
Swing Trade
Buy AUDCHF
Entry Level - 0.5184
Sl - 0.5177
Tp - 0.5200
Our Risk - 1%
Start protection of your profits from lower levels
Disclosure: I am part of Trade Nation's Influencer program and receive a monthly fee for using their TradingView charts in my analysis.
❤️ Please, support our work with like & comment! ❤️

AUDCHFFor a farmer or investor seeking year-round agricultural export income, a mix of perennial crops (tea, coffee, macadamia, avocado) and annual/hydroponic crops (herbs, vegetables, garlic) offers the most resilient business model. Each complements the other to cover seasonal gaps, ensuring steady revenue and reduced risk of market dependency.


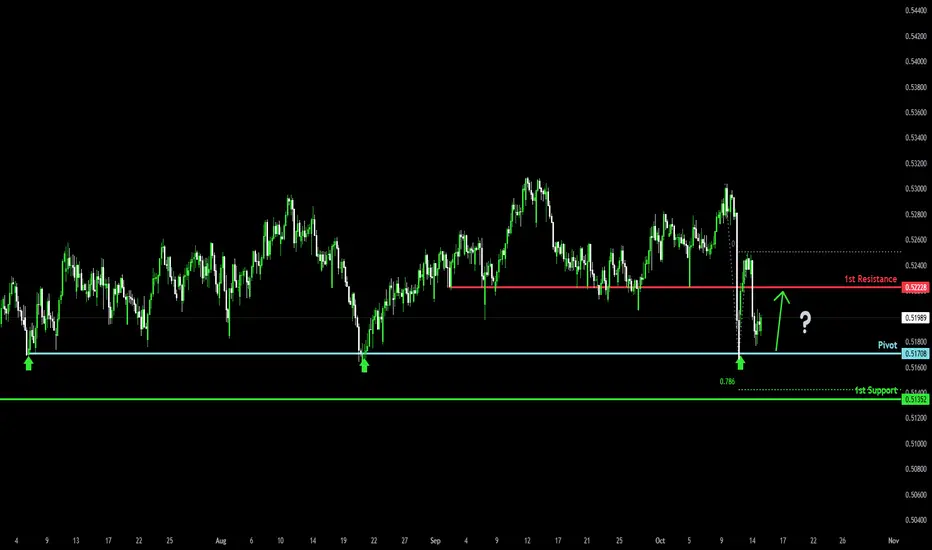
Bullish reversal off multi swing low support?AUD/CHF is falling towards the pivot, which is a multi swing low support, and could bounce to the 1st resistance, which is a pullback resistance.
Pivot: 0.51709
1st Support: 0.51352
1st Resistance: 0.52228
Disclaimer:
The above opinions given constitute general market commentary, and do not constitute the opinion or advice of IC Markets or any form of personal or investment advice.
Any opinions, news, research, analyses, prices, other information, or links to third-party sites contained on this website are provided on an "as-is" basis, are intended only to be informative, is not an advice nor a recommendation, nor research, or a record of our trading prices, or an offer of, or solicitation for a transaction in any financial instrument and thus should not be treated as such. The information provided does not involve any specific investment objectives, financial situation and needs of any specific person who may receive it. Please be aware, that past performance is not a reliable indicator of future performance and/or results. Past Performance or Forward-looking scenarios based upon the reasonable beliefs of the third-party provider are not a guarantee of future performance. Actual results may differ materially from those anticipated in forward-looking or past performance statements. IC Markets makes no representation or warranty and assumes no liability as to the accuracy or completeness of the information provided, nor any loss arising from any investment based on a recommendation, forecast or any information supplied by any third-party.
AUDCHF SELLWith AUD/CHF having broken below 0.5200 to approximately 0.5190, this confirms continuation of the bearish momentum indicated earlier.
Implications:
Breaking 0.5200 support reinforces downside potential toward the next major support at around 0.5160 and potentially further down closer to 0.5100.After breaking the 0.5100 then downward to 0.5000.
Selling pressure is likely to increase with this decisive break, favoring short positions on any rallies up to previous support turned resistance near 0.5200.
A key stop-loss area would be above 0.5250–0.5286 to manage risk if a short-term reversal arises.
Fundamental Picture
AUD Headwinds: Australian dollar remains weak due to soft commodity prices and risk-off sentiment globally. RBA is on hold, providing no fresh support.
CHF Strength: Swiss franc continues to benefit from safe-haven flows amid global uncertainty and stable economic data in Switzerland.
Risk-off flows: Favors CHF over AUD, especially in environments where traders seek safety.
Suggested Trade Approach:
Sell on pullbacks near 0.5200 with targets near 0.5160 and 0.5100 then lastly 0.5000.

AUD/CHF BULLS WILL DOMINATE THE MARKET|LONG
AUD/CHF SIGNAL
Trade Direction: long
Entry Level: 0.518
Target Level: 0.524
Stop Loss: 0.514
RISK PROFILE
Risk level: medium
Suggested risk: 1%
Timeframe: 4h
Disclosure: I am part of Trade Nation's Influencer program and receive a monthly fee for using their TradingView charts in my analysis.
✅LIKE AND COMMENT MY IDEAS✅

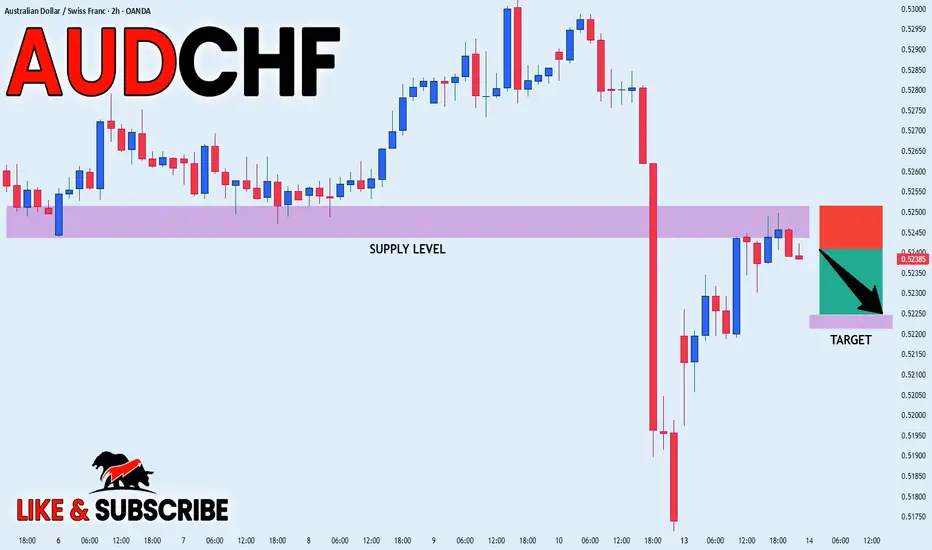
AUDCHF FREE SIGNAL|SHORT|
✅AUDCHF retraced perfectly from the supply zone, confirming bearish order flow alignment. Price is now likely to target the next liquidity pool around 0.5210 for continuation.
—————————
Entry: 0.5238
Stop Loss: 0.5249
Take Profit: 0.5210
Time Frame: 2H.
—————————
SHORT🔥
✅Like and subscribe to never miss a new idea!✅