CHFJPYTrend:
Price is moving in a clear bullish channel. Higher highs and higher lows confirm continuation to the upside.
Momentum:
Candles are pressing upward after a mid-channel pullback. Market shows healthy bullish momentum, but it is approaching a resistance zone.
RSI:
RSI is rising but not overbought, which supports continuation. No major bearish divergence visible, meaning momentum still favors bulls.
Multi-Timeframe Context:
1H → Strong Bullish
4H → Strong Bullish
Daily → Strong Bullish
All three timeframes align, which strengthens the conviction.
📌 Trade Plan Logic
Bias: Strong Bullish (fundamentals + technicals aligned).
Primary Idea:
Look to buy dips inside the bullish channel rather than chasing the top of resistance. Best setups are pullbacks into support zones where buyers re-enter.
Alternative Idea:
If price breaks and closes above resistance with momentum, that’s a valid continuation breakout entry for further upside.
Risk Management:
Stops should sit below the nearest swing low / support zone to avoid noise.
Profits can be taken in phases — partial exit near resistance, remainder left to ride trend continuation.
Invalidation:
If price closes below channel support or breaks key support zones, bullish bias is invalidated.
CHFJPY trade ideas

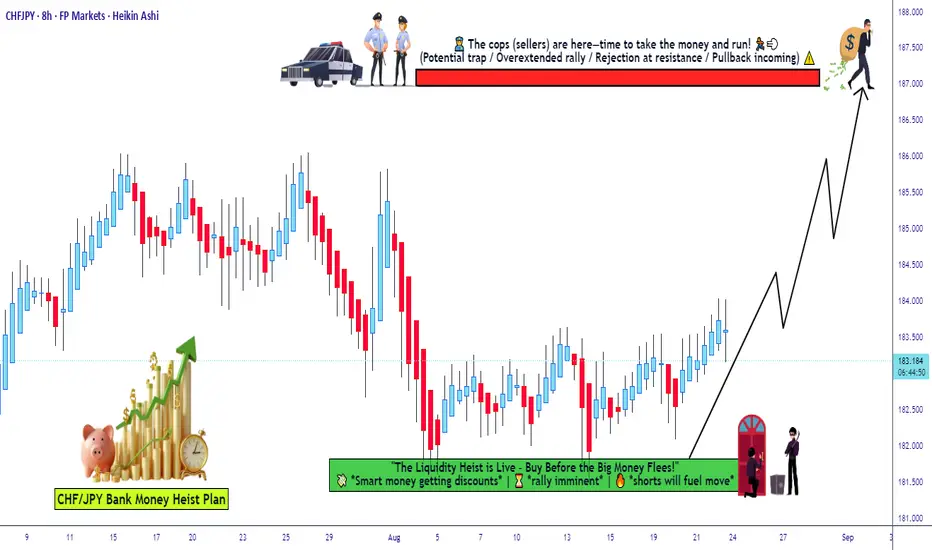
Thief Trader vs Police: CHF/JPY Market Heist Plan Uncovered🚨💰 CHF/JPY "Swiss vs Yen" Forex Market Robbery Plan 🎭🚨
🌍 Dear Money Bandits, Robbers & Thief OG’s 🕵️♂️💸
This is the master heist plan to crack the vault of the Swiss vs Yen market! 🏦💴
📈 Entry – The Looting Begins
"The vault is unlocked, robbers – time to load the bags!" 👜💰
We don’t wait for a perfect door – Thief goes in with layers (limit orders):
💎 Buy Layer 1: 183.800
💎 Buy Layer 2: 183.500
💎 Buy Layer 3: 183.000
💎 Buy Layer 4: 182.700
👉 Add more layers if you’ve got the courage, robbers.
🛑 Stop Loss – Escape Route
This is the Thief SL 🔒 placed at 182.000.
⚠️ Dear Ladies & Gentlemen of the crew, adjust your SL depending on your weapon (lot size), risk appetite & strategy. 🕶️
🎯 Target – The Great Escape
Police barricade spotted 👮🚨 … Escape route is clear until 187.500.
👉 Don’t be greedy, robbers – secure the loot before the cops close in.
🔥 Why this heist works?
Market shows bullish footprints 👣
Layering = stealth entry 🕵️
Smart robbers always plan exits 🎯
⚠️ News guards may ambush – stay alert 📡 and trail your loot with stop-locks.
💖 Support the Thief Crew 🚀
Hit that 💥BOOST💥 button & join the robbery squad – every click makes our gang stronger. Together, we steal from the market, not from each other 🏆🤝💵
Stay sharp, stay hidden – next heist loading soon… 🤑🎭
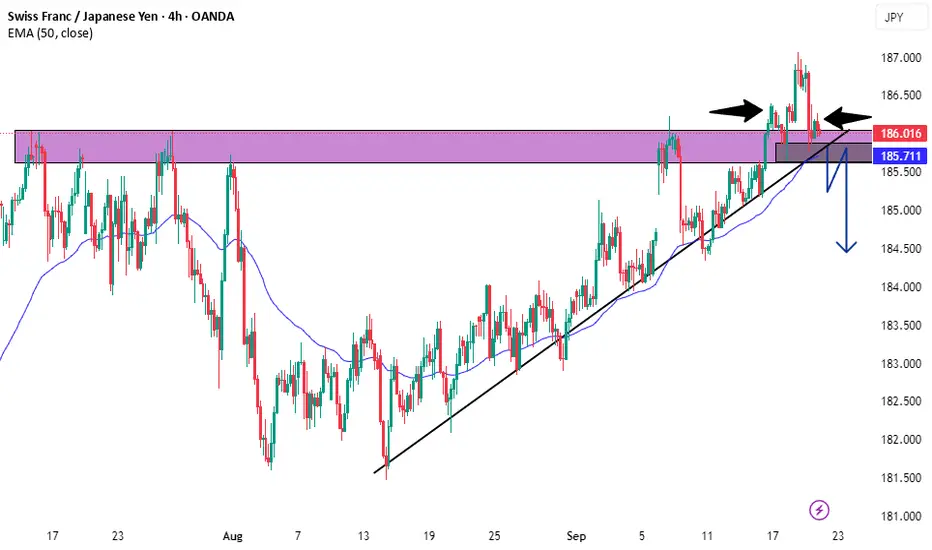
Best Bullish FX Trade of the Past 12 Months:CHFJPY Still BullishCHFJPY may be the best bullish trade of the past twelve months, delivering over a 10 percent return. This gain also came with low standard deviation and very limited risk.
Upward pressure remains in place, and fundamentals still support the technical bullish case. Another 10 percent run is very unlikely, but as long as the uptrend continues, the trend could still be followed with relatively low risk.
In the short term, there is a risk of potential forming of a head-and-shoulders formation. However, a clear break above 186.40, with some margin for error, would largely remove that risk. On the downside, support levels to watch are 186 and 185.60.

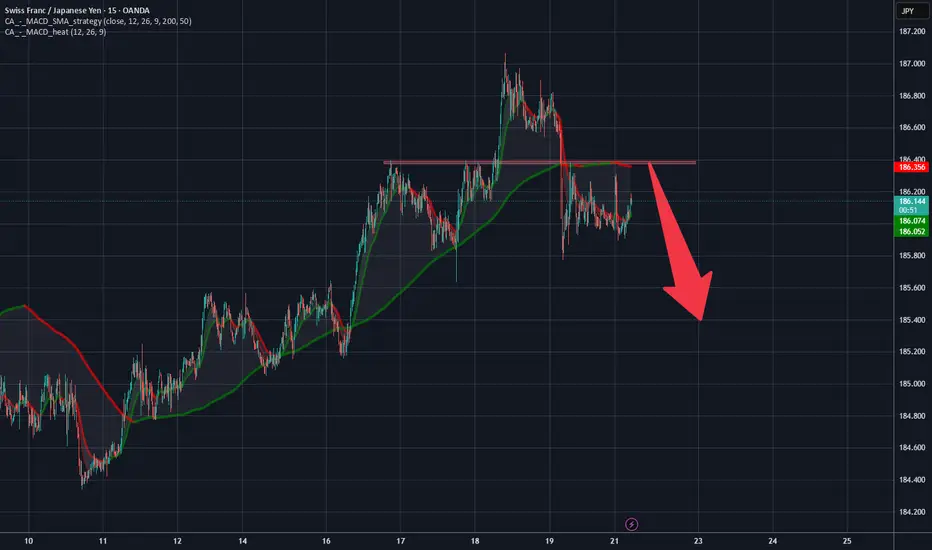
Chf/Jpy Downtrend on the min 15 Time Frame.Chfjpy is in a downtrend on the 15min time frame.
It keeps making swings up to its resistance area in the downtrend and falling again and going back up again... and so on.
The plan is to wait for a push up again near the red box sell area...
Then I will sell chf/jpy.
We must be patient here
CHFJPY False Breakout & Bearish Reversal Trade.- Price broke Key Resistance level at (186.049 - 185.625) and close above the level.
- Price later retested Key Resistance Level & formed Head & Shoulders pattern Neckline at (185.883 - 185.633).
- Rising Bullish Trendline Tested Multiple Times.
* Break of Trendline Entry since we are going against the dominant uptrend.
* Wait for Break & Retest of Head & Neckline at (185.883 - 185.633)) for Entry .
Without either of these 2 conditions the bearish trade setup is invalidated.
CHFJPY: To The New Highs 🇨🇭🇯🇵
CHFJPY has recently broken and closed above a major daily resistance.
As I predicted earlier, the price managed to reach 187.0 psychological level
after a retest of the underlined area.
Watching how strong is a bullish pressure today, I think that there will be a high
chance to see a further bullish continuation.
The next strong resistance is 188.0.
It will be the next goal for the buyers.
❤️Please, support my work with like, thank you!❤️
I am part of Trade Nation's Influencer program and receive a monthly fee for using their TradingView charts in my analysis.

CHFJPY BUY SCENARIOSwiss Franc is one the strongest player the last month. Japanese Yen until now it is the weakest of the day, the price now just rejected a weak supply zone from yesterday, it is possible to see the price rise at 187.064. If the price break the last high price can continue the bull run.

Will the Swiss Franc Outperform the Yen in This Bullish Move?💼 CHF/JPY — Swiss vs Yen Wealth Strategy Map (Swing/Day Trade) 💼
🗺️ Plan (Thief Trader Layering Strategy)
I’m mapping a bullish play on CHF/JPY using the Thief layering method (multiple buy-limit orders to scale into positions). Instead of rushing in, we stack layers like pros:
📌 Limit Buy Entries (Layered style):
186.000
186.500
187.000
(Feel free to add more layers depending on your style!)
🛑 Stop Loss (Thief SL): @185.500
(Note: Dear Ladies & Gentlemen — I’m not recommending only my SL. Always set risk according to your own rules. Make money ➝ take money at your own risk.)
🎯 Target Zones:
First Target: @189.000 (smart escape point)
Extended Target: @189.500 🚨 (beware of Police Barricade = strong resistance + overbought trap zone)
⚡ Key Notes for Thief OG’s
The layering system = multiple buy/sell limit orders → adds flexibility + reduces FOMO.
Strong resistance sits around 189.000 – 189.500, so treat that level like a trap zone where liquidity hunts begin.
Scaling out profits before the barricade = smart Thief escape plan.
🔗 Correlation & Pairs to Watch
Keep an eye on correlated FX majors and safe-haven flows:
💴 FX:USDJPY – Yen sentiment check
💶 OANDA:EURCHF – Swiss strength mirror
💵 OANDA:USDCHF – Safe-haven correlation
Gold ( OANDA:XAUUSD ) – Yen + CHF often follow risk sentiment with Gold
(Watching these pairs helps validate CHF/JPY swings as risk-on/risk-off flows shift.)
✨ “If you find value in my analysis, a 👍 and 🚀 boost is much appreciated — it helps me share more setups with the community!”
📜 Disclaimer: This is a Thief Style Trading Strategy created for fun and educational purposes only. Not financial advice.
#CHFJPY #Forex #SwingTrading #DayTrading #ForexStrategy #LayeringStrategy #TechnicalAnalysis #ThiefTrader

CHFJPY – Wave Analysis OutlookCHFJPY has been unfolding within a complex corrective structure labeled as W–X–Y. The recent advance looks extended, and based on the current structure, I’ll be watching closely for a potential bounce from the green box zone (support area).
This green box represents a key confluence of support, aligning with both the trendline and Fibonacci extension levels.
If price holds and consolidates here, a bullish reaction could develop, giving continuation toward the upside.
The 1st target sits near 187.30–187.50 (–0.236 Fib), while the 2nd target is around 189.10 (–0.618 Fib extension).
A failure to hold the green box, however, could invalidate the bullish scenario and open deeper pullback targets at 185.26 / 184.57 / 183.44.
👉 My primary expectation is for buy setups if the pair shows strength from this zone, targeting higher extensions.
⚠️ Disclaimer: This outlook is my personal wave analysis and shared for educational purposes only. It is not financial advice. Trading involves risk — always do your own research and manage risk carefully.

CHFJPY Bearish Pattern LoadingThe pair has recently rallied into the 186.60 resistance zone, which has acted as a strong ceiling in the past. Price is now struggling to break higher, showing rejection candles near this level. Sellers have stepped in around the same area multiple times before, confirming it as a key supply zone.
On the downside, the nearest support lies around 185.15, followed by deeper levels near 184.40 and 183.60. These zones represent potential targets if bearish momentum continues. The broader market structure shows CHFJPY losing steam after a strong push up, suggesting a likely corrective leg lower.
Momentum indicators (from the chart’s rejection) are also hinting that buyers are fading, giving more weight to your bearish view.
Here’s a clean trade setup based on the chart 📉:
• Entry: 186.10 – 186.20 (near resistance rejection zone)
• Stop-Loss: 186.62 (above resistance)
• Take Profit 1: 185.15 (nearest support)
• Take Profit 2: 184.40 (extended target)
• Risk/Reward: ~1:2.2
🔑 Risk Handling Strategy
• Book partial profits at 185.15 to secure gains, then let the rest ride toward 184.40.
• Use a trailing stop once TP1 is hit—move SL to breakeven or slightly in profit to lock in risk-free trade.
• If bullish pressure unexpectedly resumes and price breaks above 186.60, exit the trade early, as it would invalidate the bearish bias.
________________________________________
📌 Summary: CHFJPY is showing rejection from a major resistance zone at 186.60. The technicals support a bearish correction toward 185.15 first, and potentially 184.40 if selling pressure accelerates. Risk is well-defined, and profit-taking with trailing stops ensures protection while allowing room for extended downside.
________________________________________
CHF_JPY WILL KEEP GROWING|LONG|
✅CHFJPY Price reacts from demand area, confirming ICT displacement. Liquidity grab hints at bullish continuation, with Smart Money aiming for imbalance near 187.50. Time Frame 2H.
LONG🚀
✅Like and subscribe to never miss a new idea!✅

CHF-JPY Will Keep Growing! Buy!
Hello,Traders!
CHF-JPY is trading in an
Uptrend and the pair made
A retest of the horizontal
Support level of 186.000
And a is already making
A bullish rebound so we
Are bullish biased and
We will be expecting a
Further bullish move up
Buy!
Comment and subscribe to help us grow!
Check out other forecasts below too!
Disclosure: I am part of Trade Nation's Influencer program and receive a monthly fee for using their TradingView charts in my analysis.

CHFJPY 1D TF On the CHFJPY 1D timeframe, price has to retrace to the premium demand zone around 185.000, which aligns with the bullish trendline. This confluence makes the level a valid area to anticipate the next upward momentum.

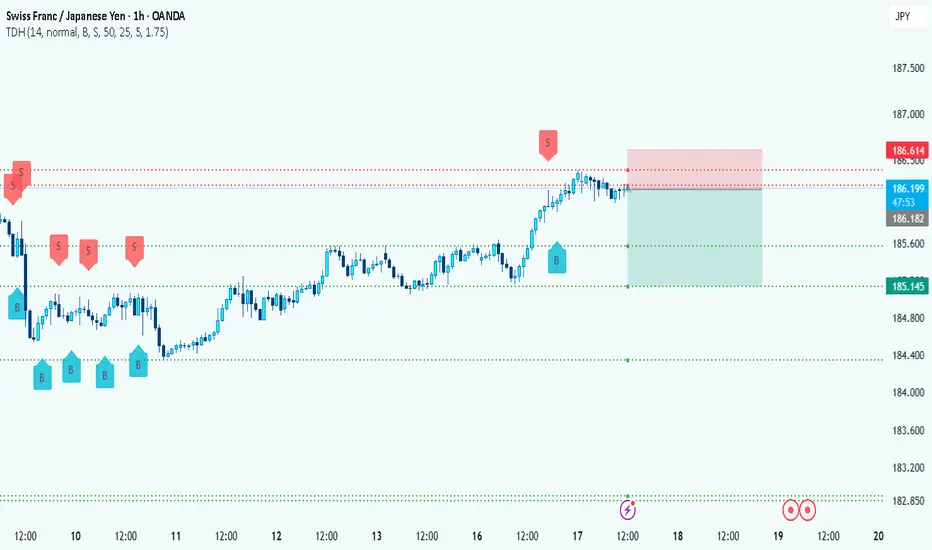
Bulls Trap Bears at 186 - Hidden Divergence Spring LoadsTitle: 🎯 CHF/JPY: Bulls Trap Bears at 186 - Hidden Divergence Spring Loads
The Market Participant Battle:
Bears who sold the rally to 187 (Point 3) have been systematically beaten by a stronger cohort of buyers who defended 185.61 (Point 2) and proved their strength by pushing price back above 186.52 (Point 1). This creates a proven market participant zone at Point 2, and with Point 4 retesting this exact level where winners reside, we're positioned for a powerful return move higher. The hidden bullish divergence on both RSI and MFI signals bears are exhausted while the CDV uptrend confirms continued institutional buying pressure - setting up for a squeeze above 187.
Confluences:
Confluence 1: Proven Market Participant Pattern (1-2-3-4)
The numbered pattern shows a textbook setup where Point 3 closing above Point 1 validates Point 2 as a proven buyer zone. Point 4's return to this zone represents smart money accumulating at a level where they've already demonstrated dominance. This isn't just support - it's a battleground where bulls have already claimed victory once.
Confluence 2: Hidden Bullish Divergence
Both RSI and MFI are showing hidden bullish divergence - price made a higher low while indicators made lower lows. This is the signature of accumulation, where smart money quietly loads up while retail sees weakness. The oversold readings on both indicators suggest the elastic band is stretched to its limit.
Confluence 3: CDV Uptrend Confirmation
The Cumulative Delta Volume remains in a clear uptrend despite the price pullback. This divergence between price action and buying pressure reveals that institutions are absorbing the selling, preparing for the next leg higher.
Web Research Findings:
- Technical Analysis: CHF/JPY currently trading at 186.63 with strong support identified at 185.00-184.70 (144 EMA zone) . Multiple analysts noting bullish structure intact.
- Recent News/Earnings: Bank of Japan raised rates to 0.5% on January 24, 2025, highest level in 17 years while SNB cut rates to 0% on June 19, 2025 - creating a narrowing rate differential.
- Analyst Sentiment: Mixed but leaning bullish - Technical ratings show "buy" signal on 1-week timeframe
- Data Releases & Economic Calendar: Next BoJ meeting July 31, 2025; SNB meeting September 2025
- Interest Rate Impact: BoJ at 0.5% vs SNB at 0% creates 50bp differential favoring JPY, but market positioning suggests this is priced in
Layman's Summary:
Think of this like a tug-of-war where the rope (price) pulled back to where the winning team (bulls at Point 2) originally planted their feet. The fact that buying volume keeps increasing even as price dips is like seeing the winning team adding more players while appearing to lose ground - they're actually coiling for a massive pull. The interest rate story (Japan raising, Switzerland cutting) should favor the yen, but the market's already absorbed this news and bulls are positioning for the next move up.
Machine Derived Information:
- Image 1: 1-hour CHF/JPY chart showing numbered pattern 1-2-3-4 - Significance: Validates proven participant theory where Point 2 buyers defeated sellers and Point 4 offers re-entry - AGREES ✔
- Hidden Divergence Indicators: RSI and MFI both oversold with higher lows on price - Significance: Classic accumulation pattern before explosive moves - AGREES ✔
- CDV Analysis: Uptrend maintained despite price pullback - Significance: Institutional buying absorbing retail selling - AGREES ✔
Actionable Machine Summary:
All machine-derived indicators align bullishly: the numbered pattern confirms smart money accumulation zones, hidden divergences signal coiled spring energy, and volume analysis reveals institutions are buying the dip. The setup suggests entering at Point 4 (current level ~186.09) with stops below Point 2 (185.61) for a measured move targeting above Point 3 (187+).
Conclusion:
Trade Prediction: SUCCESS
Confidence: High
This setup presents a textbook accumulation pattern where bears have been trapped and exhausted at a level where bulls previously demonstrated superiority. The confluence of hidden bullish divergence, sustained buying volume, and a retest of proven support creates an asymmetric risk/reward opportunity. While rate differentials theoretically favor JPY, the market has already digested this narrative and technical structure suggests bulls are preparing for the next leg higher.

CHFJPY: Strong Bullish Pattern 🇨🇭🇯🇵
CHFJPY is currently updating the All-Time High, breaking
a neckline of a cup & handle pattern.
Looks like an uptrend is going to continue.
Next resistance - 186.85
❤️Please, support my work with like, thank you!❤️
I am part of Trade Nation's Influencer program and receive a monthly fee for using their TradingView charts in my analysis.

CHFJPY – Bulls Eye Fresh Highs as Momentum BuildsCHFJPY has been grinding higher after bouncing from its recent lows, and price is now testing resistance with strong bullish intent. The market is respecting its upward channel structure, and with both the franc and yen playing safe-haven roles, the battle comes down to relative central bank stances. At the moment, the Swiss franc looks stronger, keeping the upside path intact.
Current Bias
Bullish – CHFJPY continues to trend higher, with buyers in control toward key resistance.
Key Fundamental Drivers
CHF: The Swiss National Bank (SNB) remains cautious but is less dovish than the BoJ, allowing CHF to retain strength.
JPY: The yen is supported by safe-haven flows but capped by BoJ’s slow exit from ultra-loose policy.
Rate spreads: The differential continues to lean in favor of CHF versus JPY.
Macro Context
Interest rates: SNB has signaled less urgency to cut compared to other central banks, while BoJ is still defending easy policy despite yield adjustments.
Growth: Japan shows modest economic expansion, while Switzerland’s economy remains steady, backed by low inflation.
Geopolitical: Risk sentiment plays a key role—when risk aversion spikes, both CHF and JPY strengthen, but CHF has recently outperformed.
Primary Risk to the Trend
A sudden shift in BoJ policy or a sharp risk-off wave could swing momentum toward JPY, cutting CHFJPY’s upside potential.
Most Critical Upcoming News/Event
SNB policy outlook and any intervention chatter.
BoJ commentary around yield curve control and inflation targets.
Leader/Lagger Dynamics
CHFJPY often acts as a lagger, following broader safe-haven demand trends shaped by USDJPY and EURCHF. It tends to react after JPY crosses move, rather than leading.
Key Levels
Support Levels: 184.79, 183.84
Resistance Levels: 185.74, 186.70
Stop Loss (SL): 183.84
Take Profit (TP): 186.70
Summary: Bias and Watchpoints
CHFJPY bias is bullish, with SL at 183.84 and TP at 186.70. CHF’s relative resilience against JPY keeps the upside favored, especially as SNB remains firmer compared to BoJ. The key watchpoints are SNB policy tone and Japanese yield commentary, which could shift the balance. Unless JPY strengthens sharply on safe-haven demand, CHFJPY looks set to test higher resistance levels.

CHF/JPY: Uptrend Continues — Next Targets Above 186.50Market Overview:
The Swiss Franc/Japanese Yen pair is holding firmly above the 144 EMA, confirming a strong bullish trend. The recent pullback was quickly bought up around 185.00, highlighting strong buying interest.
Technical Signals:
Support: 185.00 – 184.70 (144 EMA zone).
First target: 186.50, followed by 187.50.
AO indicator confirms bullish momentum.
Scenario:
As long as CHF/JPY remains above 185.00, the bullish scenario prevails with growth potential towards 186.50 and 187.50. A breakdown below 184.70 would temporarily weaken the bullish setup

Sell CHF/JPY at top of range CHF/JPY is back at it's range highs again. There has been news in Japan hinting at raising interest rates and with CHF/JPY at range highs seems like a good place to sell the pair back down to recent range lows.
Sell Limit : 186.20 spike into top of range
Stop : 187.113 above major resistance
Profit : 183.00 cluster support / 78.6% Fib
Risk 1 : 3.5 stop is 91 pips

CHF JPY LONG RESULT Price was trading in a bullish symmetrical triangle and also at demand zone at the point of entry and I decided to join to the upside and price moved strongly in our prediction smashing our TP.
_THE_KLASSIC_TRADER_.💪🔥

CHFJPY buy signal at 186.300 sl 185.500 tp 196. we have just broke past the weekly resistance so im taking longs from 186.3, banks are long on the chf and shorting jpy so great entry for long term swings by setting a buy limit for this position.

CHF_JPY BULLISH BREAKOUT|LONG|
✅CHF_JPY is going up
Now and the pair made a bullish
Breakout of the key horizontal
Level of 186.000 and the breakout
Is confirmed so we are bullish
Biased and we will be expecting
A further bullish move up
LONG🚀
✅Like and subscribe to never miss a new idea!✅

CHFJPY: Trend ContinuationAfter a pullback throughout August, it seems like this pair is gaining its momentum back. Here are my observations over on different timeframes.
Daily Timeframe:
EMA20 is above EMA60, which signals there's an overall uptrend
Price also pulled back and stayed above the DTL, indicating that this breakout is successful
H1 Timeframe:
Price crosses above the DTL, which is another indication that trend confluence is resuming
EMA20 being above EMA60 and diverging is giving indications that momentum is likely picking up

short chfjpysell chfjpy if price approaches premium. my time analysis software indicates a reversal today
