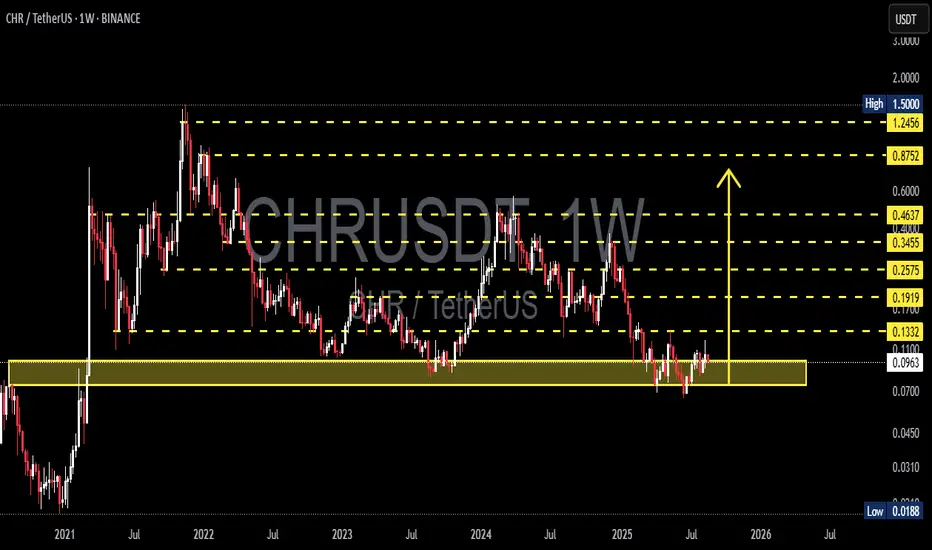
CHR/USDT — Sitting on Demand Zone, Rebound or Breakdown Ahead?CHR/USDT is currently trading around $0.0971, right inside the historical demand zone $0.07–0.12, which has been a strong accumulation area since 2021.
This zone has acted as a launchpad for multiple rallies, but at the same time, it holds a pool of equal lows liquidity that could be swept if buyers
CHRUSDT UPDATE#CHR
UPDATE
CHR Technical Setup
Pattern: Bullish Wave Pattern
Current Price: $0.1043
Target Price: $0.16
Target % Gain: 52.95%
Technical Analysis: CHR is showing a bullish wave breakout on the 1D chart, reclaiming resistance around $0.10–$0.11 as new support. Strong bullish candles and moment

CHR · Perfect Timing · 1177% Profits PotentialIf I had to summarize this entire article (chart) in a single phrase it would be: Perfect timing.
CHRUSDT (Chromia) has perfect timing for massive growth. A full reversal pattern is present and complete with the bullish breakout happening now with two weeks closing green and many weeks moving up.

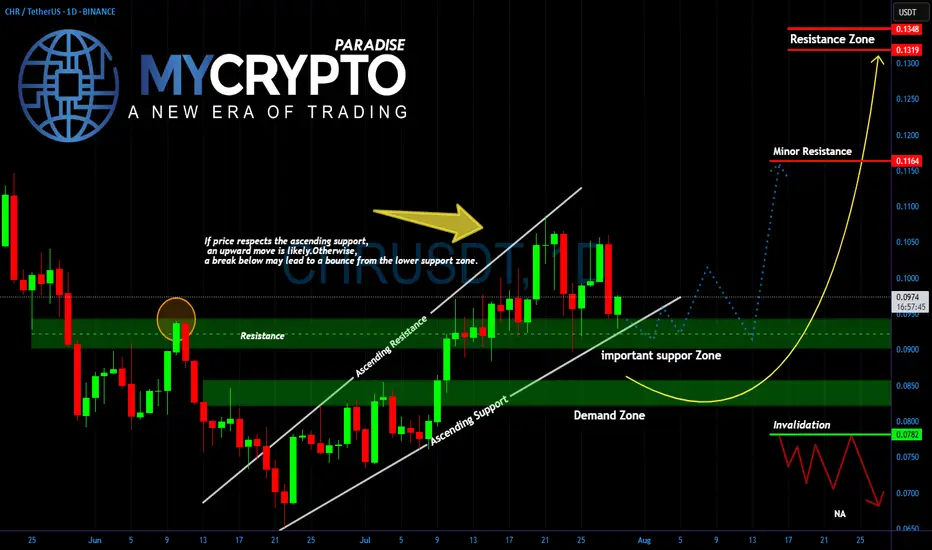
CHR Is About to Explode or Collapse Are You Ready for the Next BYello Paradisers, did you notice how #CHRUSDT is now testing the exact zone we warned about earlier? After weeks of climbing inside a clean ascending channel, the price is now sitting right on top of a critical support area. This is no coincidence what happens here will determine the next major wave
CHR/USDT Major Breakout! Bullish Momentum Ignites🧠 Complete Technical Analysis:
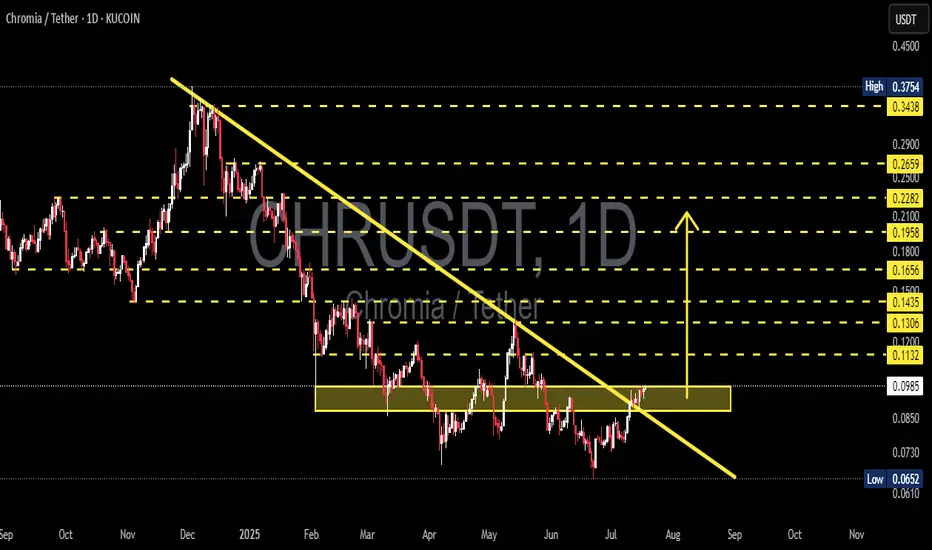
After months of being trapped in a prolonged downtrend since December 2024, Chromia (CHR) has finally shown signs of awakening. The price has successfully broken out of a major descending trendline, while also breaching a critical consolidation resistance zone between
#CHR Is gearing up for an update ?#CHR
The price is moving within a descending channel on the 1-hour frame, adhering well to it, and is on its way to breaking it strongly upwards and retesting it.
We have a bounce from the lower boundary of the descending channel. This support is at 0.0788.
We have a downtrend on the RSI indicato

#CHR READY TO NEW EXPLODE !#CHR
The price is moving within a descending channel on the 1-hour frame and is expected to break and continue upward.
We have a trend to stabilize above the 100 moving average once again.
We have a downtrend on the RSI indicator that supports the upward break.
We have a support area at the lowe

CHR/USDTKey Level Zone: 0.0760 - 0.0765
LMT v2.0 detected.
The setup looks promising—price previously trended upward with rising volume and momentum, then retested this zone cleanly. This presents an excellent reward-to-risk opportunity if momentum continues to align.
Introducing LMT (Levels & Momentum Tr

CHRUSDT UPDATE
Pattern : Falling Wedge Breakout
Current Price: \$0.0802
Target Price: \$0.1150
Target % Gain: 45.45%
Technical Analysis: CHR has broken out of a falling wedge on the 8H timeframe, with a confirmed close above the trendline. Volume shows a minor spike supporting the breakout. Potential upside of

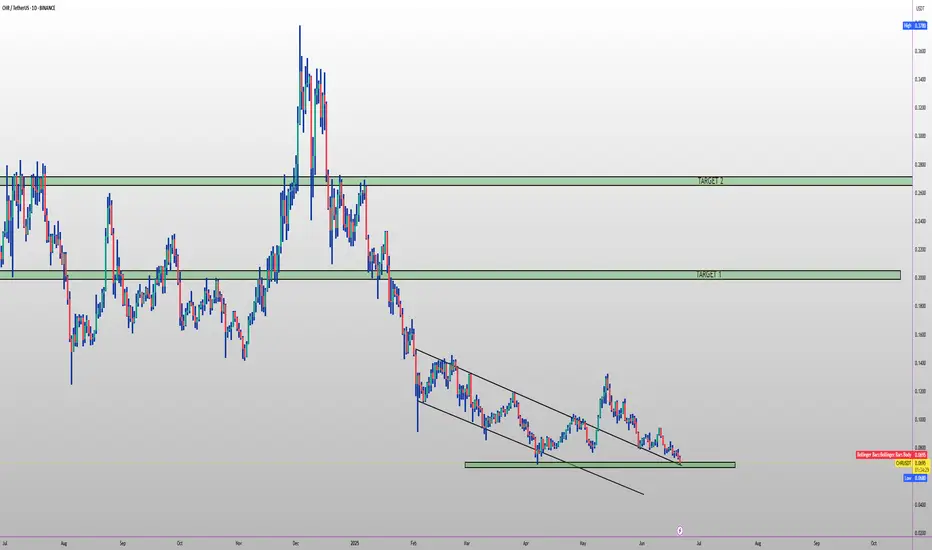
CHR TARGETS FOR 2025 🔥 NASDAQ:CHR long setup (1D) 🚀
✅ Entry Zone: $0.068 – $0.062 (12-month demand)
🎯 Targets
• TP-1: $0.17 (Q4-24 supply flip)
• TP-2: $0.24 (2024 breakdown block)
⛔ Stop-Loss
Daily close < $0.052
📊 Thesis
• Chromia mainnet modules live; full network launch slated before TOKEN2049
• Filehub main
See all ideas
Summarizing what the indicators are suggesting.
Oscillators
Neutral
SellBuy
Strong sellStrong buy
Strong sellSellNeutralBuyStrong buy
Oscillators
Neutral
SellBuy
Strong sellStrong buy
Strong sellSellNeutralBuyStrong buy
Summary
Neutral
SellBuy
Strong sellStrong buy
Strong sellSellNeutralBuyStrong buy
Summary
Neutral
SellBuy
Strong sellStrong buy
Strong sellSellNeutralBuyStrong buy
Summary
Neutral
SellBuy
Strong sellStrong buy
Strong sellSellNeutralBuyStrong buy
Moving Averages
Neutral
SellBuy
Strong sellStrong buy
Strong sellSellNeutralBuyStrong buy
Moving Averages
Neutral
SellBuy
Strong sellStrong buy
Strong sellSellNeutralBuyStrong buy
Displays a symbol's price movements over previous years to identify recurring trends.