CHRUSDT 4HBuy some #CHR here and on its support level of $0.2423
Falling wedge formation on 4H timeframe and it is about to break the resistance. In case of a clean breakout, the targets are:
$0.3193
$0.3669
$0.4054
$0.4440
$0.4988
$0.5686
Support is: $0.2423
Trade ideas

#CHR/USDT ANALYSIS CHR is currently moving within a falling wed#CHR/USDT ANALYSIS
CHR is currently moving within a falling wedge pattern, nearing a breakout point where the 100-day moving average (MA) is also serving as resistance. A strong breakout from the falling wedge would confirm bullish momentum.
CHRUSDT is BullishCHRUSDT made a bullish RSI divergence on 4H time frame, and the bullish momentum was further confirmed by the formation of higher high, this means that bulls have taken control of the price action and a bullish rally is on the cards. Targets are mentioned on the chart.

CHRUSDTCHRUSDT was trading under the declining trendline. The price was reacting well the support and resistance of trendline
Currently the price has given the breakout from declining trendline with confluence to strong bullish divergence and now seems like the bulls are getting ready for some strong upside movement.
If the bulls sustain to upside the optimum target could be 0.3500
What you guys think of this idea?

Chromia longChromia bounced off the lower boundary of horizontal channel. Bullish movement to resistance level at 0.2817 is possible.

CHRUSDT.1DThe daily chart for Chromia (CHR/USDT) shows that the asset has been trading within an ascending channel, indicating a bullish trend. However, the recent price action has dipped towards the lower boundary of the channel, currently at $0.3283, which could be a crucial support level (S1) at $0.2409.
The resistance level (R1) has been established at around the previous high of $0.5029. The RSI is slightly bearish at 41.81, and the MACD is below the signal line, both indicating that there might be more bearish momentum in the short term.
Traders might look for buying opportunities near the lower boundary of the ascending channel with a stop loss below S1, aiming for R1 as a short-term target. If the price breaks below the channel, it could signal a potential reversal of the bullish trend. It would be wise to wait for a clear signal such as a breakout or a bounce from key levels with confirming volume before making a trade decision.

Chromia 1-2 SetupChromia appears to be undergoing Wave 2 of Wave C, with an anticipated further decline before the ascent of Wave 3 of Wave C begins. It's feasible that this additional low might not occur, and instead, the price could rally during Wave 3 of C. Traders are advised to gradually buy at support levels and sell at resistance. The projected price range for Wave C lies between $4 and $13. Although there are higher potential targets, their reliability seems questionable.

CHRUSDT Trading opportunityCHRUSDT is currently demonstrating strength as it holds the ascending trendline, indicating underlying bullish momentum. Additionally, there are signs of a potential rounding bottom formation, with the neckline serving as a crucial external supply level.
Our plan involves accumulating the coin within the immediate demand zone and patiently waiting for it to test the significant neckline resistance zone. It's essential to approach trading with the utmost care and diligence, given the market's volatility.
We value your insights and opinions on CHRUSDT

Update CHR I have 2 scenarios: after penetrating the specified trend, the medium-strength cluster will complete its targets to 0.493, and after penetrating to 0.52, our final target is 0.573, or correction to 0.41 - 0.43, and then complete the targets, and I will update first and foremost. Do not forget to follow up

CHR analysisThere is a large support area for the currency, ranging between 0.375 - 0.35. It is considered a large support area, and there is another area at 0.284 - 0.27. We will update its targets. Do not forget to follow.

#CHR/USDT#CHR
The price is moving in a triangle on the 12-hour frame and we have a support area in green at the 0.350 level
We have a higher stability moving average of 100
We have a good bounce being prepared from the lower border of the triangle once the downtrend breaks to the upside
The RSI indicator has a downtrend that is about to break higher
Entry price is 0.3800
The first target is 0.4121
The second target is 0.4550
The third target is 0.5100

#CHZ in case of deep correctio i'll look for a buyin case we saw a deep correction for CHZ
those are the 2 areas I'll look for a buy setup.
1st area 0.35-0.37
2nd 0.25-0.27area reaching them ain't granted but if the price managed to reach them it will be a good opportunity , so take it
and follow me 😉
next step is supporting and boosting this idea


CHRUSDT - Trend + Resistance Breakout!CHRUSDT (1D Chart) Technical analysis
CHRUSDT (1D Chart) Currently trading at $0.123
Buy level: Above $0.121
Stop loss: Below $0.097
TP1: $0.136
TP2: $0.165
TP3: $0.195
TP4: $0.3
Max Leverage 3x
Always keep Stop loss
Follow Our Tradingview Account for More Technical Analysis Updates, | Like, Share and Comment Your thoughts

#CHR/USDT - Long - Potential 37.04%Strategy: Long
Exchange: BINANCE
Account: Spot
Entry mode: Market order in range
Invest: Risk 1%
Exit:
• ⎿ Target 2 : 0.6785 35.73%
• ⎿ Target 1 : 0.5656 13.14%
Entry: 0.4999 ⌁ 0.4999
• ⎿ Current market price: 0.4999
Stop: 0.4206 (-15.86%)
Technical indicators:
Resistance break at 4827 with big volume spike, trendline break, RSI momentum
• ⎿ 24h Volume: 44701318.1693
• ⎿ Satoshis: 0.4999
• ⎿ Analysis: TradingView

CHR/USDT Bullish pennant formation, Indicating Bullish momentum!💎 CHR has recently encountered notable market dynamics, with the current price bouncing within a support area and forming a bullish pennant pattern.
💎 This pattern typically suggests a continuation of the bullish trend. If CHR successfully breaks out of the pattern, it may experience significant upward movement, potentially reaching our target area.
💎 However, if CHR faces rejection and fails to break out, it may revisit the support area for multiple tests.
💎 This support area holds significant importance, as a failure to sustain it could lead to a breakdown and signal further downward movement for CHR.

CHR ANALYSIS (4H)In the current situation, you can look for a buy/long position only in the demand range, and only the buy/long position in this range is low risk.
There is a liquidity pool at the bottom expected to be swept away soon
The targets are clear on the chart.
Closing a daily candle below the invalidation level will violate the analysis
For risk management, please don't forget stop loss and capital management
When we reach the first target, save some profit and then change the stop to entry
Comment if you have any questions
Thank You

CHRUSDTlong on chrusdt looks good it looks grt to me long on chrusdt looks good it looks grt to me long on chrusdt looks good it looks grt to me


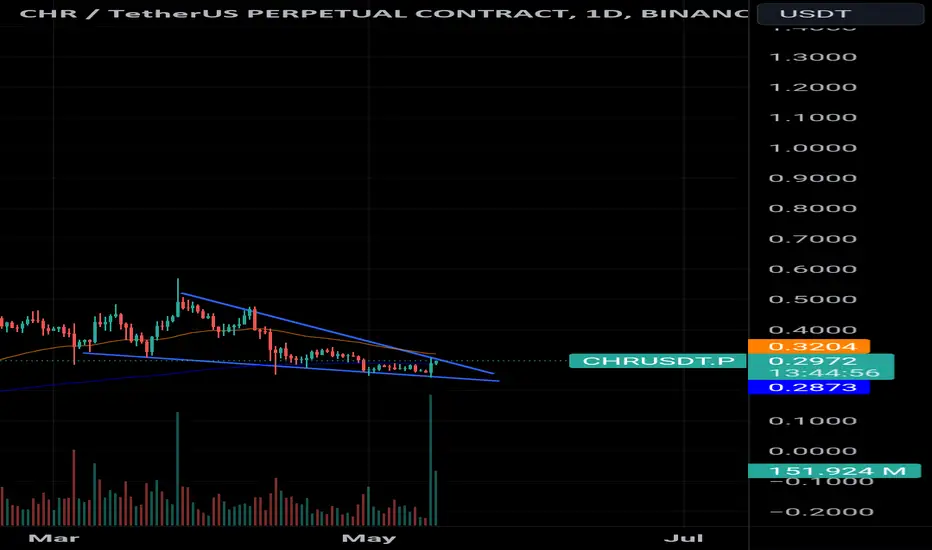
#CHR $CHR #CHRUSDT CHR #CHROMIAChromia is been forming falling wedge! the silence b4 the storm! for now its brokenupside ! we get volume we might see massive rally on CHR! HOLD UR HORSES TIGHT!

CHR/USDT Facing a critical resistance area. Breakout or rejected💎 CHR has recently undergone significant developments in the market. Currently, CHR is facing a critical resistance area. A week ago, CHR attempted to break through this resistance but faced a strong rejection, causing the price to retest the support area.
💎 Now, CHR is making another attempt to break through this key resistance level, and if successful, it could trigger a bullish momentum, leading to a significant upward movement with the probability to reach the bearish order block (OB) area.
💎 However, if CHR once again fails to break through and shows signs of bearish rejection, similar to the previous attempt, there is potential for the price to return to the support area to establish new momentum.
💎 The support area is of utmost importance and would require a bounce to maintain its bullish stance. If CHR fails to sustain above the support and breaks below it, this could indicate a shift back to a downward movement, with the potential to revisit the demand area or even move further downward.

