CHRUSDTHello Traders,
Here I am doing a short analisyis on CHRUSDT as we see on the chart CHR is in bearish trend but we can expect a bullish trend to upward when it come to the support then we can grab some CHR before the support level if you are buying then it is risky , for safe trade wait until it comes to the support.
Trade ideas

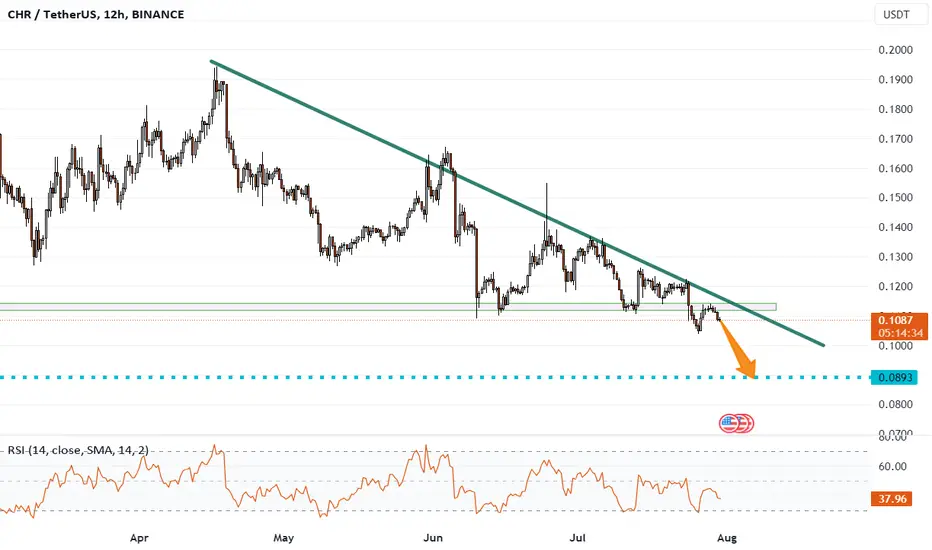
CHRUSDT - stable dropHello everyone. In search of an appropriate schedule, the CHRUSDT coin caught my eye. For 5 months now, the price has been steadily going downhill and there are no prerequisites in the chart for its reversal. Especially now when the coin broke through the 0.11 level and went to retest this level. Also, the price is covered from above by a trending descending line. That's where the thoughts come from on the short with a target of 0.09.
chr short position and longbullish butterfly is formed. to utilize the profit short and long. check the sl, proper position size has to observe

CHRUSDTCHRUSDT is trading in bullish parallel channel and now it seems like the pair is facing resistance around 0.1360 region. Will the price retrace back to support zone?

CHRUSDT UPDATE :Double Bottom Pattern and Potential Bounce 0.3?
Free CHR trade signal at the end of this post, please like, share and follow for updates
📊CHR Chart Analysis: Chromia buyers have formed a double bottom pattern on the daily chart, indicating a potential bounce as accumulation continues at this support according to MT's pandoras Box. However, it's important to note that CHR is currently range-bound on higher timeframes, suggesting a move toward the 0.25 resistance level. Breaking this resistance could lead to a move towards the 0.3 range, but there may be some back-and-forth price movements. While there is a chance of reaching 0.68, the probability is below 45%, so it should not be expected. It is advisable to set a stop loss at the $0.0884 range, as a break below that level could result in further downside. Therefore, while we anticipate bullish momentum, caution should be exercised due to potential bearish pressure, particularly at the current support level.
Notice: This post will be regularly updated as the price progresses toward the target or in the event of potential failures due to rejections. We encourage readers to like, comment, and follow this page to stay updated with the latest developments and adjustments. Your engagement and support are greatly appreciated.
Free CHR Long Trade Signal:
To.
📈 MT FREE CHR TRADE SIGNAL 📈
(Highly risky entries to Scalping Bull Opportunities )
👉 ASSET: TSX:CHR (CHR/USDT)
👉 ACTION: LONG
👉 1st ENTRY PRICE: $0.1237, 2nd Entry ; 0.13112, 3rd Entry ;0.1319
(Buy Incrementally)
👉 STOP LOSS: $0.0884(Risky Stop 0.1017)
👉 1st TAKE PROFIT: 0.169
2nd TP: $0.25 3rd TP: $0.358 (Extended 0.4 to 0.6)


Chromia pushing up soon ? CHRUSDT has exhibited a promising bullish momentum as it successfully retested a key support level at 0.1110, indicating a potential bullish reversal. The recent price action shows a series of higher highs, suggesting increasing buying pressure and a potential continuation of the uptrend.
Retest of Support: CHRUSDT recently retraced to the support level at 0.1110. The successful retest indicates that buyers have stepped in to defend the level, potentially leading to an upward price movement.
Higher Highs: Following the retest of support, CHRUSDT has been forming higher highs, reflecting a gradual increase in buying momentum. This pattern indicates a potential continuation of the upward trend.
Bullish Momentum: The positive momentum is further supported by rising volume and increasing buying interest in the market. This suggests that traders and investors are actively accumulating CHRUSDT, adding to its bullish outlook.

Long chromia0.1224 possible target for chromia/usdt , because it is easy target compared to where bitcoin is

CHR USDT PERP Hello Trader BINANCE:CHRUSDT.P
use a small time frame for scalping
because of the upside potential in these pairs,
there is a strong increase and it has
penetrated the supply point, you can retest
the area that I have marked to take the long area.
hopefully come true
Please add a comment and Positive feedback and
constructive criticism are important to authors and the
community.
Disclamer: Not Financial Advice

Chromia shortChromia bounced off the resistance level. Asset broke trough off the ascending trendline. Bearish movement to support level at 0.128 is possible.

Chromia (CHR) Forms Double Bottom Pattern!💎 Chromia make a double bottom pattern formation. CHR USDT has been steadfastly maintaining a significant support level setting the stage for potential price movements. A key milestone to watch out for is the breakout of the neckline.
💎if the neckline breaks successfully it could trigger a powerful breakout and price move toward strong resistance.
Disclaimer: This is Not Financial Advice ❗️ Trade at Your Own Risk ⚠️

CHR breaking this big structure!12h time frame
-
CHR breaking above this triangle.
Retesting is opportunity to open long around 0.16.
A plan with great RR!
Target: 0.22~0.266
SL: 0.15

Chromia pumping this week 🚀CHRUSDT active addresses ratio has grown by 555% signaling a clear new interest in this coin. On the technical side, we have made a fakeout followed by a break and re-test of the support. My 2 targets are at 0.1548 and 0.1943 .

$Chrinvalidation below red line target yellow line
stoch in bullish territory we just need it to cross up again ..

Long it and keep holding Long #CHR , Hold onto it for an extended period, and see it grow from 8% to 18%, and eventually all the way up to 31%.

CHROMIA longCHROMIA bounced off the ascending trendline and bounced off the support level. Bullish movement to resistance level at 0.154 is expected to happen.

CHR break the channel pattern supportCHR break the support downside on 15 time it better time for scalping to short it

CHRUSDT and the 4-month trendHello everyone. Now many coins have approximately the same chart. On the daily chart, the price is testing a 4-month trend line. On top, the CHRUSDT coin is also clamped by a line. Therefore, we will set the price movement goal exactly there, at the level of 0.18. We will put a stop behind the trend line at 0.1552.

Chr is in correction wave with good short opportunity Hello guys.
I am sure you all are ready for the next pump. But i think it is early to buy this coin. Until now why we don’t look for short position for this chart with good management of risk.
I think the correction is not done yet as we see in the chart we have this wave if it is consistent of 5 waves then it is Zigzag with WXY. Now wave Y is under build that is a good short position.
Hope you all get richer soon
Bye


LongThis coin had huge correction past months now is picking I see good set up long target 0.21- 0.22 area

CHRUSDT is creating a penanntCHRUSDT is creating a pennant on the $0.17 area.
A pennant is a technical chart pattern that resembles a triangle. It's formed when there's a sharp move in the price of an asset, followed by a consolidation phase with converging trendlines. The pennant is typically characterized by decreasing trading volume and volatility as the price moves closer to the tip of the triangle. A clear breakout from the pennant pattern with significant volumes can be a strong indication of the direction of the next price move.
According to Plancton's Rules, if the price of CHRUSDT has a clear breakout with significant volumes from the pennant pattern on the $0.17 area, it may suggest a bullish trend. Traders could consider entering a new long position with the expectation of a continued uptrend.

CHR/USDT once again on my eyeWaiting for a good move on chr this weekend. Same scenario as in last week, even BTC still holding its price. Stil green days on my mind.
Not financial advice. DYOR.
