CHZ/USDT ; BUY MARKET!!!Hello friends
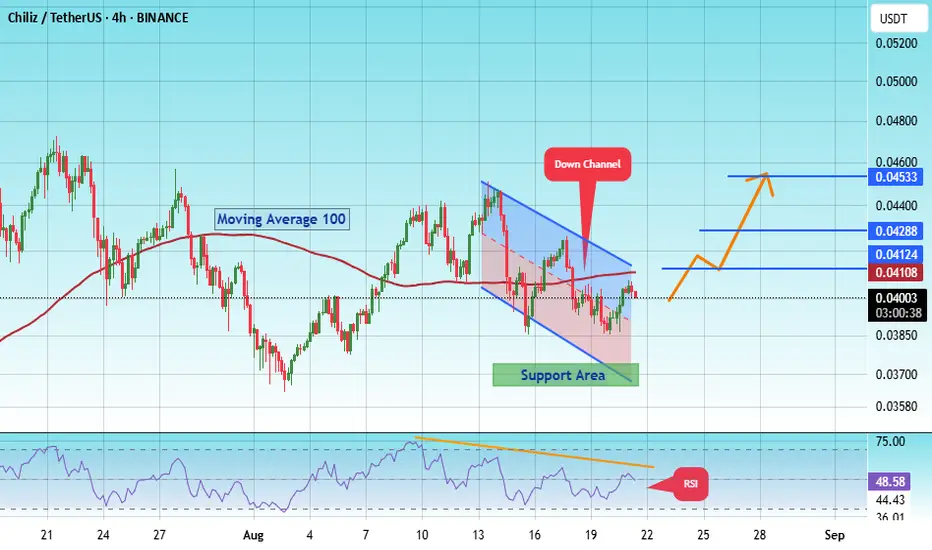
Given the good growth we had, the price has entered a correction phase and is in the specified support area that I determined, the price is supported and if the price continues to be supported, we can see the specified targets.
*Trade safely with us*

CHZ🔍 Technical Analysis
Pattern – Symmetrical Triangle
Price has been consolidating inside a symmetrical triangle (blue trendlines).
These triangles usually indicate a continuation pattern, but since CHZ was in a sideways-to-down trend before, breakout direction is crucial.
Breakout
The latest can

#CHZ/USDT Reversal Potential Breakout & Fibonacci Retest in Fo#CHZ
The price is moving within a descending channel on the 1-hour frame, adhering well to it, and is heading for a strong breakout and retest.
We have a bearish trend on the RSI indicator that is about to be broken and retested, supporting the upside.
There is a major support area (in green) at
[Scalp] SELL CHZSELL BINANCE:CHZUSDT
En: 0.04087
Sl: 0.04149
Tp: 0.03816
Confirmation entry bias!
⚠️ If price hit target before filling entry!.
We cancel trade!

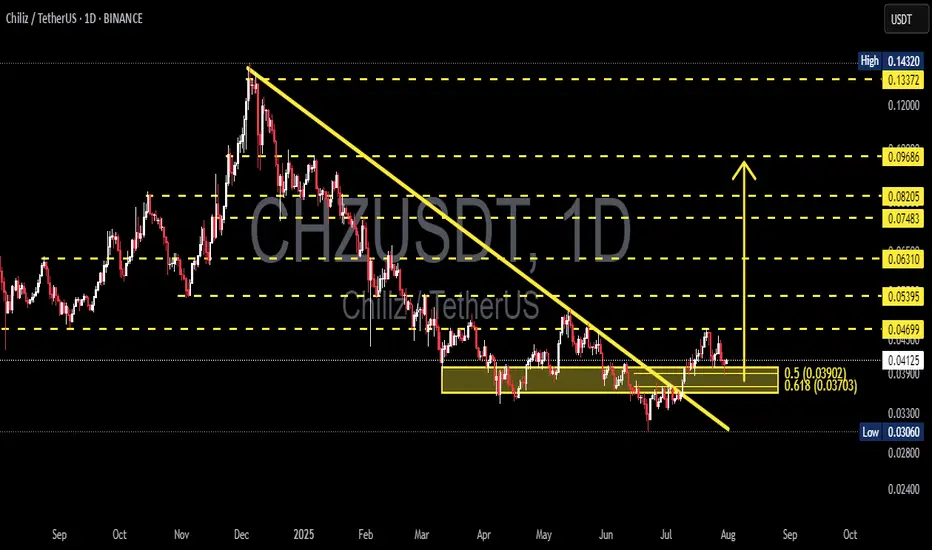
Chiliz Consolidates at Value Area Low, Eyes Bullish Expansion Chiliz (CHZ) is trading within a weekly equilibrium between $0.33 and $0.48. Holding this support region could spark a bullish expansion toward the 0.618 Fibonacci and beyond.
Chiliz has entered a consolidation phase, with price trading between key high timeframe support levels. The range between $

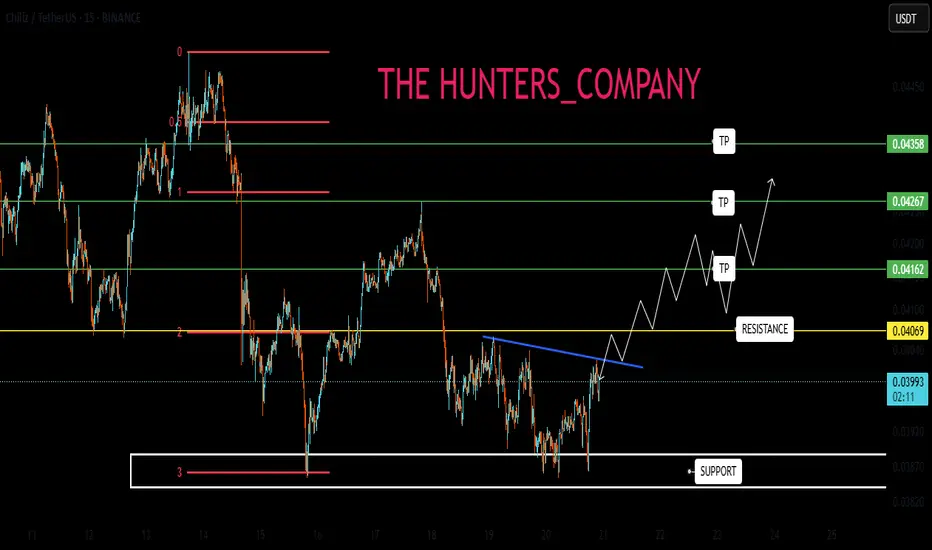
Possible Bullish RunIf trend line breaks our resistance, we have a clear bullish run. Chart indicators also provide a bull run on CHZUSDT. A maximum of 10% profit is expected.

CHZ : BUY OR SELL? Hello friends
According to the price drop, you can see that the price is in the support area specified by the buyers. The specified support is also specified with Fibonacci, which is from our own strategy.
Now, if the support is held and the specified resistance is broken, the price can move to the
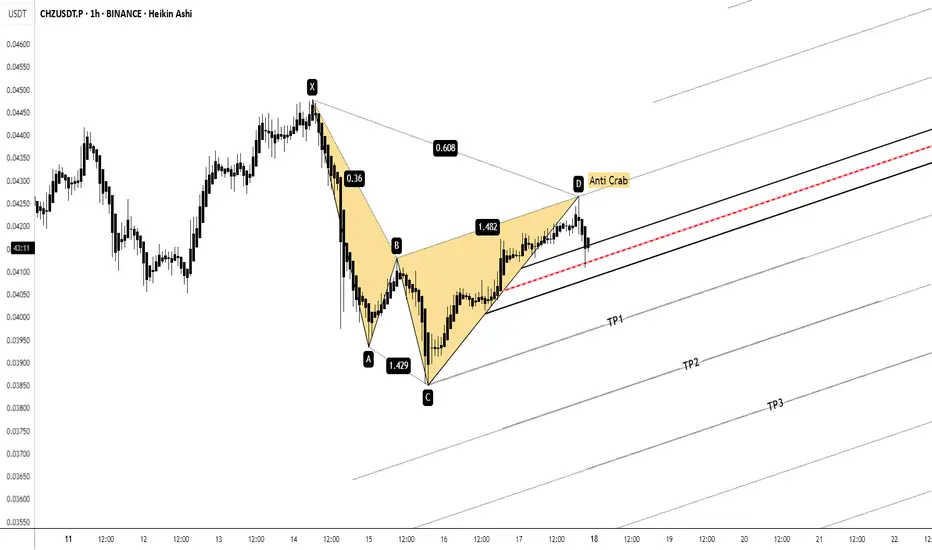
CHZUSDT.P | 1H Short ThermI’m taking a short position on CHZUSDT.P (1H) based on an Anti Crab harmonic pattern that completed at point D.
🔎 Confluences:
– Anti Crab harmonic completion at resistance
– TDG momentum indicator flipped bearish (Sell mode)
– Structure aligned with median line channel (Pulsefork)
📉 Plan:
– Entry

CHZUSDT Reversal Potential Breakout & Fibonacci Retest in FocusChart Analysis:
The CHZ/USDT pair on the 1D timeframe has successfully broken out of a long-term descending trendline, which had been acting as resistance since December 2024. The breakout occurred with a strong bullish candle, suggesting a potential trend reversal.
Currently, the price is perform
See all ideas
Summarizing what the indicators are suggesting.
Oscillators
Neutral
SellBuy
Strong sellStrong buy
Strong sellSellNeutralBuyStrong buy
Oscillators
Neutral
SellBuy
Strong sellStrong buy
Strong sellSellNeutralBuyStrong buy
Summary
Neutral
SellBuy
Strong sellStrong buy
Strong sellSellNeutralBuyStrong buy
Summary
Neutral
SellBuy
Strong sellStrong buy
Strong sellSellNeutralBuyStrong buy
Summary
Neutral
SellBuy
Strong sellStrong buy
Strong sellSellNeutralBuyStrong buy
Moving Averages
Neutral
SellBuy
Strong sellStrong buy
Strong sellSellNeutralBuyStrong buy
Moving Averages
Neutral
SellBuy
Strong sellStrong buy
Strong sellSellNeutralBuyStrong buy
Displays a symbol's price movements over previous years to identify recurring trends.