Short trade
Trade Journal Entry 2 – New Sell-Side Setup
Pair: CHZUSDT Perpetual
Trade Type: Sell-side trade
Date: Wed, 1st Oct 2025
Time: 5:00 am
Session: Tokyo to London AM
Trade Details
Entry: 0.04610
Profit Level (TP): 0.04100 (-8.42%)
Stop Level (SL): 0.04690 (-0.71%)
Risk-to-Reward (RR): 11.78
Context

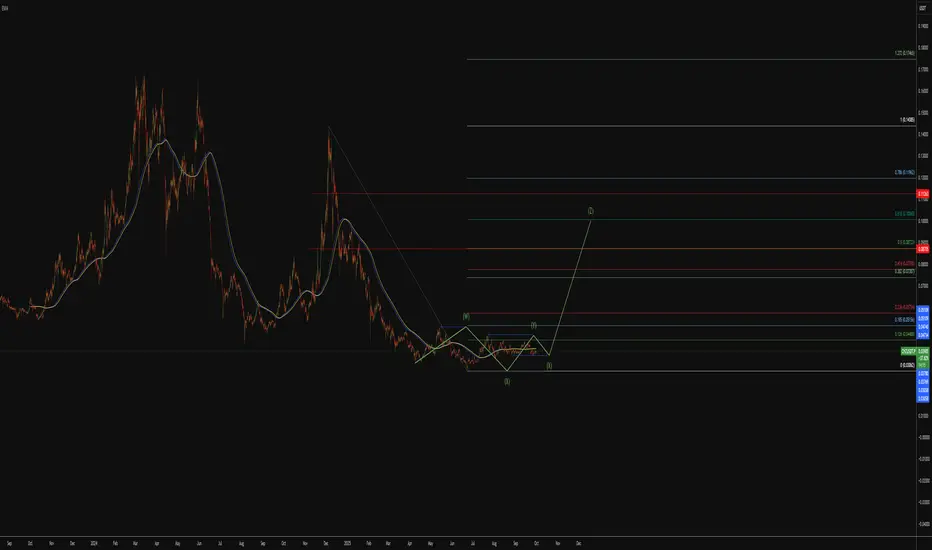
CHZ/USDT ; BUY ...Hello friends
Well, you can see that after a good rise, the price has formed a flag, and if this flag breaks, we can expect growth to the specified limits.
*Trade safely with us*

Chiliz $CHZ ! IMPORTANT! Chiliz ( GETTEX:CHZ ) Technical Analysis: Bullish Scenario and Key Levels
Chiliz ( GETTEX:CHZ ) trades at approximately $0.0394 USDT, with a market cap around $360 million and 24-hour volume over $50 million. The token is down 1.4% in the last 24 hours but up 10% over the past day amid broader mar

See if we can break above 0.04364-0.04630
Hello, fellow traders!
Follow us to get the latest updates quickly.
Have a great day!
-------------------------------------
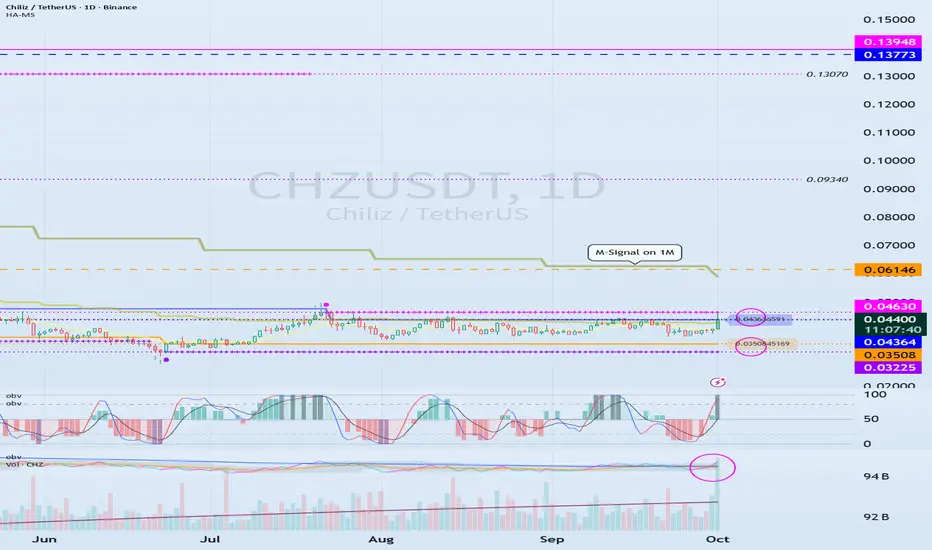
(CHZUSDT 1D chart)
The OBV indicator is showing an upward break above the EMA 2 indicator.
If the price rises above the 0.04364-0.04630 range, it is expected to continue
CHZUDT UPDATE#CHZ
UPDATE
CHZ Technical Setup
Pattern: Bullish falling wedge breakout
Current Price: $0.0433
Target Price: $0.0607
Target % Gain: 40.78%
CHZ is breaking out of a falling wedge pattern on the 1D timeframe. The breakout highlights bullish momentum with a target near $0.0607, offering over 40% po

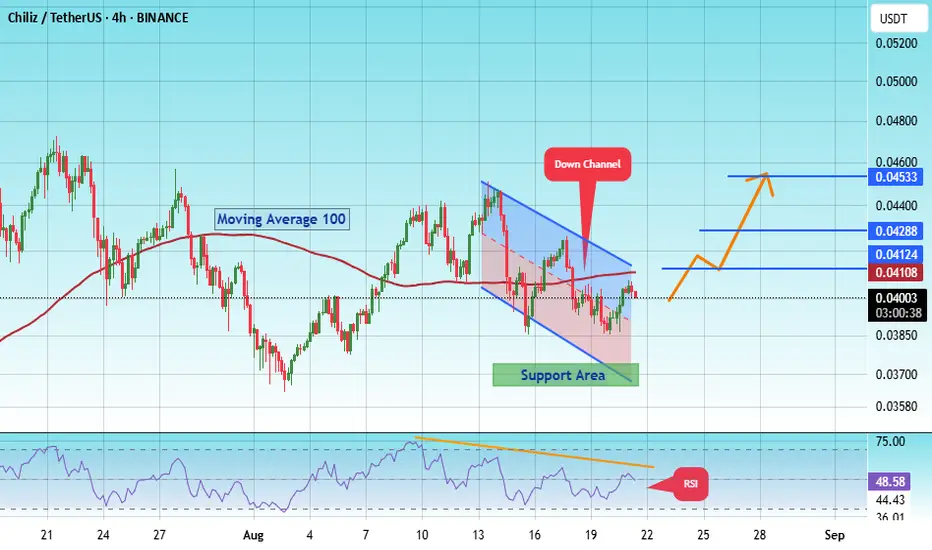
#CHZ/USDT Reversal Potential Breakout & Fibonacci Retest in Fo#CHZ
The price is moving within a descending channel on the 1-hour frame, adhering well to it, and is heading for a strong breakout and retest.
We have a bearish trend on the RSI indicator that is about to be broken and retested, supporting the upside.
There is a major support area (in green) at
CHZ/USDT ; BUY MARKET!!!Hello friends
Given the good growth we had, the price has entered a correction phase and is in the specified support area that I determined, the price is supported and if the price continues to be supported, we can see the specified targets.
*Trade safely with us*

Long trade
1Hr TF overview
Trade Journal Entry — CHZUSDT Perp (1H)
Trade type: Buyside
Date/Session on chart: Fri 26 Sep ’25, ~9:00 AM (LDN→NY overlap)
Trade details (from your bubble)
Entry: 0.03859
TP: 0.04372 (+13.29%)
SL: 0.03787 (-1.87%)
R:R: 7.13
Technical Narrative -Buyside bias
Context: Multi-wee

CHZ🔍 Technical Analysis
Pattern – Symmetrical Triangle
Price has been consolidating inside a symmetrical triangle (blue trendlines).
These triangles usually indicate a continuation pattern, but since CHZ was in a sideways-to-down trend before, breakout direction is crucial.
Breakout
The latest can

See all ideas
Summarizing what the indicators are suggesting.
Oscillators
Neutral
SellBuy
Strong sellStrong buy
Strong sellSellNeutralBuyStrong buy
Oscillators
Neutral
SellBuy
Strong sellStrong buy
Strong sellSellNeutralBuyStrong buy
Summary
Neutral
SellBuy
Strong sellStrong buy
Strong sellSellNeutralBuyStrong buy
Summary
Neutral
SellBuy
Strong sellStrong buy
Strong sellSellNeutralBuyStrong buy
Summary
Neutral
SellBuy
Strong sellStrong buy
Strong sellSellNeutralBuyStrong buy
Moving Averages
Neutral
SellBuy
Strong sellStrong buy
Strong sellSellNeutralBuyStrong buy
Moving Averages
Neutral
SellBuy
Strong sellStrong buy
Strong sellSellNeutralBuyStrong buy
Displays a symbol's price movements over previous years to identify recurring trends.