CHZUST.P trade ideas
Short trade
Trade Journal Entry 2 – New Sell-Side Setup
Pair: CHZUSDT Perpetual
Trade Type: Sell-side trade
Date: Wed, 1st Oct 2025
Time: 5:00 am
Session: Tokyo to London AM
Trade Details
Entry: 0.04610
Profit Level (TP): 0.04100 (-8.42%)
Stop Level (SL): 0.04690 (-0.71%)
Risk-to-Reward (RR): 11.78
Context & Structure
Major Low Spike: The prior buy-side move has now been completed; the price has hit liquidity above. Supply Zone: Overhead rejection zone at 0.046–0.047 aligning with the imbalance.
FVGs: Multiple inefficiencies now beneath the price act as downside magnets.
Narrative: Expectation of reversion → price to rebalance inefficiencies and retest demand lower.
Key Notes
The buy-side leg has successfully closed out, now flipping the bias to the sell-side with fresh liquidity targets. This sequencing is classic Wyckoff cycle rotation: accumulation → markup → distribution → markdown.

CHZ/USDT ; BUY ...Hello friends
Well, you can see that after a good rise, the price has formed a flag, and if this flag breaks, we can expect growth to the specified limits.
*Trade safely with us*

Chiliz $CHZ ! IMPORTANT! Chiliz ( GETTEX:CHZ ) Technical Analysis: Bullish Scenario and Key Levels
Chiliz ( GETTEX:CHZ ) trades at approximately $0.0394 USDT, with a market cap around $360 million and 24-hour volume over $50 million. The token is down 1.4% in the last 24 hours but up 10% over the past day amid broader market recovery, though it's declined 15% monthly and 25% year-to-date. GETTEX:CHZ remains in a multi-year downtrend from its 2021 ATH of $0.877, but recent breakouts from descending patterns signal potential reversal, especially with fan token ecosystem growth in sports and esports. Sentiment on X is increasingly bullish, citing pennant breakouts and trendline breaks, though some note resistance hurdles.
Fundamentals center on the Chiliz Chain for fan engagement tokens (e.g., Socios platform), with partnerships like FC Barcelona and UFC driving utility. High circulating supply (9.1 billion out of 8.8 billion total—post-burns) caps upside, but historical pumps (3,500% in 2021) highlight altseason potential if crypto rallies post-rate cuts.
#### Overall Chart Structure and Technical Setup
On daily/weekly charts (CHZ/USDT), GETTEX:CHZ has broken a downward trendline from summer highs, ending the corrective phase and forming a bullish pennant breakout. Volume is rising with bullish candles dominating near lows, suggesting accumulation. Indicators: RSI (14) at 45-50 (neutral, poised for bullish cross), MACD showing early divergence, and EMAs aligning bullishly above 50/100-day. Weekly reversal candle supports ending the 1,000+ day bear cycle.
#### Bullish Scenario
A hold above key support could spark a multi-wave rally on altcoin momentum or platform news (e.g., new fan tokens). Outlook:
1. **Short-Term Breakout (1-4 Weeks):** Consolidate at $0.038-$0.040, break $0.045 (EMA200) for 15-25% gains to $0.046-$0.048. Confirm with RSI >60 and volume spike.
2. **Medium-Term Rally (1-3 Months):** Clear $0.05 (major resistance) accelerates to $0.06-$0.08, a 50-100% move, mirroring 2021 patterns.
3. **Long-Term Bullish Wave (2025 Outlook):** Break $0.10 confirms full reversal, targeting $0.106 (conservative) or $0.63 in altseason—up 1,500%+. Optimistic end-2025 forecasts hit $0.042-$0.10, with risks from macro dips.
#### Key Levels to Watch
- **Support Levels:**
- Immediate: $0.0376 (24h low) – Key hold for invalidation.
- Major: $0.038-$0.040 – Demand zone; break risks $0.03 retest.
- **Resistance Levels:**
- Near-Term: $0.045 – EMA cluster; breakout ignites pump.
- Intermediate: $0.05 – Psychological/former support; clear for $0.06.
- Long-Term: $0.10 – Bull resumption trigger.
#### Risks and Considerations
Bullish if support holds, but high-risk from low liquidity and market volatility. Watch volume >20% average and news. Tight stops below support; scale on dips. Not financial advice—DYOR and manage risk.

See if we can break above 0.04364-0.04630
Hello, fellow traders!
Follow us to get the latest updates quickly.
Have a great day!
-------------------------------------
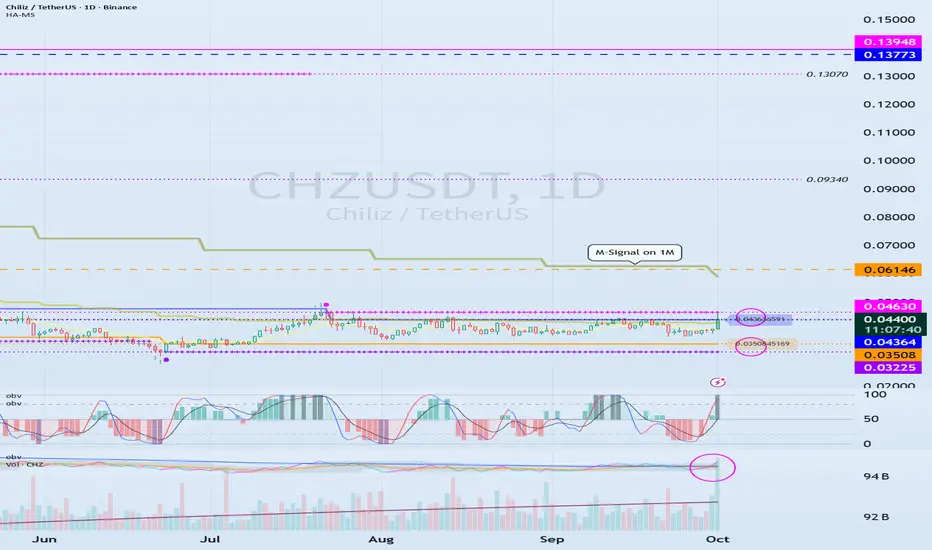
(CHZUSDT 1D chart)
The OBV indicator is showing an upward break above the EMA 2 indicator.
If the price rises above the 0.04364-0.04630 range, it is expected to continue its upward trend.
However, since the price is below the M-Signal indicator on the 1M chart, a quick and quick response is required when trading.
Therefore, if possible, it is recommended to confirm that the price rises above the M-Signal indicator on the 1M chart, providing support, before trading.
-
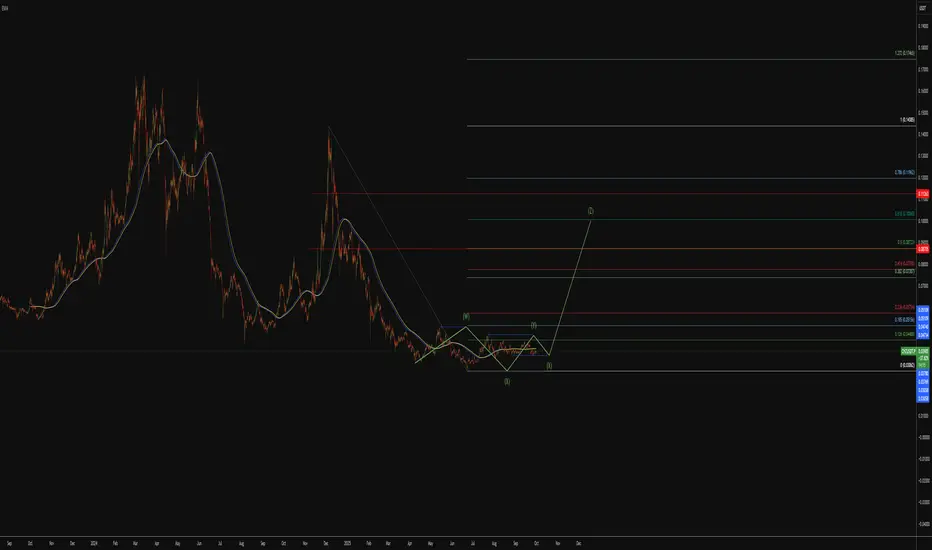
(1M chart)
If the price rises above the M-Signal indicator on the 1M chart, it is highly likely that the price will attempt to rise to around 0.20790.
------------------------------------------
Considering the above, for medium- to long-term investment, it is recommended to buy when the price rises above the 0.04364-0.04630 range, providing support.
If you're looking to make a short-term investment, it's best to buy when the price rises above the M-Signal indicator on the 1M chart and shows signs of support.
Buying at a low price doesn't always lead to profits.
This is because some investors may not be able to wait for the price to rise and may give up midway.
Therefore, you should calmly consider your investment horizon for the altcoin you're currently considering.
Your investment size and trading strategy will vary depending on your investment horizon.
-
Thank you for reading to the end.
I wish you successful trading.
--------------------------------------------------
CHZUDT UPDATE#CHZ
UPDATE
CHZ Technical Setup
Pattern: Bullish falling wedge breakout
Current Price: $0.0433
Target Price: $0.0607
Target % Gain: 40.78%
CHZ is breaking out of a falling wedge pattern on the 1D timeframe. The breakout highlights bullish momentum with a target near $0.0607, offering over 40% potential upside. Structure supports continuation if momentum sustains. Always use proper risk management.

#CHZ/USDT Reversal Potential Breakout & Fibonacci Retest in Fo#CHZ
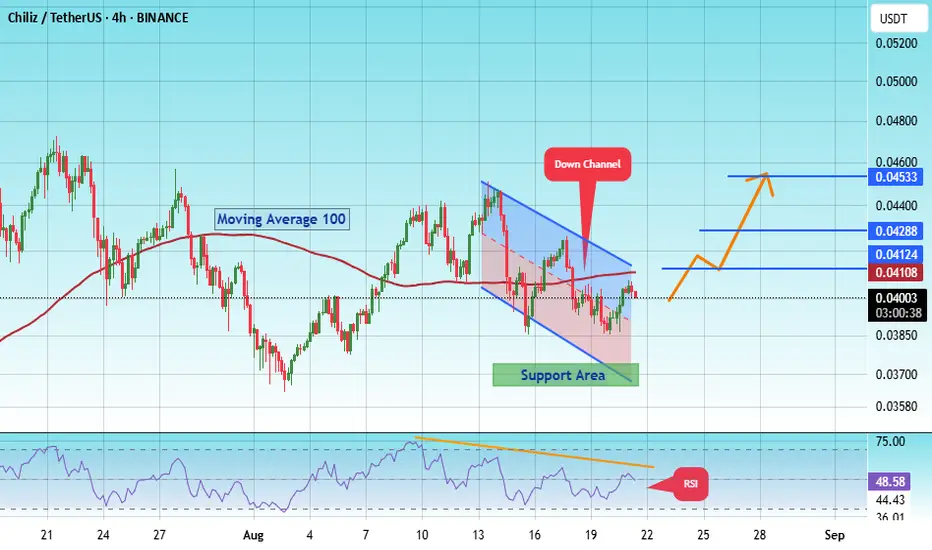
The price is moving within a descending channel on the 1-hour frame, adhering well to it, and is heading for a strong breakout and retest.
We have a bearish trend on the RSI indicator that is about to be broken and retested, supporting the upside.
There is a major support area (in green) at 0.03700, which represents a strong basis for the upside.
For inquiries, please leave a comment.
We are in a consolidation trend above the 100 moving average.
Entry price: 0.4000
First target: 0.04108
Second target: 0.04288
Third target: 0.04533
Don't forget a simple matter: capital management.
When you reach the first target, save some money and then change your stop-loss order to an entry order.
For inquiries, please leave a comment.
Thank you.
CHZ/USDT ; BUY MARKET!!!Hello friends
Given the good growth we had, the price has entered a correction phase and is in the specified support area that I determined, the price is supported and if the price continues to be supported, we can see the specified targets.
*Trade safely with us*

Long trade
1Hr TF overview
Trade Journal Entry — CHZUSDT Perp (1H)
Trade type: Buyside
Date/Session on chart: Fri 26 Sep ’25, ~9:00 AM (LDN→NY overlap)
Trade details (from your bubble)
Entry: 0.03859
TP: 0.04372 (+13.29%)
SL: 0.03787 (-1.87%)
R:R: 7.13
Technical Narrative -Buyside bias
Context: Multi-week range; recent liquidity sweep of prior lows → sharp reclaim.
Structure: BOS up from the sweep; price accepted back above the MA stack; multiple FVGs overhead acting as magnets.
Setup: Long from demand after sweep/mitigation; TP1 aligned near prior 1H swing and the top of the grey supply/FVG band.

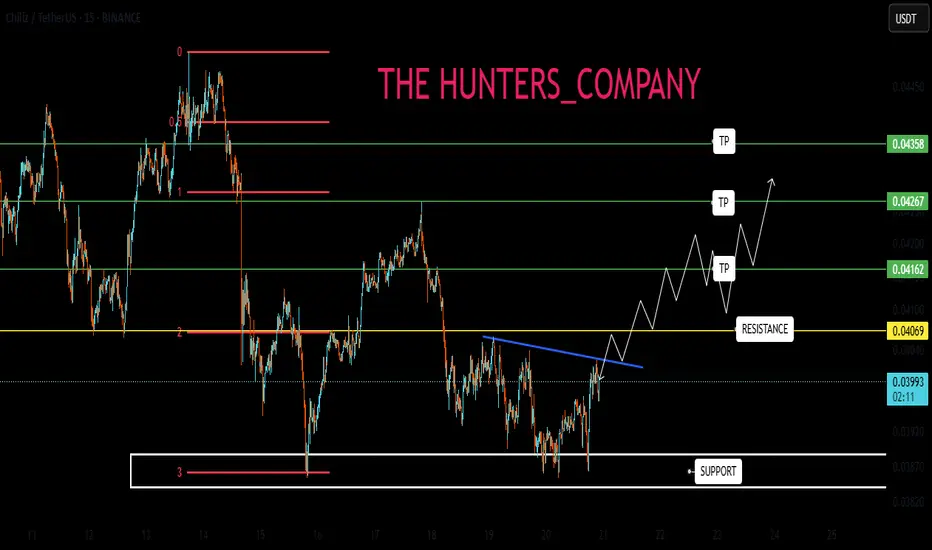
CHZ🔍 Technical Analysis
Pattern – Symmetrical Triangle
Price has been consolidating inside a symmetrical triangle (blue trendlines).
These triangles usually indicate a continuation pattern, but since CHZ was in a sideways-to-down trend before, breakout direction is crucial.
Breakout
The latest candle has broken out above the upper trendline with good bullish momentum.
Volume is higher than previous sessions → confirming breakout strength.
Moving Averages
Short-term MA (orange) and longer-term MA (purple) are flat but now starting to curve upward.
Price has closed above both MAs, strengthening bullish sentiment.
Support & Resistance
Immediate support: ~0.041 USDT (former triangle resistance, now turned into support).
First resistance: ~0.0445 – 0.045 USDT (recent swing highs).
Next resistance: ~0.048 – 0.050 USDT (psychological level).
Volume
A clear increase in volume during breakout, which is key for validation.
📈 Scenarios
Bullish Case (likely):
If price sustains above 0.041 USDT, breakout could push CHZ toward 0.045 and possibly 0.048 – 0.050 in the short term.
Bearish Case (risk):
If price falls back below 0.041, the breakout may turn into a fakeout, sending price back into the triangle (bearish).

[Scalp] SELL CHZSELL BINANCE:CHZUSDT
En: 0.04087
Sl: 0.04149
Tp: 0.03816
Confirmation entry bias!
⚠️ If price hit target before filling entry!.
We cancel trade!

Chiliz Consolidates at Value Area Low, Eyes Bullish Expansion Chiliz (CHZ) is trading within a weekly equilibrium between $0.33 and $0.48. Holding this support region could spark a bullish expansion toward the 0.618 Fibonacci and beyond.
Chiliz has entered a consolidation phase, with price trading between key high timeframe support levels. The range between $0.33 and $0.48 has become a critical zone of equilibrium, where accumulation is taking place at the value area low. From a technical standpoint, this structure lays the groundwork for a potential bullish expansion if support continues to hold.
Chiliz (CHZ) Key Technical Points
- Support Between $0.33 and $0.48: Weekly equilibrium forming at the value area low.
- Bullish Expansion Potential: Reclaiming the point of control opens path to 0.618 Fibonacci.
- Next Resistance at $0.13: Weekly resistance level that could spark a breakout-driven rally.
CHZ has been consolidating at a high timeframe support region that stretches between $0.33 and $0.48. This consolidation reflects accumulation, as buyers are absorbing sell-side pressure at the lower end of the range. Holding this zone on a closing basis, particularly on the weekly timeframe, is critical for maintaining bullish prospects.
The significance of this accumulation becomes clearer when paired with the point of control (POC). If CHZ reclaims this zone, it signals a shift in balance toward buyers, opening the door to a full rotation higher. Market auction theory suggests that once the value area low is respected, price naturally gravitates toward the value area high, especially if volume influxes begin to support the move.
From a Fibonacci perspective, the 0.618 retracement becomes the next major technical checkpoint. A bullish expansion into this level would align with the reclaim of structural levels, suggesting a continuation phase could unfold. Historically, CHZ has exhibited strong impulsive moves following prolonged accumulation phases, and the current structure bears similarity to prior setups.
The $0.13 region, marked as the next weekly resistance, stands as the critical upside objective in the near term. A decisive breakout above this level would confirm that the accumulation has transitioned into expansion. Such a move could replicate the kind of rapid upside rallies CHZ has seen in past cycles.
What to Expect in the Coming Price Action
If Chiliz continues to respect the $0.33–$0.48 support range, traders can expect a bullish rotation toward the 0.618 Fibonacci retracement and potentially higher. A reclaim of the point of control will confirm momentum, while clearing $0.13 resistance could ignite a strong expansion rally similar to previous historical breakouts.

Possible Bullish RunIf trend line breaks our resistance, we have a clear bullish run. Chart indicators also provide a bull run on CHZUSDT. A maximum of 10% profit is expected.

CHZ : BUY OR SELL? Hello friends
According to the price drop, you can see that the price is in the support area specified by the buyers. The specified support is also specified with Fibonacci, which is from our own strategy.
Now, if the support is held and the specified resistance is broken, the price can move to the specified targets. Don't forget risk and capital management.
*Trade safely with us*
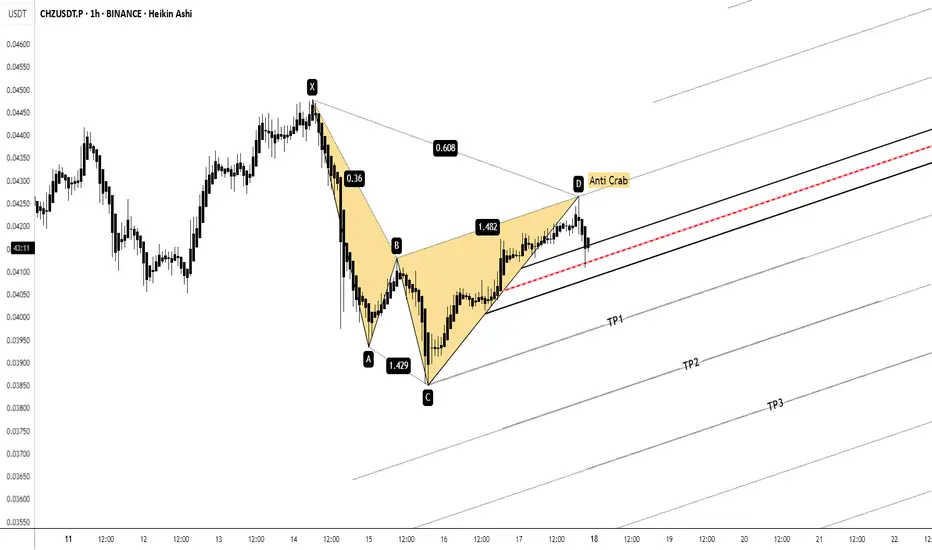
CHZUSDT.P | 1H Short ThermI’m taking a short position on CHZUSDT.P (1H) based on an Anti Crab harmonic pattern that completed at point D.
🔎 Confluences:
– Anti Crab harmonic completion at resistance
– TDG momentum indicator flipped bearish (Sell mode)
– Structure aligned with median line channel (Pulsefork)
📉 Plan:
– Entry: Point D rejection
– Targets: TP1 → TP2 → TP3 (scaling out)
– Stop: Above X to protect capital
I’m sharing this setup for discussion — not financial advice.
Curious: do you also combine harmonic patterns with custom momentum tools like TDG, or do you rely purely on price action?

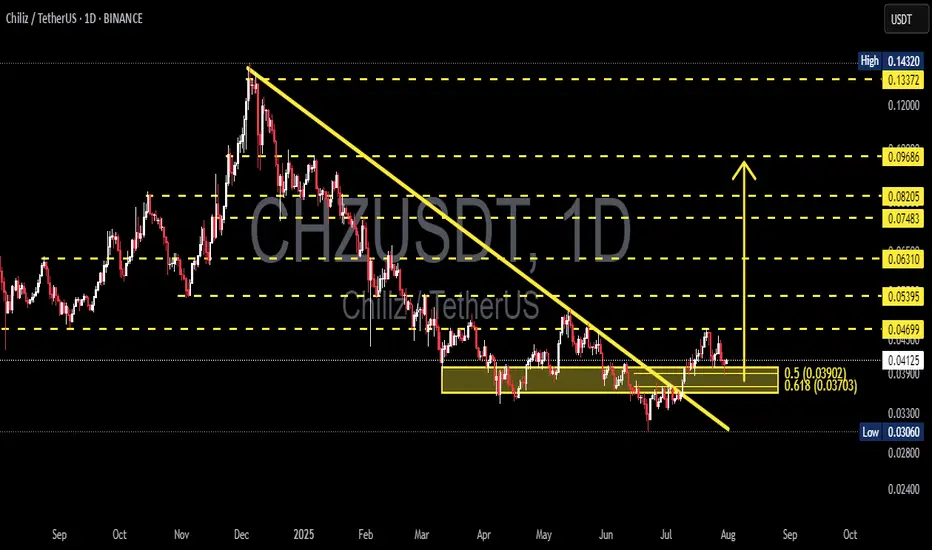
CHZUSDT Reversal Potential Breakout & Fibonacci Retest in FocusChart Analysis:
The CHZ/USDT pair on the 1D timeframe has successfully broken out of a long-term descending trendline, which had been acting as resistance since December 2024. The breakout occurred with a strong bullish candle, suggesting a potential trend reversal.
Currently, the price is performing a retest of the breakout zone, which aligns perfectly with the Fibonacci retracement levels:
0.5 at $0.03902
0.618 at $0.03703
This confluence zone is critical as it may serve as a base for a continued bullish move.
---
Pattern Identified:
Descending Triangle Breakout → Signaling the end of a distribution phase and the potential start of accumulation.
Bullish Retest Zone → Price is testing the previous resistance turned support + Fibonacci confluence.
---
Bullish Scenario:
✅ If price holds above the $0.037–$0.039 support area and forms a bullish rejection candle, potential upside targets include:
$0.04699 (minor resistance)
$0.05395
$0.06310
$0.07483
Up to psychological resistance at $0.09686
---
Bearish Scenario:
❌ If price breaks below the $0.03703 level, further downside could be seen toward:
$0.03306 (local support)
And possibly the recent low at $0.03060
However, as long as the price stays above the 0.618 Fibonacci, the bias remains bullish.
---
Conclusion:
CHZ/USDT is at a critical decision point. A successful retest of the breakout zone combined with Fibonacci support could provide a strong accumulation opportunity for buyers. Watch closely for bullish confirmation candles in the yellow zone before entering.
#CHZ #CHZUSDT #CryptoBreakout #FibonacciLevels #TechnicalAnalysis #AltcoinWatch #TrendReversal #CryptoTrading #TradingViewAnalysis
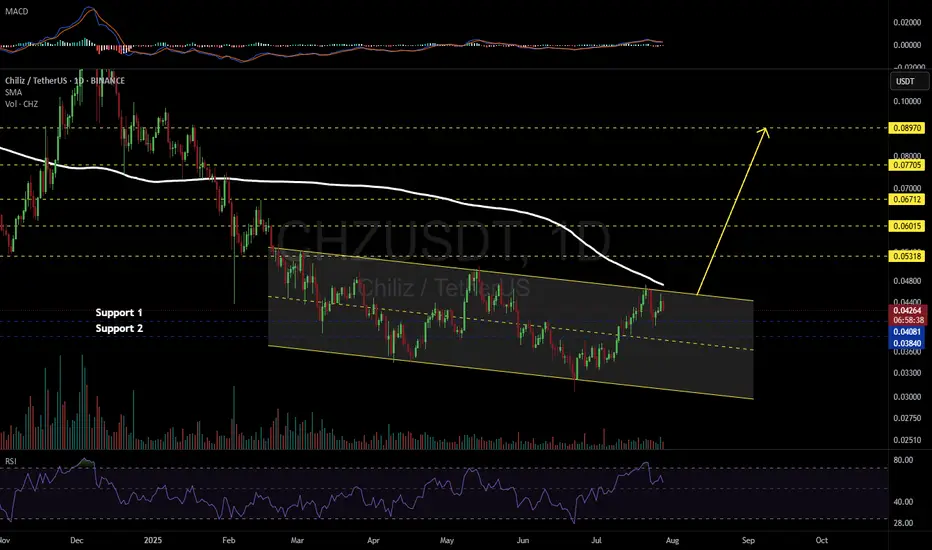
CHZUSDT 1D#CHZ is moving inside a descending channel on the daily chart. Consider buying near the support levels at $0.04081 and $0.03840.
In case of a breakout above the channel resistance — and more importantly, a break above the daily SMA200 — the potential upside targets are:
🎯 $0.05318
🎯 $0.06015
🎯 $0.06712
🎯 $0.07705
🎯 $0.08970
⚠️ As always, use a tight stop-loss and apply proper risk management.
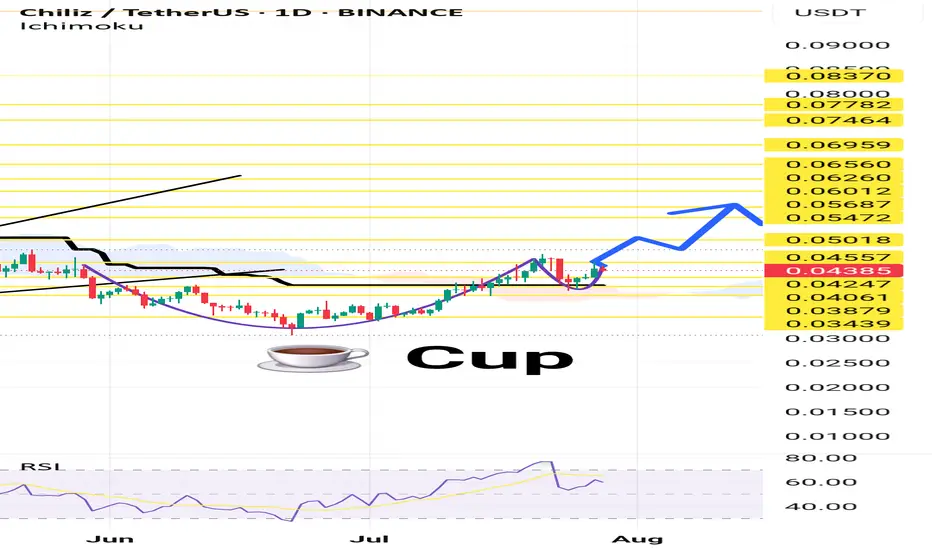
ChilzusdtHello Snipers. On the one-day timeframe, we are witnessing the formation of the Cup pattern or the Cup and Handle pattern, a chart pattern in technical analysis that appears in the form of a cup with a handle on the price chart and is usually considered as a bullish continuation pattern. This pattern indicates a period of price consolidation that forms after an upward trend and is likely to continue its upward trend.
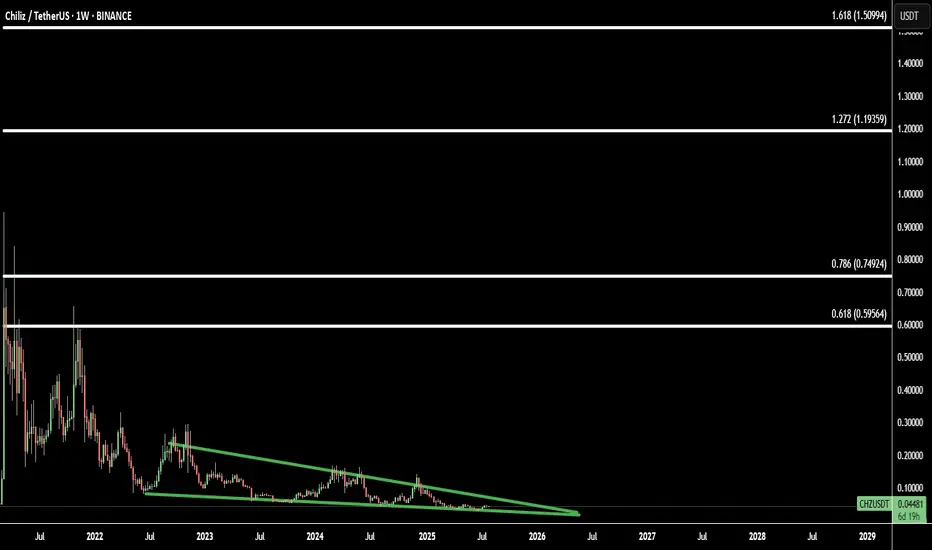
Missed the Altseason Start? CHZ/USDT Is the Opportunity You NeedMany traders feel they’ve missed the start of the altseason, but CHZ/USDT is offering a second chance.
On the weekly timeframe, CHZ is breaking out of a long-term falling wedge pattern — a classic bullish reversal structure that often precedes explosive moves.
Combining this with Fibonacci extensions, we identify 4 major upside targets:
Target 1: 0.618 Fib - 0.59 – initial breakout confirmation
Target 2: 0.786 Fib - 0.74 – mid-term resistance level
Target 3: 1.272 Fib – 1.19 - extended bullish leg
Target 4: 1.618 Fib – 1.50 - full potential of the wedge breakout
CHZ is currently undervalued and positioned near its bottom, making it one of the best risk/reward plays in the current market for those who still want exposure to the altseason wave.
CHZ (Chiliz) Analysis – July 15, 2025 Since breaking above the $0.03 level back in 2021,
CHZ surged to nearly $0.80, recording an impressive 3,500% gain.
🧠 This move indicates that major investors entered at lower levels,
while short-term holders who bought higher have been taking profits on every price rally,
effectively capping further upside momentum in the past.
Now, after 4 years, the price has returned to the $0.03 zone — a historically significant area that marked the start of the previous bull run.
🎯 A minimum 100% upside from this level is quite reasonable,
targeting around $0.08 in the short to medium term.
✅ For more impatient investors seeking faster exits,
$0.05 can be considered an optimal short-term take-profit level.

Chiliz Hitz Bottom · Opportunity Buy Zone (PP: 3,535%)Chiliz is trading at a true bottom right now after producing the lowest price in more than three years. The lowest since February 2021. No need to worry though, an early recovery is already happening and we are sure the bottom is in.
The past three weeks have been green while CHZUSDT managed to close above EMA8. This means that the trend is changing or is about to change and we know it will change because we are right in front of the 2025 altcoins bull market. Chiliz will not stay behind, it will also grow. We don't know how strong but there is plenty of room for rising prices. You will be surprised by what the market does.
What the market does is to condition you in some way. First, you become conditioned to seeing higher prices, unlimited potential and that's the start of the bear market, long-term a downturn. But this isn't the end.
When you are conditioned to seeing the market go down, more down; down, down, down, forever more, then it changes suddenly, as if by surprise and prices start to grow. The growth feels strange because it is something not seen in a while and we wonder, will it last? I don't know.
That's the first answer if you don't have access to years of data and this amazing chart.
Seeing the chart long-term coupled with marketwide action and what Bitcoin does, yes, the market growth will last a long time because an uptrend means higher highs and higher lows.
Right now we are looking at the best possible entry prices, an opportunity buy-zone. Buying now can result in incredible gains in the coming months.
Thanks a lot for your continued support.
Namaste.

CHZChiliz
Chiliz is the world’s leading blockchain fintech provider for sports & entertainment.
Everything is clear on the chart.
I wish everyone abundant profits.
Like and follow
for more.
