Nifty Short term (06.11.2025 to 11.11.2025/14.11.2025) viewNifty has completed its internal wave b of major wave B @25520 and heading towards internal wave c of major wave B.
I’ll be watching for the market to sustain above 25741 atleast 15 min. for a target of 25877-25924 with a SL of 25520 (SL on 15 min. candle close).
Disclaimer: Sharing my personal market view — only for educational purpose not financial advice.
Trade ideas

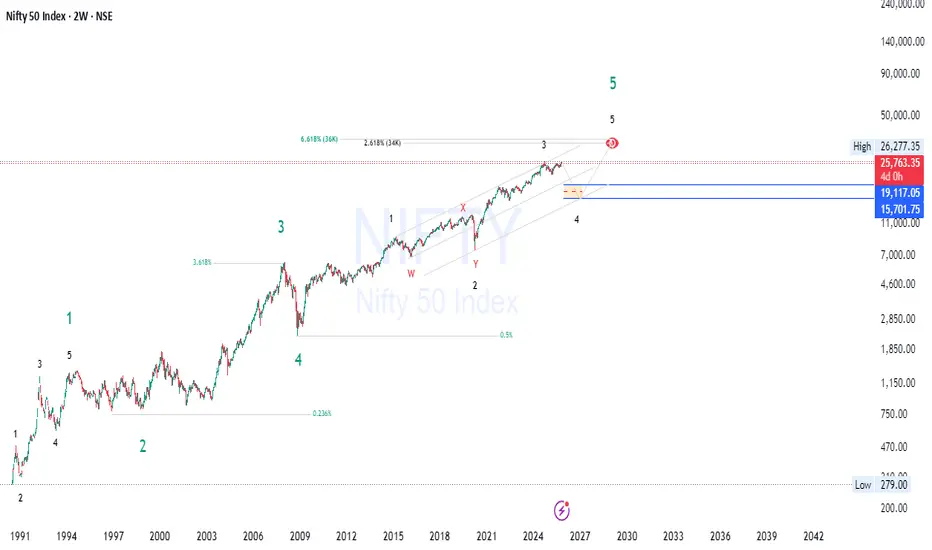
NIFTY Wave 3 Exhausted? — Wave 4 Short Setup Loading🔥 NIFTY 50 – Supercycle Wave 5 Exhaustion! Short Setup Loading ⚠️📉 🔥
Hey traders 👋 — NIFTY looks like it’s entering the most critical phase of its multi-decade Elliott Wave structure . The chart is screaming exhaustion — and all the technical confluences are lining up for a macro short setup before the final leg of this supercycle. Let’s break it down 👇
🌊 Elliott Wave Structure – The Supercycle Story Unfolding
We’ve been in a massive 5-wave supercycle since the early 1990s, and we’re now deep inside Wave (5) — the last impulsive leg of this cycle.
Here’s the roadmap so far:
🟢 Wave 1: Topped in 1994
🔵 Wave 2: Bottomed in 1998
🟢 Wave 3: Ended in 2007 (the euphoric pre-crash top)
🔵 Wave 4: Bottomed in 2008
🟢 Wave 5: Currently unfolding with 5 macro waves
Inside Wave 5:
Wave 1 topped in 2015
Wave 2 corrected into 2020 (W–X–Y structure)
Wave 3 topped in 2024 — the strongest impulsive phase
Wave 4 correction is now developing and expected to run until 2026
Wave 5 to top around 2029 near 34K–36K (2.618 Fib)
But here’s the key 👇
We’re at the end of Wave 3 of 5 , and Wave 4 is just starting — meaning a significant correction is due .
⚙️ Fibonacci & Price Confluence
Wave 3 extended powerfully, testing the 2.618 Fib zone , with heavy confluence near 26K–27K — a perfect resistance band.
From here:
0.236 retracement target (minor correction): ~₹19,100
0.382 retracement (major correction): ~₹15,700
That gives us a short setup zone from 26K–27K , with targets between 19K–15.7K over the next 12–18 months 📉
💰 Smart Money Concepts (SMC) – Distribution Confirmed
SMC structure is showing clear distribution behavior at the highs:
Liquidity sweeps above equal highs near 26K
Signs of Change of Character (CHoCH) on lower timeframes
Weak reaction from demand zones → sellers stepping in
Premium-to-discount shift beginning
Institutions are distributing , not accumulating.
Once 24K–23.8K breaks, we’ll have full confirmation of bearish displacement and macro BOS (Break of Structure) — validating the short thesis.
🧱 Market Structure & Price Action
The uptrend is losing momentum; price is grinding instead of impulsing.
A rising wedge / ending diagonal pattern is visible — classic Wave 5 exhaustion signal.
Momentum divergences on weekly RSI and MACD confirm weakening internal strength.
A confirmed break below 24K will open clean liquidity voids toward 19K, then 15.7K.
🧭 Market Cycle & Sentiment
We’re in the Euphoria → Distribution transition — the same emotional shift seen before major corrections:
Retail believes “the market always goes up,” while Smart Money quietly exits.
Once the correction gains traction, expect sentiment to swing toward Complacency and Anxiety , setting up the bottom of Wave 4 around 2026.
🧮 Fundamentals Aligning with Technicals
Valuations remain stretched — NIFTY’s P/E above long-term averages.
Global risk factors (rates, oil, geopolitics) are aligning for a liquidity squeeze .
Earnings momentum is flattening; price has outpaced fundamentals.
All these align perfectly with a macro corrective phase (Wave 4).
⚡ Short Setup Plan (Swing / Positional Idea)
📍 Zone of Interest: 26K–27K (Fibonacci extension + structural resistance)
📍 Confirmation Trigger: Breakdown below 24K (CHoCH + BOS confirmation)
📍 Targets:
TP1 → ₹19,100 (Fib 0.236 + demand zone)
TP2 → ₹15,700 (Fib 0.382 + structural low)
📍 Invalidation: Sustained breakout above 27K with volume (would imply Wave 3 still extending).
🧨 Summary – Short Setup View
🟥 Wave 5’s internal Wave 3 likely topped at 26K–27K
🟧 Smart Money distributing at premium
🟨 Rising wedge + divergence confirming exhaustion
🟩 Breakdown below 24K = Wave 4 confirmed
🟢 Short targets: 19K → 15.7K
💬 Final Thoughts:
NIFTY’s long-term trend is still intact — but short-term, this is a golden short setup inside a major Wave 4 correction . The correction could last well into 2026 before the final euphoric push to 34K–36K by 2029.
Patience + confirmation = profit 💯
👇 What do you think — has Wave 4 already begun, or will we see one last liquidity sweep above 26K?
#Nifty50 #ElliottWave #SmartMoneyConcepts #Wave4 #ShortSetup #MarketStructure #TechnicalAnalysis #TradingView
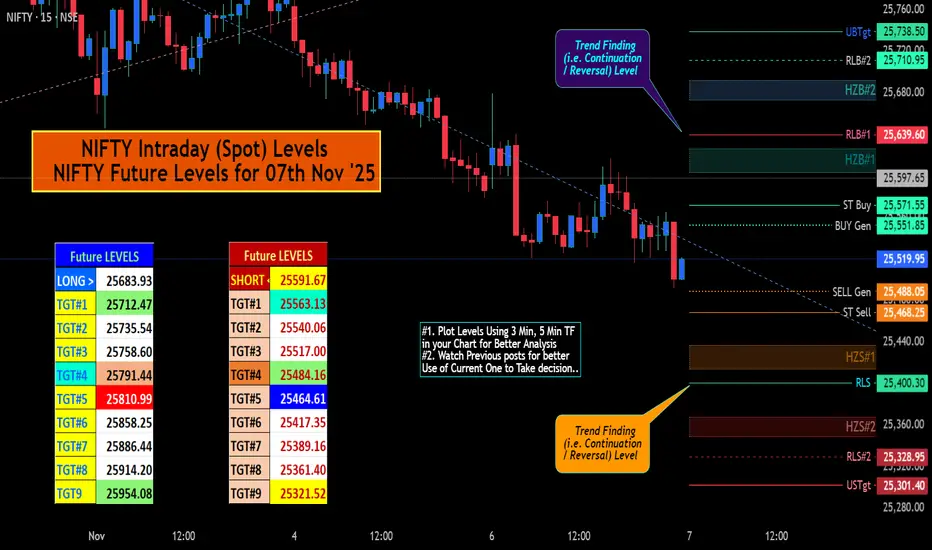
NIFTY IntraSwing (Spot) & Future Levels for 07th Nov '25✍🏼️ "Future IntraSwing Levels" mentioned in BOX format.
✍🏼️ "WEEKLY Levels" follow Sunday / Saturday's Post.
L#1: If the candle crossed & stays above the “Buy Gen”, it is treated / considered as Bullish bias.
L#2: Possibility / Probability of REVERSAL near RLB#1 & UBTgt
L#3: If the candle stays above “Sell Gen” but below “Buy Gen”, it is treated / considered as Sidewise. Aggressive Traders can take Long position near “Sell Gen” either retesting or crossed from Below & vice-versa i.e. can take Short position near “Buy Gen” either retesting or crossed downward from Above.
L#4: If the candle crossed & stays below the “Sell Gen”, it is treated / considered a Bearish bias.
L#5: Possibility / Probability of REVERSAL near RLS#1 & USTgt
HZB (Buy side) & HZS (Sell side) => Hurdle Zone,
*** Specialty of “HZB#1, HZB#2 HZS#1 & HZS#2” is Sidewise (behaviour in Nature)
Rest Plotted and Mentioned on Chart
Color code Used:
Green =. Positive bias.
Red =. Negative bias.
RED in Between Green means Trend Finder / Momentum Change
/ CYCLE Change and Vice Versa.
Notice One thing: HOW LEVELS are Working.
Use any Momentum Indicator / Oscillator or as you "USED to" to Take entry.
⚠️ DISCLAIMER:
The information, views, and ideas shared here are purely for educational and informational purposes only. They are not intended as investment advice or a recommendation to buy, sell, or hold any financial instruments. I am not a SEBI-registered financial adviser.
Trading and investing in the stock market involves risk, and you should do your own research and analysis. You are solely responsible for any decisions made based on this research.
"As HARD EARNED MONEY IS YOUR's, So DECISION SHOULD HAVE TO BE YOUR's".
Do comment if Helpful .
In depth Analysis will be added later (If time Permits)
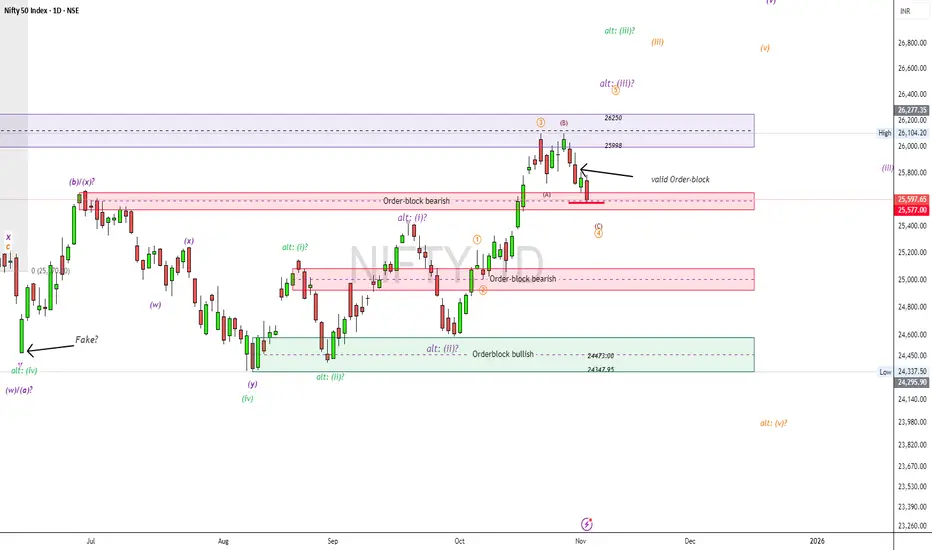
DIAGONAL FORM HAS BEEN ESTABLISHED & HENCE THE BELOW OBSERVATThe study is based on Diagonal Pattern and as well as SMC Concepts ...
I expect that the Market will Turn around Wave-C meeting Equality Criteria... viz., Depth of Wave-C Equals, Wave-A

NIFTY50.....Support-area achieved?Hello Traders,
the NIFTY50 closed the week with a loss of 229 points, or -0.89%!
My first called out target area was touched, but after it was undervalued.
We got two lower lows and the index stopped at an area where the bulls probably took control of the market. It closed a small open gap, left by trading on October15-16th!
At the 3h chart, you can see, how a Fair-value-gap has been touched and the price change its direction to the upside. This probably could be all of the correction.
If so, the marked has a chance to advance to the area around 25787-25847. This target range should be achieved in the coming 2–3 days.
Keep in mind, that more bullish potential is at hand,
On the other side, the door is open to decline several hundreds of points to the next area around 25088-24930 range.
Here, two, more bearish potential is possible.
So friends, the levels got set, and you are well-prepared for the coming week.
Take care and have a great week.....
Ruebennase
Please ask or comment as appropriate.
Trade on this analysis at your own risk.

Nifty Analysis for Nov 06, 2025Wrap-up:
Nifty has completed its wave b of internal wave 4 @25578.
Note:- Internal wave 3 is not extended. Therefore, internal wave 5 becomes extended wave.
What I’m Watching for Nov 06, 2025 🔍
I’ll be watching for the market to retrace upto 25694-25722 for completion of internal wave 4 of major wave 3. Thereafter, Nifty will head towards its target for internal wave 5 for a target of 25415-25242 with a SL of 25803 (SL on 15 min. candle close).
Disclaimer: Sharing my personal market view — only for educational purpose not financial advice.

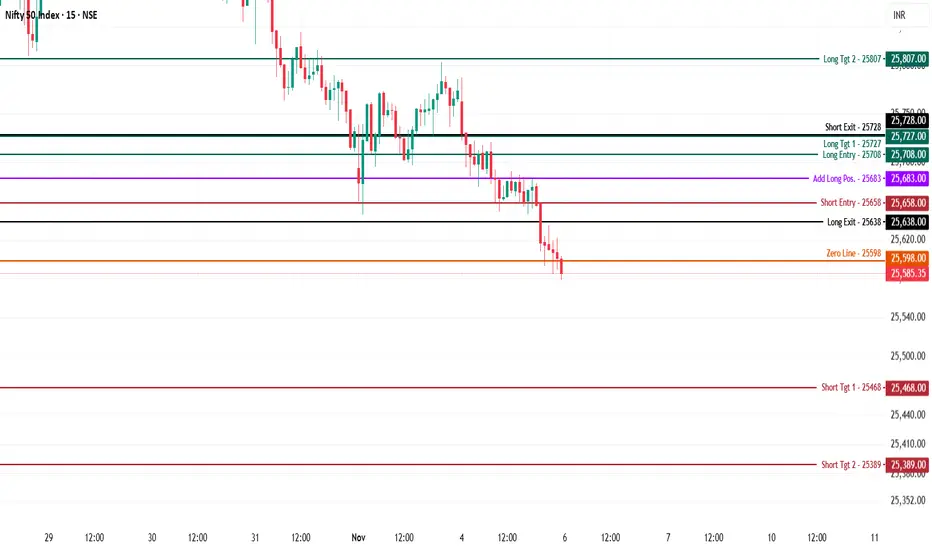
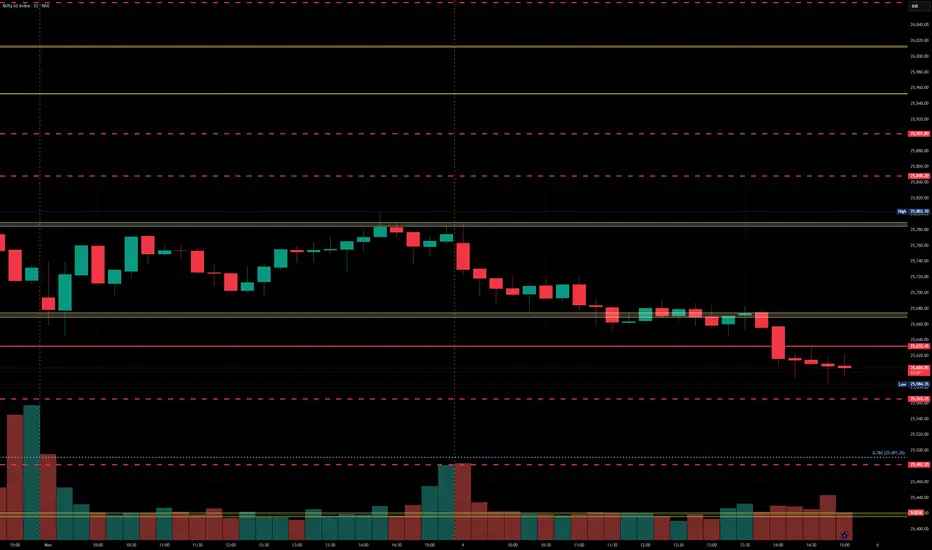
Nifty 50 Index - Intraday Technical Chart Analysis - 5th Nov.NSE:NIFTY
Nifty is under pressure, trading at 25,585 after a consistent intraday slide, breaking down below the zero line at 25,598. Momentum remains weak as price continues to create lower lows, putting the short side in clear focus for today's session.
Bearish Structure:
Short bias is active below 25,658, with sellers reinforced by the inability to sustain above key resistances at add long (25,683) and long entry (25,708).
Downside Targets:
25,468: First level for partial short profit-taking or scalping.
25,389: Major extension target if weakness persists and selling escalates.
Risk Management: Shorts are best trailed/covered if price attempts a sharp reversal above the zero line or the upper entry clusters.
Bullish Structure:
Bullish setups open only above 25,708, with sustained closes needed through 25,727 to flip bias for a relief move.
Upside Targets:
25,807: First area for trend reversal booking or quick trades.
Risk Management: Fresh longs should be protected with stops near the add long zone (25,683) or just below the zero line (25,598) if upside momentum falters.
Neutral/Range Read:
With the 25,598 zero line now acting as resistance, expect choppiness or a potential dead cat bounce if price attempts to reclaim above this zone before establishing the next clear trend.
Use these mapped levels for decision clarity, scalable entries, and proper risk controls in your day plan. If Chart Pathik's insights sharpen your edge, boost, comment, and share — your engagement builds a disciplined trading community.
Follow for transparent pivots, methodical updates, and a learning-first approach, every single session.
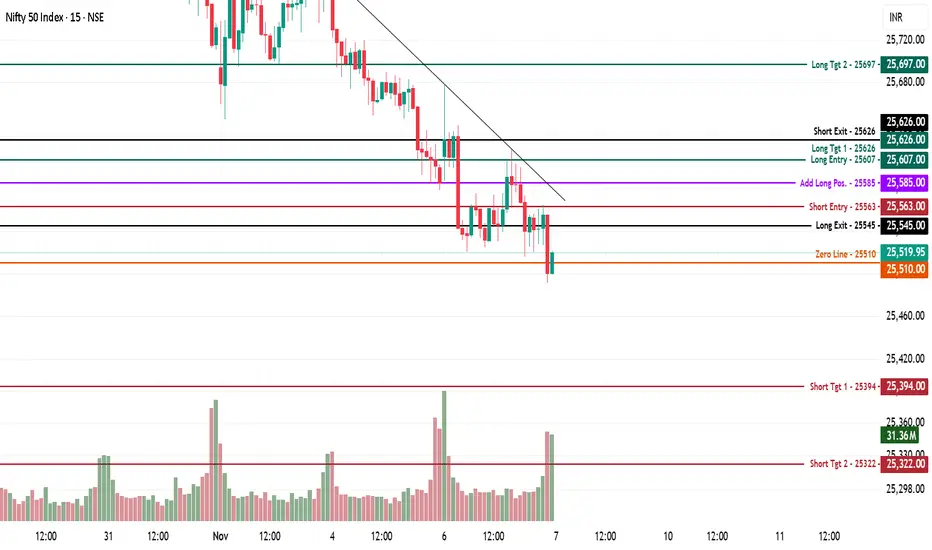
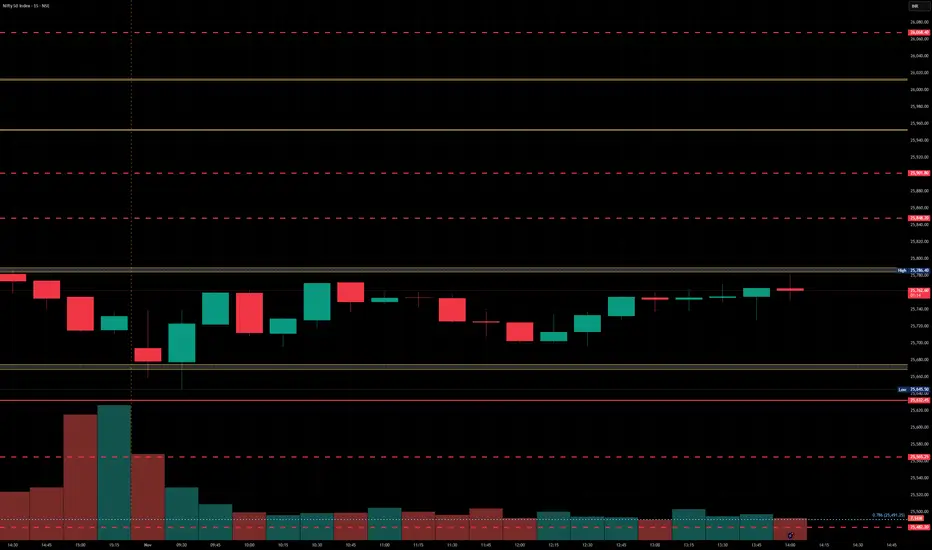
Nifty50 Index - Intraday Technical Analysis for 7th Nov., 2025NSE:NIFTY 50 Index — Chart Pathik Insights | 7-Nov-25
Nifty 50 is trading at 25,519 after another volatile open, with price sitting just above the zero line (25,510) and failing to sustain rallies into upper pivots. Downside pressure remains dominant, but intraday traders can capitalize on both quick reversals and momentum swings as mapped targets respond to increased volume.
Bearish Structure:
Short setups remain structurally strong below 25,563, as sellers repeatedly defend the add-long (25,585) and resistances overhead.
Downside Levels:
25,394: Ideal spot for profit booking or partial exits on shorts.
25,322: Deeper extension target if liquidity thins and trend accelerates.
Risk Management: Protect shorts if there is a convincing close above add-long or rapid reversal above 25,585.
Bullish Structure:
Longs only gain traction above 25,607, with proof from strong closes and new rally highs.
Upside Levels:
25,626: First logical booking or congestion zone.
25,697: Full breakout level for risk-tolerant traders.
Risk Management: Work with stops below recent session lows or the zero line, adjusting to current volatility swings.
Neutral/Range Logic:
At 25,510, Nifty is in chop mode—wait for expansion or volume confirmation out of this band before adding serious exposure.
Apply these levels for optimal decision points, smart risk, and fluid trade management. If Chart Pathik’s pivots raise your accuracy, boost, comment, and share to empower disciplined trade culture.
Follow for rigorously mapped logic, timely trade setups, and actionable, market-first learning every session.
NIFTY50.....Target achieved! Next?Hello Traders,
today the NIFTY50 has declined to 25597 on a closing basis. This is a loss of 165 points or 0.64%!
This was inline with my expectation.
What's next for N50?
As to observe at the chart. The N50 has nearly exactly met my target range (marked with the red-line) @25578 and stopped for the moment! He failed only by one point!
This also marked another Order-block that was created on June27!
To keep the idea of a wave IV valid, it is necessarily that the index will change its direction in the coming 1–2 days at latest! A new ATH would be the consequence!
If N50 declines deeper, the targets would be at or around the 25091–24938 levels. In normal times, waves iv does not correct steeper as a 0.5 retracement. On the other hand is the chance given, that we are not moving in a wave iv, moreover we would be in a wave ii?
Well, friends, market will give the answer.
Have a great week.....
Ruebennase
Please ask or comment as appropriate.
Trade on this analysis at your own risk.
ITM Vs OTM- Smart Trading Vs Pure GambleAccording to a SEBI report, trading activity in equity derivatives (especially index options) has exploded in recent years. The average daily premium has been growing at an astonishing 72% CAGR over the last six years. Despite this surge, SEBI’s data also reveals a harsh reality- nearly 91% of retail traders ended up losing money in FY25.
With options becoming every trader’s favorite playground, a basic understanding how they truly work (particularly the popular Out-of-the-Money (OTM) options) has never been much needed than present times.
What are OTM and ITM Options?
In-the-Money (ITM) options and Out-of-the-Money (OTM) options describe how the option’s strike price relates to the current market price of the underlying asset.
➡ ITM
ITM Options already have intrinsic value.
A Call option is ITM when the market price is above its strike price.
A Put option is ITM when the market price is below its strike price.
These options move almost in line with the underlying and are costlier because they have real value even if expired immediately.
➡ OTM
OTM Options have no intrinsic value, only time value.
A Call option is OTM when the market price is below its strike price.
A Put option is OTM when the market price is above its strike price.
They are cheaper but riskier, as they expire worthless unless the market moves strongly in their favor before expiry.
✅ Advantages of ITM Options over OTM Options (Weekly Expiry)
➡ Higher Probability of Profit
ITM options have intrinsic value from the start, so even minor favorable price movements can keep them profitable until expiry. In contrast, OTM options must travel a significant distance just to break even.
➡ Lower Time Decay Risk
Because much of an ITM option’s price is intrinsic value, it doesn’t melt as quickly due to theta. OTM options, being pure time value, lose value sharply as expiry nears- especially in the last two days.
➡ More Stable Pricing
ITM premiums don’t fluctuate wildly with small market changes or volatility swings, making them more predictable and easier to manage intraday.
➡ Better Delta Exposure
ITM options have high delta (0.6–0.9), meaning they move almost in sync with the underlying. This gives the trader cleaner directional exposure without paying the full cost of the underlying.
➡ Suitable for Professional Risk Management
ITM options are often used by institutional and professional traders for hedging or directional exposure, since they behave more linearly and carry less “decay risk.”
❌ Disadvantages of ITM Options over OTM Options (Weekly Expiry)
➡ High Capital Requirement
ITM options are expensive because they include intrinsic value. This limits position size, especially for retail traders with smaller accounts.
➡ Lower Percentage Return
Even though profits are steadier, the percentage return on investment is smaller compared to cheap OTM options that can multiply several times in value during strong moves.
➡ Reduced Leverage
The high premium reduces the leverage advantage that options provide. OTM options offer greater leverage for a given amount of capital.
➡ Limited Benefit from Volatility Spikes
ITM options are less responsive to changes in implied volatility, so traders don’t gain much even if volatility surges before expiry.
➡ Less Attractive for Event-Based Speculation
During events like RBI policy or earnings releases, traders prefer cheap OTM options to play for explosive moves. ITM options are costlier and therefore less appealing for such high-risk bets.
➡ Potential Liquidity Drop in Deep ITMs
Deep ITM options can sometimes be illiquid, leading to wide bid–ask spreads and slippage during exit.
Therefore, weekly options are a double-edged sword. ITMs reward patience and discipline, OTMs reward timing and aggression. A good trader knows that it’s not about choosing sides but about using each wisely in the right market condition.
What is your favorite day trading instrument?
Do you think Index Futures are better than Index Options?
Comment your views.

Wrap-up of Oct 29, 2025Wrap-up :
Nifty has completed its Wave C of internal Wave 2 @26097 i.e. 100% retracement of Simple Zig Zag (abc) Pattern.
What I’m Watching for Oct 30, 2025 🔍
I’ll be watching for the market to break 25987 which is 38% retracement of Wave C and sustain below atleast 15 min. for a target of 25863-25832.
Disclaimer: Sharing my personal market view — only for educational purpose not financial advice.

Nifty Analysis for Nov 04, 2025Wrap-up:
Nifty has completed its internal wave 4 of major wave 3 @25803 and heading towards internal wave 5 of major wave 3.
What I’m Watching for Nov 04, 2025 🔍
I’ll be watching for the market to sustain below 25768 atleast 15 min. for a target of 25565-25418 with a SL of 25835 (SL on 15 min. candle close).
Disclaimer: Sharing my personal market view — only for educational purpose not financial advice.
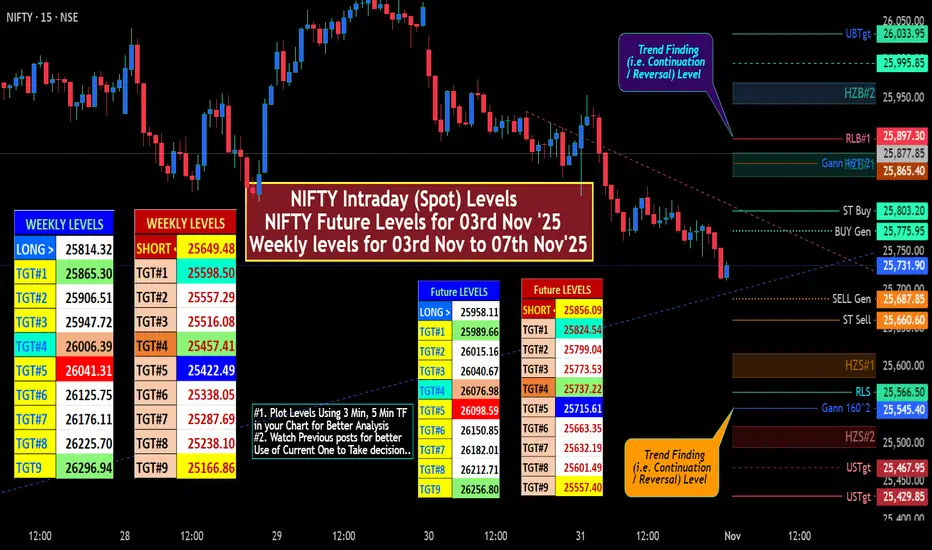
NIFTY IntraSwing (Spot) Futue Levels for 03rd Nov '25✍🏼️ "Future Levels" mentioned in BOX format.
✍🏼️ "WEEKLY Levels" mentioned in BOX format.
🌡️Plot Levels Using 3 Min, 5 Min Time frame in your Chart for Better Analysis
L#1: If the candle crossed & stays above the “Buy Gen”, it is treated / considered as Bullish bias.
L#2: Possibility / Probability of REVERSAL near RLB#1 & UBTgt
L#3: If the candle stays above “Sell Gen” but below “Buy Gen”, it is treated / considered as Sidewise. Aggressive Traders can take Long position near “Sell Gen” either retesting or crossed from Below & vice-versa i.e. can take Short position near “Buy Gen” either retesting or crossed downward from Above.
L#4: If the candle crossed & stays below the “Sell Gen”, it is treated / considered a Bearish bias.
L#5: Possibility / Probability of REVERSAL near RLS#1 & USTgt
HZB (Buy side) & HZS (Sell side) => Hurdle Zone,
*** Specialty of “HZB#1, HZB#2 HZS#1 & HZS#2” is Sidewise (behaviour in Nature)
Rest Plotted and Mentioned on Chart
Color code Used:
Green =. Positive bias.
Red =. Negative bias.
RED in Between Green means Trend Finder / Momentum Change
/ CYCLE Change and Vice Versa.
Notice One thing: HOW LEVELS are Working.
Use any Momentum Indicator / Oscillator or as you "USED to" to Take entry.
⚠️ DISCLAIMER:
The information, views, and ideas shared here are purely for educational and informational purposes only. They are not intended as investment advice or a recommendation to buy, sell, or hold any financial instruments. I am not a SEBI-registered financial adviser.
Trading and investing in the stock market involves risk, and you should do your own research and analysis. You are solely responsible for any decisions made based on this research.
"As HARD EARNED MONEY IS YOUR's, So DECISION SHOULD HAVE TO BE YOUR's".
Do comment if Helpful .
In depth Analysis will be added later (If time Permits) eekly levels for 03rd Nov to 07th Nov'25
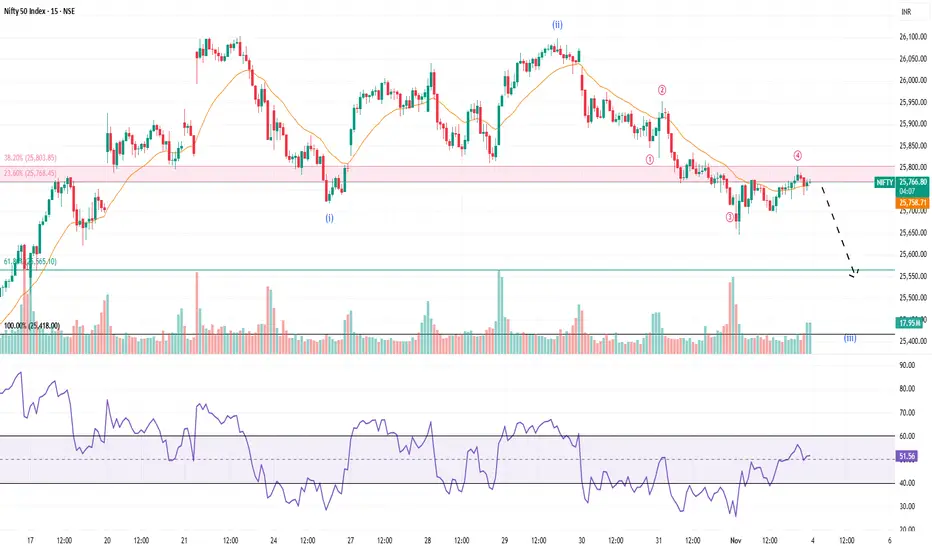
Nifty 50 Index – 4H Technical OutlookAs Nifty in 4h chart recently faced rejection near the 26,000 zone. The price has now reached an important support region around 25,700–25,750, where buyers are attempting to defend the level.
We can also see Nifty has form double top near resistance level and neck line is 25700 buyes are trying to defend that level but ones closing below this can bring nifty to 25450 T1 and then further T2 25000

Nifty levels - Nov 06, 2025Nifty support and resistance levels are valuable tools for making informed trading decisions, specifically when combined with the analysis of 5-minute timeframe candlesticks and VWAP. By closely monitoring these levels and observing the price movements within this timeframe, traders can enhance the accuracy of their entry and exit points. It is important to bear in mind that support and resistance levels are not fixed, and they can change over time as market conditions evolve.
The dashed lines on the chart indicate the reaction levels, serving as additional points of significance to consider. Furthermore, take note of the response at the levels of the High, Low, and Close values from the day prior.
We hope you find this information beneficial in your trading endeavors.
* If you found the idea appealing, kindly tap the Boost icon located below the chart. We encourage you to share your thoughts and comments regarding it.
NIFTY UPDATED VIEWNIFTY tested major support level 25450 and closed above. Immediate support 25300 and resistance 25650, 25800. Chances to bounce from here towards 25650, 25800 or consolidation / sideways until closes below 25300.

Nifty Analysis for Nov 03, 2025Wrap-up:
Nifty has completed its internal wave 2 of major wave 3 and heading towards internal wave 3 of major wave 3. Minimum projection of wave 3 i.e. 100% has been achieved @25711.
What I’m Watching for Nov 03, 2025 🔍
I’ll be watching for the market to continue head towards its second target i.e. 161.80%, 25545-25473 with a SL of 25835 (SL on 15 min. candle close).
Disclaimer: Sharing my personal market view — only for educational purpose not financial advice.

Nifty levels - Nov 07, 2025Nifty support and resistance levels are valuable tools for making informed trading decisions, specifically when combined with the analysis of 5-minute timeframe candlesticks and VWAP. By closely monitoring these levels and observing the price movements within this timeframe, traders can enhance the accuracy of their entry and exit points. It is important to bear in mind that support and resistance levels are not fixed, and they can change over time as market conditions evolve.
The dashed lines on the chart indicate the reaction levels, serving as additional points of significance to consider. Furthermore, take note of the response at the levels of the High, Low, and Close values from the day prior.
We hope you find this information beneficial in your trading endeavors.
* If you found the idea appealing, kindly tap the Boost icon located below the chart. We encourage you to share your thoughts and comments regarding it.

NIFTY50 SUPORT, RESISTANCE & TRENDLINE ANALYSISJust Go as per the levels provided.
Go "SHORT" if it breaks and sustains 25340 with 25265 as PUT side target.
Go "LONG" if it stays above 25340 with 25417 as the first CALL target.
Note: Also check for candle pattern confirmation as well.

nifty 50nifty on consolidation zone trend intact (up) , looks like retracement is important.
on lower side 25600 is good level if break below than final support 25350.
as of now market in buy on dips momentum.

Wolf Wave formation in NiftyPositional View:
Nifty has made wolf wave pattern and 5th wave has been completed. Now, comes under the parallel channel and made breakdown.
Short Nifty below 25645 for a target of 25085-24500 with a SL of 25835 (SL on 15 min. candle close).
Disclaimer: Sharing my personal market view — only for educational purpose not financial advice.

Nifty levels - Nov 04, 2025Nifty support and resistance levels are valuable tools for making informed trading decisions, specifically when combined with the analysis of 5-minute timeframe candlesticks and VWAP. By closely monitoring these levels and observing the price movements within this timeframe, traders can enhance the accuracy of their entry and exit points. It is important to bear in mind that support and resistance levels are not fixed, and they can change over time as market conditions evolve.
The dashed lines on the chart indicate the reaction levels, serving as additional points of significance to consider. Furthermore, take note of the response at the levels of the High, Low, and Close values from the day prior.
We hope you find this information beneficial in your trading endeavors.
* If you found the idea appealing, kindly tap the Boost icon located below the chart. We encourage you to share your thoughts and comments regarding it.
Wishing you success in your trading activities!
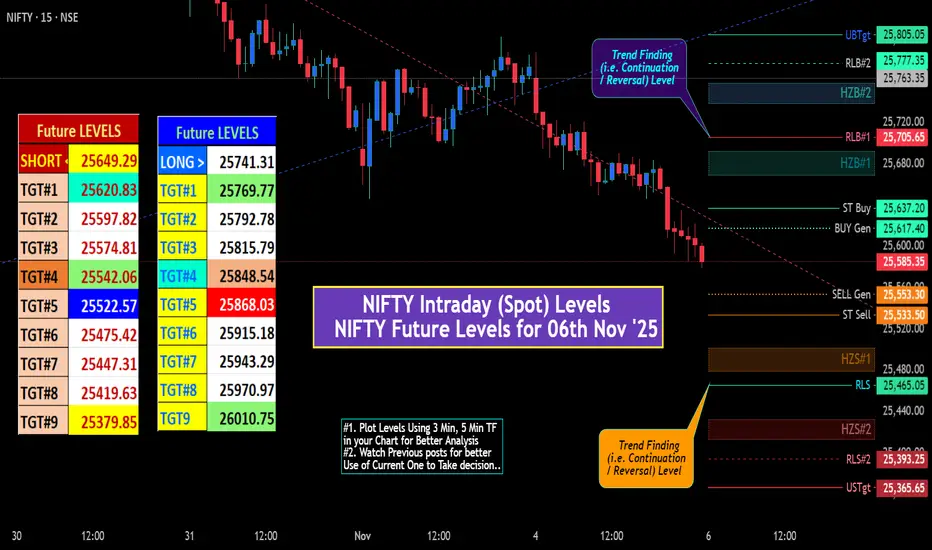
NIFTY IntraSwing (Spot) & Future Levels for 06th Nov 2025✍🏼️ "Future IntraSwing Levels" mentioned in BOX format.
✍🏼️ "WEEKLY Levels" follow Sunday / Saturday's Post.
L#1: If the candle crossed & stays above the “Buy Gen”, it is treated / considered as Bullish bias.
L#2: Possibility / Probability of REVERSAL near RLB#1 & UBTgt
L#3: If the candle stays above “Sell Gen” but below “Buy Gen”, it is treated / considered as Sidewise. Aggressive Traders can take Long position near “Sell Gen” either retesting or crossed from Below & vice-versa i.e. can take Short position near “Buy Gen” either retesting or crossed downward from Above.
L#4: If the candle crossed & stays below the “Sell Gen”, it is treated / considered a Bearish bias.
L#5: Possibility / Probability of REVERSAL near RLS#1 & USTgt
HZB (Buy side) & HZS (Sell side) => Hurdle Zone,
*** Specialty of “HZB#1, HZB#2 HZS#1 & HZS#2” is Sidewise (behaviour in Nature)
Rest Plotted and Mentioned on Chart
Color code Used:
Green =. Positive bias.
Red =. Negative bias.
RED in Between Green means Trend Finder / Momentum Change
/ CYCLE Change and Vice Versa.
Notice One thing: HOW LEVELS are Working.
Use any Momentum Indicator / Oscillator or as you "USED to" to Take entry.
⚠️ DISCLAIMER:
The information, views, and ideas shared here are purely for educational and informational purposes only. They are not intended as investment advice or a recommendation to buy, sell, or hold any financial instruments. I am not a SEBI-registered financial adviser.
Trading and investing in the stock market involves risk, and you should do your own research and analysis. You are solely responsible for any decisions made based on this research.
"As HARD EARNED MONEY IS YOUR's, So DECISION SHOULD HAVE TO BE YOUR's".
Do comment if Helpful .
In depth Analysis will be added later (If time Permits)