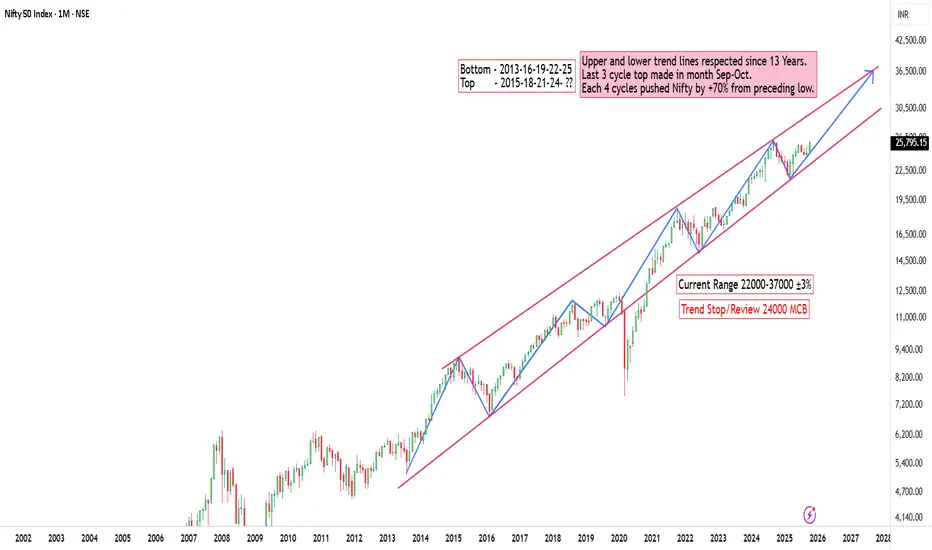
Nifty50 next 2 Years Overview based on last 13 years trendNifty50 next 2 Years Overview based last last 13 years trend
Trade ideas
NIFTY50.....Two lower low's to come?Hello Traders,
the NIFTY50 is in corrective setup.
The week's high so far was @ 26104. Look, how perfect this high hits the middle line of the Order-blog and rebounded that day! It declined to 25718, what was the 0.382 Fibo of the advance, and start a second try to make higher high's, but failed!
As a result of this failure, the price declined once more to 25877. This decline is not over yet!
I expect to fill the long shadows and the upper shadow of the candles from Oct. 17.+24. to filled with volume. If so to come, the market is probably strong enough to change direction. But is he?
For now, there is a „three-down” structure that is to count as a w-x-y move. But in wave 4, this is really not the structure I wait for. More interesting would be an a-b-c to complete wave 4 and a long shadow at the last 1–3 candles. This would mark an „absorption” of Smart-Money-Traders (i.e. Institutional investors)! After, market is ready to advance.
Well friends, we will see if so to come!
That's it for today!
Have a great week.....
Ruebennase
Please ask or comment as appropriate.
Trade on this analysis at your own risk.

NIFTY50.....Touched my target range! And now?Hello Traders,
Thank you to everyone sent me get-well wishes.
The NIFTY50 has touched my target range @26104 and after, it reversed.
The week closed @25795. It has left a candle with a long wick and a small red body, indicating that the most trading occurred in that area!
Chart analysis:
First; the indicators (RSI, Momentum) are strongly overborard. But while Indicators are always lagging, I don't want to give more attention than necessary.
More important is the weekly candle. The N50 has risen for four weeks, whereby the last candle is the weakest, due to the long wick!
Therefore, a corrective setback is possible, mperhaps down to the range of 25781 to 25791! More bearish potential exist!
One argument is, that the decline is going lower, testing the range of a around 25654 to 25233 area. Here, one more Order-block is at the chart. A corretive zone is, to my view, @ or around 25680.
The bulls need the upward trend to resume immediately, latest within the next 2 days, and a break above the high @ 26104!
So, the levels have been set, and we let the market make his decitions.
That`s it for now.....
Have a great week.....
Ruebennase
Please ask or comment as appropriate.
Trade on this analysis at your own risk.

Will Nifty Continue the Momentum After Today’s Sideways Move?The Chart Talk – What Market Told Us Today By M Dhanushkumar
Nifty opened with a strong gap-up and managed to close above the 15-minute resistance zone, showing early strength in the market.
However, after the initial move, price stayed sideways throughout the day, indicating consolidation near the breakout area.
This kind of price action often builds energy for the next directional move — so if Nifty sustains above today’s high, we may see momentum continuing tomorrow.
If you liked this analysis, hit the boost, follow for daily Chart Talks, and drop your views in the comments below!
📈 Disclaimer: For educational purposes only, not investment advice.

Can Nifty Turn Bullish After Today’s Sideways Breakdown?Today, the market broke the sideways range on the upside but soon faced rejection at resistance.
After that, it reversed sharply and broke the same sideways zone on the downside, showing clear intraday weakness.
Now, the key question is — was today’s move just a trap or a genuine shift in sentiment?
If Nifty holds above the lower range and buyers step in, we might see a short-term bullish recovery tomorrow.
If you liked this analysis, hit like, follow for daily Chart Talks, and share your thoughts below!
📈 Disclaimer: For educational purposes only, not a buy/sell recommendation.

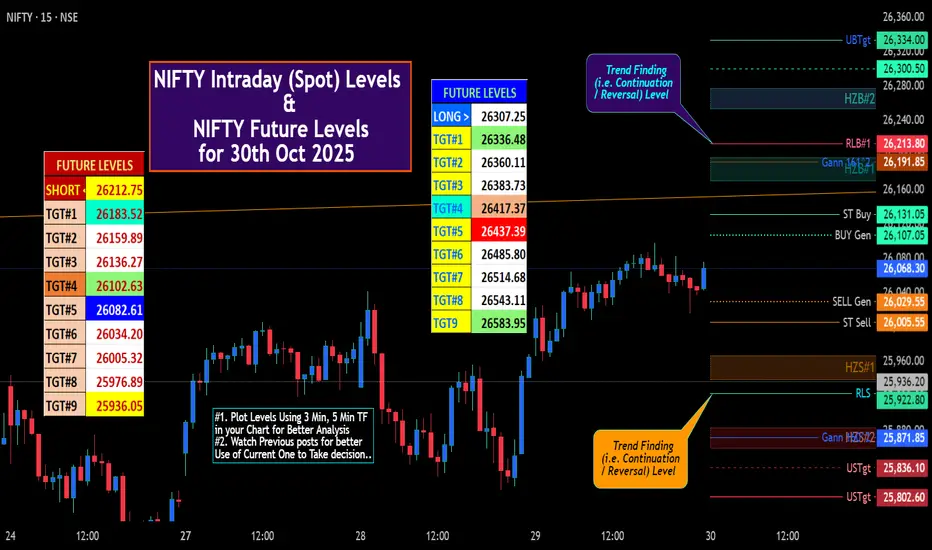
NIFTY IntraSwing (Spot) Levels & Future Levels for 30th Oct '25🚀 "NIFTY Future Levels for 30th Oct 2025" mentioned in BOX format.
🌡️Plot Levels Using 3 Min, 5 Min Time frame in your Chart for Better Analysis
L#1: If the candle crossed & stays above the “Buy Gen”, it is treated / considered as Bullish bias.
L#2: Possibility / Probability of REVERSAL near RLB#1 & UBTgt
L#3: If the candle stays above “Sell Gen” but below “Buy Gen”, it is treated / considered as Sidewise. Aggressive Traders can take Long position near “Sell Gen” either retesting or crossed from Below & vice-versa i.e. can take Short position near “Buy Gen” either retesting or crossed downward from Above.
L#4: If the candle crossed & stays below the “Sell Gen”, it is treated / considered a Bearish bias.
L#5: Possibility / Probability of REVERSAL near RLS#1 & USTgt
HZB (Buy side) & HZS (Sell side) => Hurdle Zone,
*** Specialty of “HZB#1, HZB#2 HZS#1 & HZS#2” is Sidewise (behaviour in Nature)
Rest Plotted and Mentioned on Chart
Color code Used:
Green =. Positive bias.
Red =. Negative bias.
RED in Between Green means Trend Finder / Momentum Change
/ CYCLE Change and Vice Versa.
Notice One thing: HOW LEVELS are Working.
Use any Momentum Indicator / Oscillator or as you "USED to" to Take entry.
⚠️ DISCLAIMER:
The information, views, and ideas shared here are purely for educational and informational purposes only. They are not intended as investment advice or a recommendation to buy, sell, or hold any financial instruments. I am not a SEBI-registered financial adviser.
Trading and investing in the stock market involves risk, and you should do your own research and analysis. You are solely responsible for any decisions made based on this research.
"As HARD EARNED MONEY IS YOUR's, So DECISION SHOULD HAVE TO BE YOUR's".
Do comment if Helpful .
In depth Analysis will be added later (If time Permits)
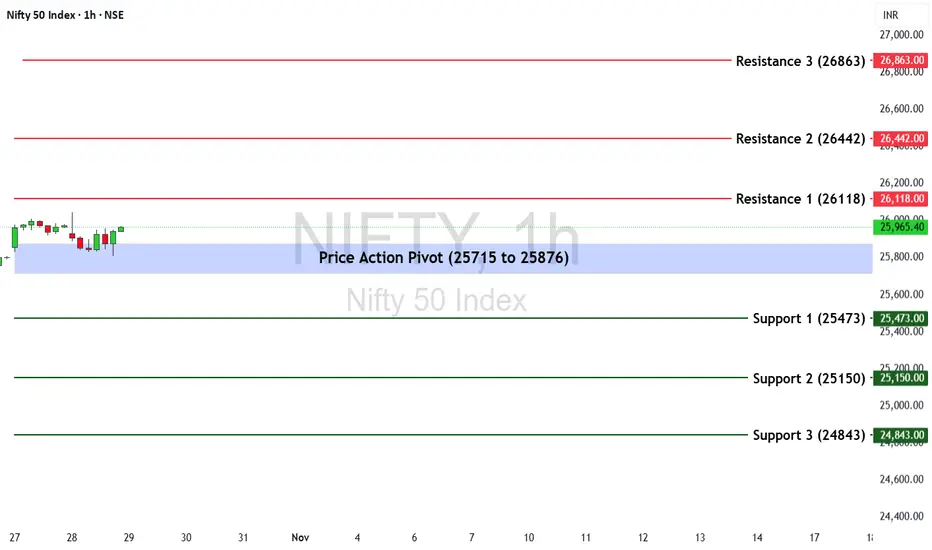
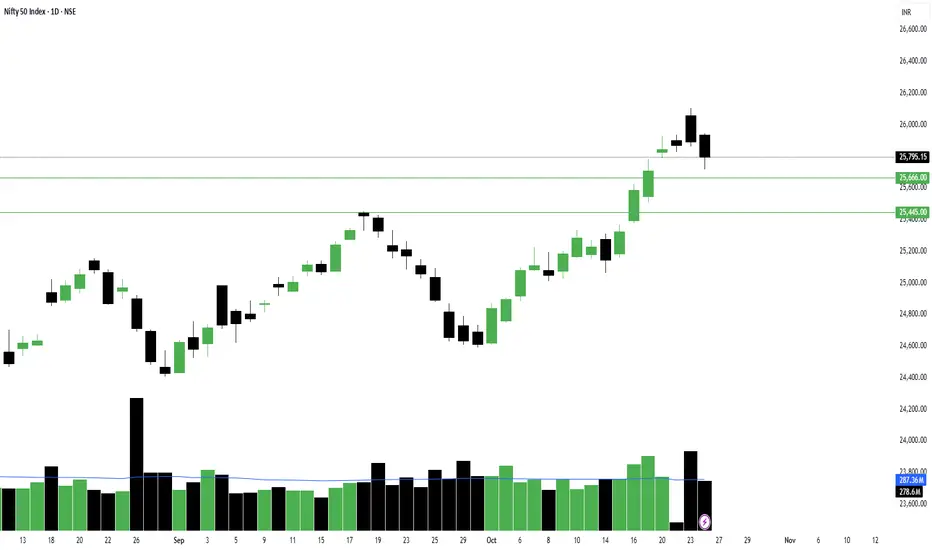
Nifty 50 Weekly Outlook (27th Oct – 31st Oct 2025)The Nifty 50 Index last week ended at 25,795.15, posting a +0.33% gain. The index continues to consolidate near recent highs, signaling a potential directional move in the upcoming week.
🔹 Key Levels for the Upcoming Week
📌 Price Action Pivot Zone:
25,715 to 25,876 – This blue-shaded zone represents the key decision area. Sustaining above this range may attract fresh buying interest, while a fall below could trigger mild profit booking.
🔻 Support Levels:
S1: 25,473
S2: 25,150
S3: 24,843
🔺 Resistance Levels:
R1: 26,118
R2: 26,442
R3: 26,863
📈 Market Outlook
Bullish Scenario:
If Nifty holds above 25,876, a breakout move could take the index toward R1 (26,118). Sustained strength above this level may open the path to R2 (26,442) and R3 (26,863) in the near term.
Bearish Scenario:
If the index slips below 25,715, short-term weakness could drag it toward S1 (25,473), followed by S2 (25,150) and S3 (24,843).
Disclaimer: aliceblueonline.com
Nifty Hits the 26K Wall—Market Awaits the Spark for a Big LeapAfter six consecutive gains, the Indian benchmark Nifty paused on Friday and slipped slightly from its recent highs, mainly due to profit booking.
Despite the mild correction, the index still ended the week in green, registering modest gains — a sign that the broader market sentiment remains upbeat.
Meanwhile, The India VIX declined 0.30% to 11.59, pointing to subdued market volatility.
Technical View:
On the charts, Nifty attempted a breakout above the 26,000 mark but couldn’t sustain above it.
According to Open Interest (OI) data:
● Resistance: 26,000 remains the strong resistance zone, with heavy call writing indicating a supply wall.
● Support: The 25,500–25,400 zone holds firm as crucial support, backed by significant put writing activity.
Key Triggers for the Week Ahead:
1. US Fed Meeting (Oct 28–29)
Markets will watch closely as the Federal Reserve meets this week. Experts widely expect a rate cut to support growth and ease borrowing costs.
2. Q2 FY26 Earnings Season
The ongoing earnings season will continue to drive stock-specific moves as major Indian corporates announce their quarterly results.
3. US–China Presidential Meeting
Investors will keep an eye on global cues from the upcoming U.S.–China talks, which could influence global sentiment and trade outlook.
4. India–US Trade Deal Progress
Reports suggest India is close to finalising a trade pact with the U.S. — a move that could further boost investor confidence if concluded smoothly.
Looking Ahead
Nifty seems to be catching its breath within a tight range of 25,400–26,000. The bias remains positive, but a decisive breakout above 26,000 is needed to confirm fresh upside momentum.
Until then, traders should focus on stock-specific opportunities, manage risk tightly and stay agile — the next breakout could set the tone for November’s trend.

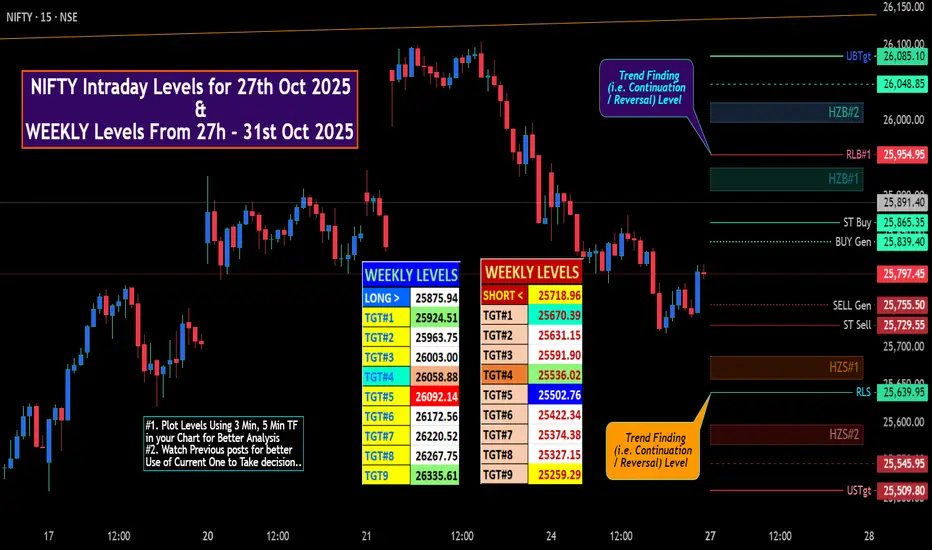
NIFTY Intraday & Swing Levels for 27th Oct 2025🚀 "WEEKLY Levels" mentioned in BOX format.
🌡️Plot Levels Using 3 Min, 5 Min Time frame in your Chart for Better Analysis
L#1: If the candle crossed & stays above the “Buy Gen”, it is treated / considered as Bullish bias.
L#2: Possibility / Probability of REVERSAL near RLB#1 & UBTgt
L#3: If the candle stays above “Sell Gen” but below “Buy Gen”, it is treated / considered as Sidewise. Aggressive Traders can take Long position near “Sell Gen” either retesting or crossed from Below & vice-versa i.e. can take Short position near “Buy Gen” either retesting or crossed downward from Above.
L#4: If the candle crossed & stays below the “Sell Gen”, it is treated / considered a Bearish bias.
L#5: Possibility / Probability of REVERSAL near RLS#1 & USTgt
HZB (Buy side) & HZS (Sell side) => Hurdle Zone,
*** Specialty of “HZB#1, HZB#2 HZS#1 & HZS#2” is Sidewise (behaviour in Nature)
Rest Plotted and Mentioned on Chart
Color code Used:
Green =. Positive bias.
Red =. Negative bias.
RED in Between Green means Trend Finder / Momentum Change
/ CYCLE Change and Vice Versa.
Notice One thing: HOW LEVELS are Working.
Use any Momentum Indicator / Oscillator or as you "USED to" to Take entry.
⚠️ DISCLAIMER:
The information, views, and ideas shared here are purely for educational and informational purposes only. They are not intended as investment advice or a recommendation to buy, sell, or hold any financial instruments. I am not a SEBI-registered financial adviser.
Trading and investing in the stock market involves risk, and you should do your own research and analysis. You are solely responsible for any decisions made based on this research.
"As HARD EARNED MONEY IS YOUR's, So DECISION SHOULD HAVE TO BE YOUR's".
Do comment if Helpful .
In depth Analysis will be added later (If time Permits)
NIFTY50.....Breakout ahead?Hello Traders,
I have paused the past two weeks,'caused by my stroke. But for now, I feel right well!
Let's check NIFTY50!
My latest forecast for N50 was true. It has risen to 25654, at the high it was @ 25781.
It closed well above the upper side of the pink rectangle.
Chart analysis:
The next target should be at the upper rectangle, ranging from 25998 to 26250! A short term correction is always to await, but it should stop around 25450 range. Probably a close off the open gap @ 25376 to 25323 is targets, but here it should end, if so to come.
The bears have the wrong card in this play, 'cause it needs a drop to 25060 area to change.
Anyway!
The sideways range is still valid, and either a new ATH will be next or we can drop to the levels I named before. Below 24300 area (to the downside) the light's will be off for N50!
Ok Traders,
That's it for a quick note today!
Have a great week.....
Ruebennase
Please ask or comment as appropriate.
Trade on this analysis at your own risk.

Momentum building but 2 tough resistances ahead before new ATH. Momentum is building in Nifty towards making a new All time high but there are 2 very important resistances to cross before Nifty can scale a new high.
One critical resistance will be 26104 which is the 1 year high. Today again Nifty came close to this level but receded thereafter after making a day high of 26097. If we are able to cross this level the previous ATH of 26277 will act as a ferocious resistance which will not be easy to cross on closing basis. If this will be crossed channel top seems to be near 26424. Trend top for medium term seems to be 26913.
Supports for Nifty at this juncture will be at 25984, 25845 (Mother line support of Hourly EMA), Mid-channel support seems to be near 25694. Father line strong support of hourly EMA seems to be near 25396 and channel bottom seems to be near 25232.
shadow of the candles is neutral but if we get a closing above 26104 it can become very positive.
As a Fresh rally dawns upon us it is mandatory to study and understand investing before you put your hard earned money on equity. I would recommend my book THE HAPPY CANDLES WAY TO WEALTH CREATION at this juncture so that you are able to make a conscious and strong financial decisions while investing in equity.
Disclaimer: The above information is provided for educational purpose, analysis and paper trading only. Please don't treat this as a buy or sell recommendation for the stock or index. The Techno-Funda analysis is based on data that is more than 3 months old. Supports and Resistances are determined by historic past peaks and Valley in the chart. Many other indicators and patterns like EMA, RSI, MACD, Volumes, Fibonacci, parallel channel etc. use historic data which is 3 months or older cyclical points. There is no guarantee they will work in future as markets are highly volatile and swings in prices are also due to macro and micro factors based on actions taken by the company as well as region and global events. Equity investment is subject to risks. I or my clients or family members might have positions in the stocks that we mention in our educational posts. We will not be responsible for any Profit or loss that may occur due to any financial decision taken based on any data provided in this message. Do consult your investment advisor before taking any financial decisions. Stop losses should be an important part of any investment in equity.

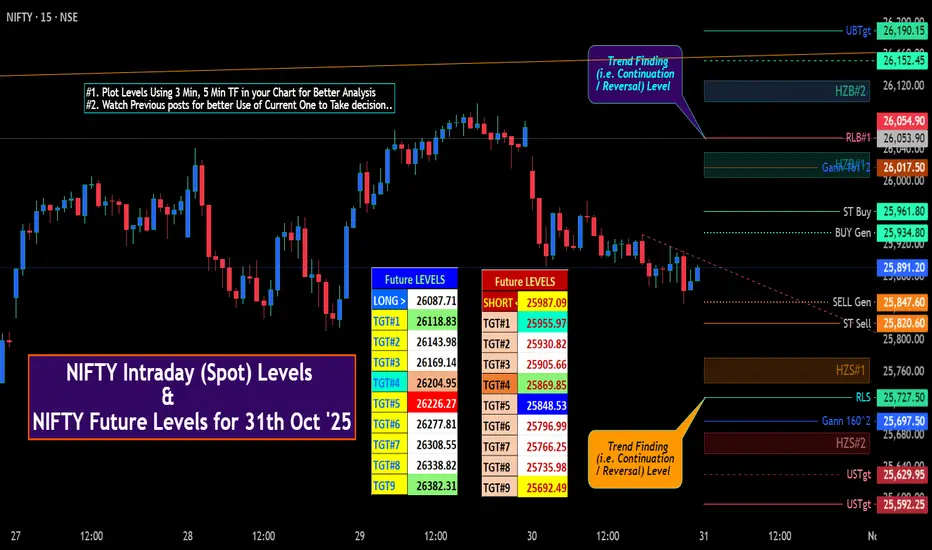
NIFTY (Spot) & FUTURE IntraSwing Levels for 31th Oct '25🚀 "NIFTY Future Levels for 31th Oct '25" mentioned in BOX format.
🌡️Plot Levels Using 3 Min, 5 Min Time frame in your Chart for Better Analysis
L#1: If the candle crossed & stays above the “Buy Gen”, it is treated / considered as Bullish bias.
L#2: Possibility / Probability of REVERSAL near RLB#1 & UBTgt
L#3: If the candle stays above “Sell Gen” but below “Buy Gen”, it is treated / considered as Sidewise. Aggressive Traders can take Long position near “Sell Gen” either retesting or crossed from Below & vice-versa i.e. can take Short position near “Buy Gen” either retesting or crossed downward from Above.
L#4: If the candle crossed & stays below the “Sell Gen”, it is treated / considered a Bearish bias.
L#5: Possibility / Probability of REVERSAL near RLS#1 & USTgt
HZB (Buy side) & HZS (Sell side) => Hurdle Zone,
*** Specialty of “HZB#1, HZB#2 HZS#1 & HZS#2” is Sidewise (behaviour in Nature)
Rest Plotted and Mentioned on Chart
Color code Used:
Green =. Positive bias.
Red =. Negative bias.
RED in Between Green means Trend Finder / Momentum Change
/ CYCLE Change and Vice Versa.
Notice One thing: HOW LEVELS are Working.
Use any Momentum Indicator / Oscillator or as you "USED to" to Take entry.
⚠️ DISCLAIMER:
The information, views, and ideas shared here are purely for educational and informational purposes only. They are not intended as investment advice or a recommendation to buy, sell, or hold any financial instruments. I am not a SEBI-registered financial adviser.
Trading and investing in the stock market involves risk, and you should do your own research and analysis. You are solely responsible for any decisions made based on this research.
"As HARD EARNED MONEY IS YOUR's, So DECISION SHOULD HAVE TO BE YOUR's".
Do comment if Helpful .
In depth Analysis will be added later (If time Permits)
Nifty levels - Oct 31, 2025Nifty support and resistance levels are valuable tools for making informed trading decisions, specifically when combined with the analysis of 5-minute timeframe candlesticks and VWAP. By closely monitoring these levels and observing the price movements within this timeframe, traders can enhance the accuracy of their entry and exit points. It is important to bear in mind that support and resistance levels are not fixed, and they can change over time as market conditions evolve.
The dashed lines on the chart indicate the reaction levels, serving as additional points of significance to consider. Furthermore, take note of the response at the levels of the High, Low, and Close values from the day prior.
We hope you find this information beneficial in your trading endeavors.
* If you found the idea appealing, kindly tap the Boost icon located below the chart. We encourage you to share your thoughts and comments regarding it.
Wishing you success in your trading activities!

Nifty levels - Oct 29, 2025Nifty support and resistance levels are valuable tools for making informed trading decisions, specifically when combined with the analysis of 5-minute timeframe candlesticks and VWAP. By closely monitoring these levels and observing the price movements within this timeframe, traders can enhance the accuracy of their entry and exit points. It is important to bear in mind that support and resistance levels are not fixed, and they can change over time as market conditions evolve.
The dashed lines on the chart indicate the reaction levels, serving as additional points of significance to consider. Furthermore, take note of the response at the levels of the High, Low, and Close values from the day prior.
We hope you find this information beneficial in your trading endeavors.
* If you found the idea appealing, kindly tap the Boost icon located below the chart. We encourage you to share your thoughts and comments regarding it.
Wishing you success in your trading activities!

Nifty - A shakeout to go more higher or a Bull trap?So on Friday, NSE:NIFTY fell as profit booking started after that sharp rally which we spotted earlier on October 9.
Big congrats to all the ones who trusted the analysis and traded it well.
Now, on Friday we saw both-side buildup on the index, but sellers’ volume was higher — that’s important to note.
For tomorrow, we only need to focus on one thing — whether Nifty breaks above 25850 or below 25750. These two levels hold massive OI buildups and will decide the next move.
If Nifty breaks above 25850, expect a sharp short rally (sharp because the PP is tight) that could push the index to new highs in the coming days.
But if it breaks below 25750 and sustains for one hour, we could see a drop toward 25666 / 25445.
However, my view stays Sell-on-Rise unless the index gives a strong close above 25850.
Why? Look at the attached chart — Friday’s candle was a clear shakeout candle, and there’s visible selling pressure buildup. This combination suggests that while accumulation is happening, buyers still lack the strength to dominate the sellers.
This weakness might reflect tomorrow. And remember — this view fails if Nifty breaks 25850 and sustains above it for one hour.
In trading, execution always beats opinion. So I’ll execute based on how the market behaves tomorrow — because I’d rather lose my view than lose my money.
Pivot stays at 25819, you guys already know what to do with that information.
On the sectoral front, NSE:CNXFINANCE , NSE:BANKNIFTY , and NSE:CNXMETAL continue to look strong.
That’s all for today. Take care and have a profitable tomorrow.
📊Levels at a glance:
Pivot: 25819
Support: 25750 (below = 25666 / 25445)
Resistance: 25850 (above = sharp short rally to new highs)
Pivot Percentile: Tight (volatile breakout/breakdown possible)
Bias: Sell-on-Rise until close above 25850
Market view: Shakeout candle with selling buildup
Sectors to watch: Financials, Banks, Steel
The Chart Talk - Nifty Rejection & Trendline Breakdown Welcome to The Chart Talk – What Market Told Us Today! by M Dhanushkumar
As we discussed in yesterday’s Chart Talk, Nifty faced resistance at the same zone once again today and got clearly rejected from that level.
After the rejection, the market moved sideways for a while, showing a lack of fresh buying interest.
Later, we saw a trendline breakdown, giving a clear short trade setup, and Nifty slid nearly 114 points from the breakdown level — confirming the selling pressure.
This session highlights how respecting key resistance zones and simple price action can give clean intraday opportunities.
If you found this useful, hit the like, follow for daily Chart Talks, and share your views in the comments!
📈 Disclaimer: This analysis is for educational purposes only, not investment advice.

Nifty levels - Oct 30, 2025Nifty support and resistance levels are valuable tools for making informed trading decisions, specifically when combined with the analysis of 5-minute timeframe candlesticks and VWAP. By closely monitoring these levels and observing the price movements within this timeframe, traders can enhance the accuracy of their entry and exit points. It is important to bear in mind that support and resistance levels are not fixed, and they can change over time as market conditions evolve.
The dashed lines on the chart indicate the reaction levels, serving as additional points of significance to consider. Furthermore, take note of the response at the levels of the High, Low, and Close values from the day prior.
We hope you find this information beneficial in your trading endeavors.
* If you found the idea appealing, kindly tap the Boost icon located below the chart. We encourage you to share your thoughts and comments regarding it.
Wishing you success in your trading activities!

NIFTY | Twin Bullish Patterns Signaling Market ConfidenceNIFTY | Dual Bullish Pattern on 15-Minute Timeframe
This is the 15-minute timeframe chart of NIFTY.
NIFTY is currently forming two bullish patterns — a triangle pattern and a falling flag pattern.
If the triangle pattern support breaks, the next strong support lies near the ₹25,550–₹25,600 zone, aligned with the lower boundary of the falling flag.
As long as this support zone holds, NIFTY is likely to resume its upward momentum, potentially heading toward a new high in the ₹26,250–₹26,300 range.
Thank You !!

Nifty 50 Analysis – 29 Oct 2025 | Price Action & LevelsSession Recap:
Nifty broke above 26,000 in the morning but couldn’t sustain the upside. Sellers stepped in, pushing price down to around 25,800, closing again within the 25,900–26,000 range — the same zone as 27 Oct.
What I’m Watching for 29 Oct:
Below 26,040:
If price stays below this zone, expecting a down move toward 25,750 — possible liquidity grab or reaction zone.
Above 26,040:
A strong breakout and hold above 26,040 could open long opportunities targeting higher levels.
Bias:
Currently range-bound with a bearish bias unless 26,040 is reclaimed convincingly.
Will stay patient for clean structure confirmation.
Sharing my personal market view — not financial advice.

Wrap-up of Oct 29, 2025Wrap-up :
Nifty has completed its Wave C of internal Wave 2 @26097 i.e. 100% retracement of Simple Zig Zag (abc) Pattern.
What I’m Watching for Oct 30, 2025 🔍
I’ll be watching for the market to break 25987 which is 38% retracement of Wave C and sustain below atleast 15 min. for a target of 25863-25832.
Disclaimer: Sharing my personal market view — only for educational purpose not financial advice.

Nifty Analysis for Oct 31, 2025Wrap-up:
Nifty has completed its internal wave 1 of major wave 3 @25845 and heading towards internal wave 2 of major wave 3 for a retracement.
What I’m Watching for Oct 31, 2025 🔍
I’ll be watching for the market to retrace upto min. 38% level i.e. 25941 and thereafter if sustain below 25904 atleast 15 min., short nifty for a target of 25711-25473.
and, if it breaks 25941 and sustains above, buy Nifty for a target of 26001-26022.
Disclaimer: Sharing my personal market view — only for educational purpose not financial advice.

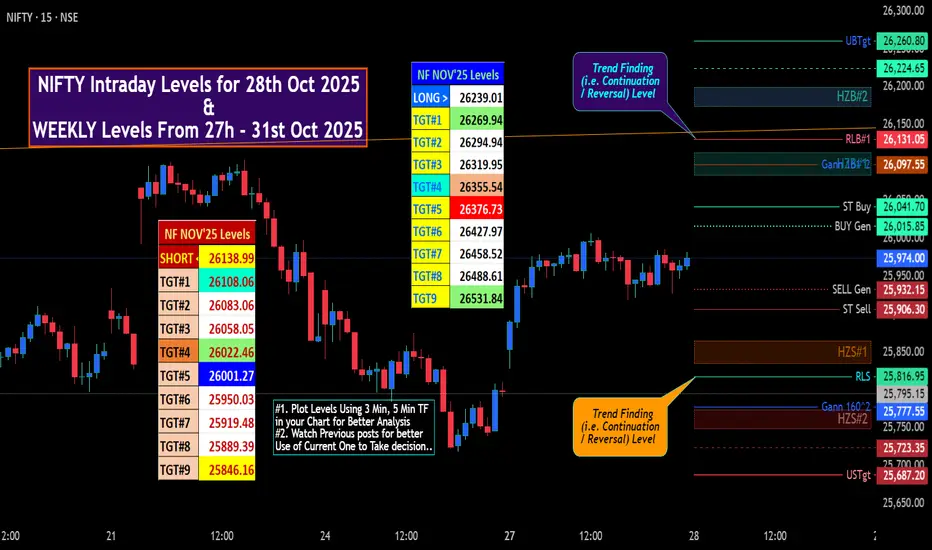
NIFTY IntraSwing Levels for 28th Oct 2025🚀 "Due to Monthly EXP. NIFTY FUTURE NOV'25 Exp levels " mentioned in BOX format.
🌡️Plot Levels Using 3 Min, 5 Min Time frame in your Chart for Better Analysis
L#1: If the candle crossed & stays above the “Buy Gen”, it is treated / considered as Bullish bias.
L#2: Possibility / Probability of REVERSAL near RLB#1 & UBTgt
L#3: If the candle stays above “Sell Gen” but below “Buy Gen”, it is treated / considered as Sidewise. Aggressive Traders can take Long position near “Sell Gen” either retesting or crossed from Below & vice-versa i.e. can take Short position near “Buy Gen” either retesting or crossed downward from Above.
L#4: If the candle crossed & stays below the “Sell Gen”, it is treated / considered a Bearish bias.
L#5: Possibility / Probability of REVERSAL near RLS#1 & USTgt
HZB (Buy side) & HZS (Sell side) => Hurdle Zone,
*** Specialty of “HZB#1, HZB#2 HZS#1 & HZS#2” is Sidewise (behaviour in Nature)
Rest Plotted and Mentioned on Chart
Color code Used:
Green =. Positive bias.
Red =. Negative bias.
RED in Between Green means Trend Finder / Momentum Change
/ CYCLE Change and Vice Versa.
Notice One thing: HOW LEVELS are Working.
Use any Momentum Indicator / Oscillator or as you "USED to" to Take entry.
⚠️ DISCLAIMER:
The information, views, and ideas shared here are purely for educational and informational purposes only. They are not intended as investment advice or a recommendation to buy, sell, or hold any financial instruments. I am not a SEBI-registered financial adviser.
Trading and investing in the stock market involves risk, and you should do your own research and analysis. You are solely responsible for any decisions made based on this research.
"As HARD EARNED MONEY IS YOUR's, So DECISION SHOULD HAVE TO BE YOUR's".
Do comment if Helpful .
In depth Analysis will be added later (If time Permits)
Nifty Index Intraday Technical Analysis for 28th Oct., 2025NSE:NIFTY — Chart Pathik Insights | 28-Oct-25
Nifty is trading at 25,974, consolidating right at the zero line of 25,966 after a swift recovery from lower demand zones. The index faces resistance at overhead pivots, while volatility remains anchored by expiry dynamics and recent trend reversals.
Bearish Playbook:
Short setups become active below 25,895, especially if price fails above 25,916 and breaks through 25,878.
Downside Levels:
25,855: First mapped level for partial profit or scalp shorts.
25,787: Deep extension for breakdowns if momentum worsens.
Risk Management: Shorts should be covered above 25,916 if the session sees fast reversals and buyers regain control.
Bullish Playbook:
Long setups unlock above 25,938, with conviction growing on strong closes over 25,955 and continued strength toward targets.
Upside Levels:
26,077: Profit zone and first major resistance for trend traders.
26,145: Extension if aggressive bids persist into the close.
Risk Management: Guard longs with tactical stops near 25,916 or 25,895 if volatility spikes against the trend.
Neutral/Range Logic:
With 25,966 as the immediate pivot, expect range-bound price action or whipsaw signals until clear direction is confirmed beyond today’s band.
Keep these levels as your strategic reference for disciplined trading—entries, exits, and risk logic mapped out every session.
If this work fuels your trading journey, boost, comment, and share to keep the insights flowing for everyone.
Follow Chart Pathik for clear levels, adaptive plans, and a growth-focused trading mindset.
