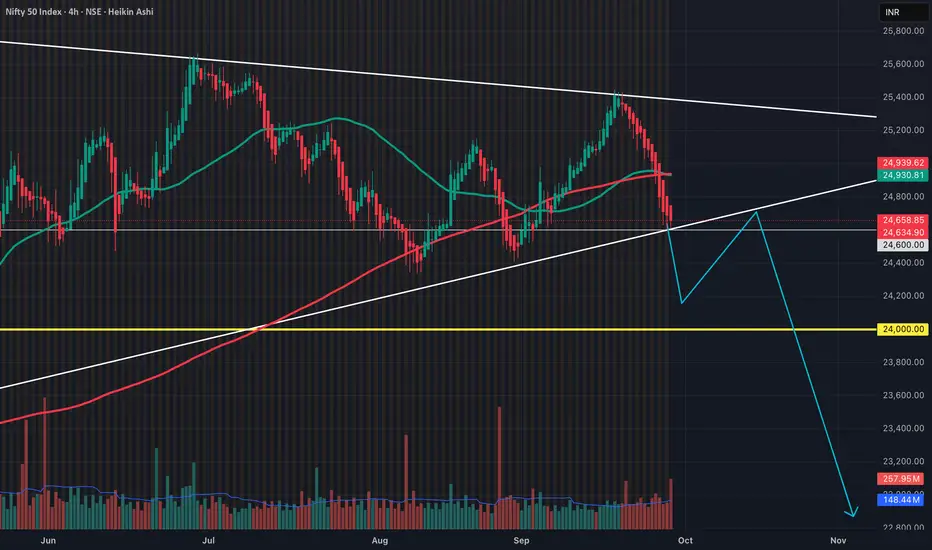
Nifty Looks Weaker and close to major crossoverNSE:NIFTY is approaching a major 50 SMA and 200 SMA Cross. Last Time it happened, there was a huge drop in the price action with almost 10% correction in the pricing. Not sure this will follow the same pattern, however, watch for planning long trades.
Key areas to watch for uptrend confirmation 24800 - 25000, break and retest/hold.
Short Term key support level 24600 - 24400, break and retest.
Trade ideas
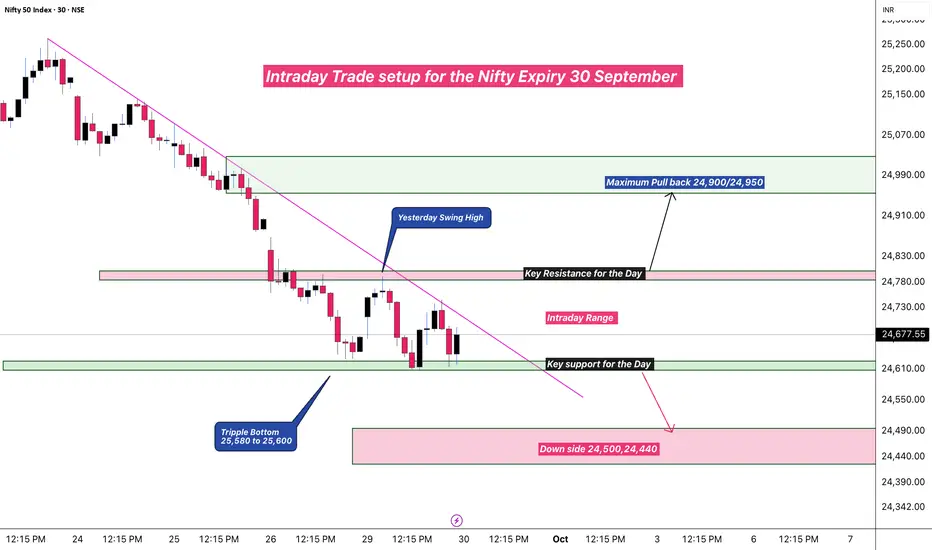
Expiry Trade Setup : 30 September 📊 Nifty Expiry Day Analysis
I’ve prepared a detailed trade setup for today’s Nifty expiry session. The key resistance zone is placed around 24,800, while 24,600 acts as a crucial lower boundary.
It’s advisable to avoid trading within the 24,600–24,800 range, as the market may remain choppy and directionless.
Instead, wait for a clear breakout beyond 24,800 or a breakdown below 24,600 to initiate intraday positions with better risk-reward opportunities.
Stay disciplined and trade with proper risk management.
Nifty Analysis EOD – September 29, 2025 – Monday 🟢 Nifty Analysis EOD – September 29, 2025 – Monday 🔴
Bulls wrestle, but bears still dictate the close
🗞 Nifty Summary
Nifty opened with a 39-point gap up, far below the 100+ points Gift Nifty indicated. After adding 32 more points, the index slipped to fill the gap, only to stage a strong recovery towards the 24,750–24,775 resistance zone.
At this zone, a Head & Shoulders pattern formed with a neckline at 24,735. Once broken, Nifty quickly tumbled below the day’s low, meeting the H&S target within minutes. After a brief box pattern breakdown, price dipped below the PDL — but this turned into a false breakdown trap, sparking a 132-point recovery back to the neckline level at 24,735.
Despite multiple bullish attempts, the neckline flipped into strong resistance. Bears regained control, dragging Nifty back below PDL, though another late bounce of 77 points lifted the close to 24,677.55.
Overall, the 185-point wide range offered rich intraday trading opportunities, but the close below PDC keeps the index in a bearish framework with no clear reversal yet.
🛡 5 Min Intraday Chart with Levels
🛡 Intraday Walk
Gap Up +39 pts, minor push to +71 pts, then slipped for gap fill.
Strong rebound to 24,750–24,775 resistance, rejected at neckline (H&S setup).
H&S breakdown → hit target quickly, flushed below day’s low.
False PDL breakdown → 132-pt recovery back to neckline (24,735).
Neckline polarity shift to resistance → multiple failed bull attempts.
Another bear move below PDL, but bulls rescued with 77-pt bounce into close.
📉 Daily Time Frame Chart with Intraday Levels
🕯 Daily Candle Breakdown
Open: 24,728.55
High: 24,791.30
Low: 24,606.20
Close: 24,634.90
Change: −19.80 (−0.08%)
🏗️ Structure Breakdown
Small red body (~93.65 pts).
Range: ~185.10 pts → decent volatility.
Upper wick: ~62.75 pts → sellers rejected upside.
Lower wick: ~28.70 pts → mild buying near lows.
📚 Interpretation
Bulls attempted a rally but met heavy resistance at 24,790.
Bears dragged price down to 24,606.
Close near low → bearish tilt despite recovery attempts.
🕯Candle Type
Small-bodied bearish candle → Spinning Top with bearish bias.
Signals indecision but sellers still defending control.
🛡 5 Min Intraday Chart
⚔️ Gladiator Strategy Update
ATR: 175.10
IB Range: 110.20 → Medium
Market Structure: ImBalanced
Trade Highlights:
11:30 Long Trade – Target Achieved (R:R 1:3.3)
📌 What’s Next? / Bias Direction
Bias remains bearish below 24,800. A sustained breach above this level can revive bullish momentum, else further weakness toward 24,600–24,420 is likely.
📌 Support & Resistance Levels
Resistance Zones:
24735
24750 ~ 24775
24868
24890 ~ 24915
24990 ~ 25000
25048
Support Zones:
24600 ~ 24572
24500
24430 ~ 24400
💡 Final Thoughts
“Markets don’t lie — they trap. False breakouts and breakdowns are the real test of discipline. Those who chase often lose, those who wait often win.”
✏️ Disclaimer
This is just my personal viewpoint. Always consult your financial advisor before taking any action.

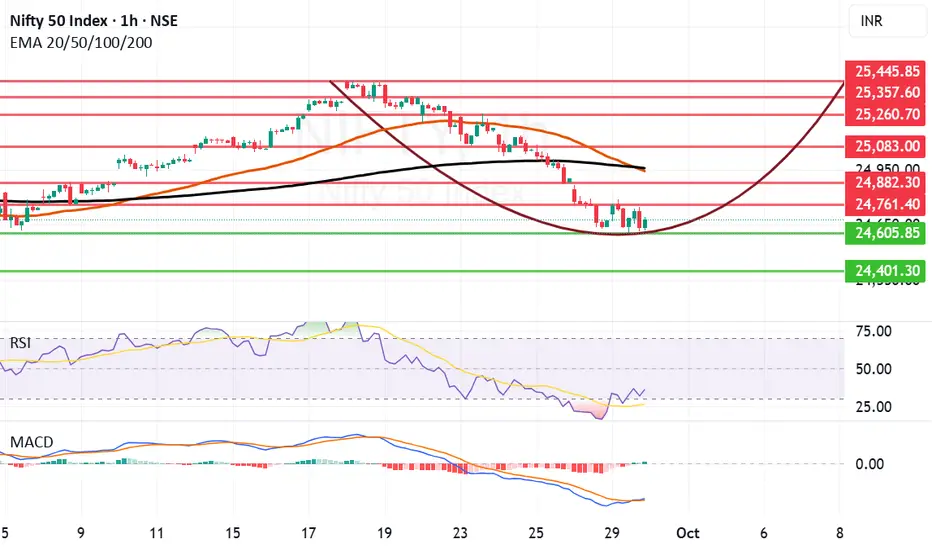
Temporary Bottom formations seems to be happening in Nifty. It seems that Nifty is trying to form a bottom around 24605 levels. If this level is broken the next support seems to be near 24401. On the upper side the seem to be near 24761 and 24882. If we get a closing above 24882 the most important resistance will be at 24944 and 24960 where we have the Mother and the father line respectively. Bulls will get back in business above 24960 with further resistances at 25083 and 25260. these seem to be the levels to watch out this week.
Mark Mobius veteran investor looks at Sesex reaching 100,000 within 1 year. Corresponding level for Nifty can be close to 27K+ this is the news on the positive side. RSI has started to move in a positive direction. Moving Average Convergence and Divergence has given a slight indication showing the trend might change sooner rather than later.
To learn more about my Mother, Father and Small Child Theory, RSI, MACD, Profit booking averaging and other Techno-Funda aspects of investing you can read my book THE HAPPY CANDLES WAY TO WEALTH CREATION. It is a book considered by many as a hand book to equity investment. Currently the book enjoys 4.8/5 Star rating on Amazon. Paperback edition or Kindle edition can be bought from there or many other sources.
Disclaimer: The above information is provided for educational purpose, analysis and paper trading only. Please don't treat this as a buy or sell recommendation for the stock or index. The Techno-Funda analysis is based on data that is more than 3 months old. Supports and Resistances are determined by historic past peaks and Valley in the chart. Many other indicators and patterns like EMA, RSI, MACD, Volumes, Fibonacci, parallel channel etc. use historic data which is 3 months or older cyclical points. There is no guarantee they will work in future as markets are highly volatile and swings in prices are also due to macro and micro factors based on actions taken by the company as well as region and global events. Equity investment is subject to risks. I or my clients or family members might have positions in the stocks that we mention in our educational posts. We will not be responsible for any Profit or loss that may occur due to any financial decision taken based on any data provided in this message. Do consult your investment advisor before taking any financial decisions. Stop losses should be an important part of any investment in equity.
Ready for Bull run NIFTY 50Guys be ready for Bull Run coming back on Nifty 50 from tomorrow onwards. Enjoy profit

Darvas box forming on niftyBreakdown from darvas box … just before expiry day … things don’t look good for nifty

Nifty levels - Sep 30, 2025Nifty support and resistance levels are valuable tools for making informed trading decisions, specifically when combined with the analysis of 5-minute timeframe candlesticks and VWAP. By closely monitoring these levels and observing the price movements within this timeframe, traders can enhance the accuracy of their entry and exit points. It is important to bear in mind that support and resistance levels are not fixed, and they can change over time as market conditions evolve.
The dashed lines on the chart indicate the reaction levels, serving as additional points of significance to consider. Furthermore, take note of the response at the levels of the High, Low, and Close values from the day prior.
We hope you find this information beneficial in your trading endeavors.
* If you found the idea appealing, kindly tap the Boost icon located below the chart. We encourage you to share your thoughts and comments regarding it.
Wishing you success in your trading activities!

NIFTY Analysis 29 SEPTEMBER, 2025 ,Daily Morning update at 9 amsummarizing the understanding of **Gann Indicators** from your provided content
- Basics of Gann Indicators
1. Gann indicators are based on the idea that **markets rotate from angle to angle**.
2. When one angle is broken, **price moves towards the next angle**.
3. Multiple angles together form a **Gann Fan**.
4. Gann angles analyze **pattern, price, and time** simultaneously.
5. Gann believed the **past, present, and future exist together** on a Gann angle.
Gann Angles vs. Trendlines
6. A **Gann angle** is a diagonal line moving at a **uniform rate of speed**.
7. A **trendline** is drawn by connecting tops-to-tops or bottoms-to-bottoms.
8. Unlike trendlines, Gann angles allow forecasting **where price will be on a future date**.
9. Trendlines require frequent adjustment, making them less reliable for **long-term forecasts**.
10. Gann angles provide **predictive value** by projecting consistent support and resistance levels.
Special Considerations
11. Gann believed **time, price, and market action are interconnected**.
12. Gann angles forecast **support and resistance** levels.
13. **Up-trending angles act as support**, while **down-trending angles act as resistance**.
14. Markets tend to **rotate from one angle to the next** (“rule of all angles”).
15. Combining Gann angles with **retracement levels (like 50%)** strengthens support/resistance zones.
Strength and Weakness of Market
16. The **main Gann angles** are 1x2, 1x1, and 2x1.
17. **1x2 angle** = 1 unit price for every 2 units of time (weaker trend).
18. **1x1 angle** = 1 unit price for 1 unit of time (balanced trend).
19. **2x1 angle** = 2 units price for 1 unit of time (strong trend).
20. Other ratios include 1x8, 1x4, 4x1, 8x1, etc.
Chart Scaling and Interpretation
21. Gann stressed the importance of a **properly scaled chart** (“square charts”).
22. The **1x1 angle** is often referred to as the **45-degree angle**, but only valid with correct scaling.
23. Trading **above 2x1** = strong uptrend; trading **near 1x2** = weaker trend.
24. Trading **below 1x1** = weak or bearish market condition.
25. **Price clusters** (multiple angles converging) represent **strong support or resistance zones**.

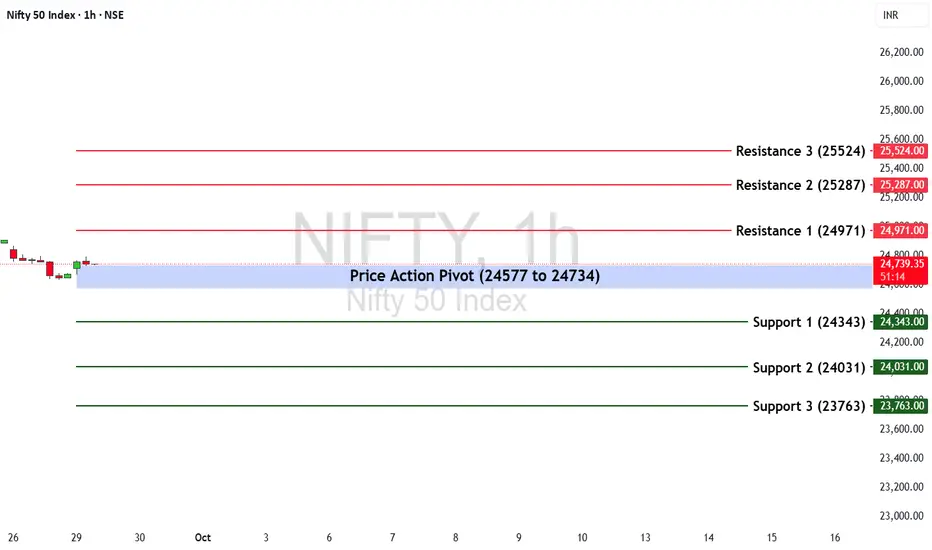
Nifty 50 at a Turning Point? Key Levels & Market Outlook AheadThe Nifty 50 ended the week at 24,654.70, closing with a sharp decline of -2.65%.
🔹 Key Levels for the Upcoming Week
📌 Price Action Pivot Zone:
24,577 to 24,734 – This range will act as a crucial decision-making zone for trend continuation or reversal. A breakout from this zone is likely to set the market tone.
Support Levels:
Support 1 (S1): 24,343
Support 2 (S2): 24,031
Support 3 (S3): 23,763
Resistance Levels:
Resistance 1 (R1): 24,971
Resistance 2 (R2): 25,287
Resistance 3 (R3): 25,524
📈 Market Outlook
Bullish Scenario:
If Nifty sustains above the pivot zone high of 24,734, it may witness fresh buying momentum. Upside targets include R1 (24,971), followed by R2 (25,287) and R3 (25,524).
Bearish Scenario:
Failure to hold above the pivot low of 24,577 could invite selling pressure. On the downside, the index may test S1 (24,343), with extended weakness dragging it towards S2 (24,031) and S3 (23,763).
Disclaimer: tinyurl.com
Market Mood Turns Sour as Nifty Slips Below 25KThe Nifty 50 ended its three-week winning streak with a sharp fall of ~2.6% , slipping below the crucial 25,000 psychological mark .
What Triggered the Decline?
● Global headwinds weighed on sentiment as trade tensions resurfaced, hurting risk appetite across equity markets.
● Domestic pressures coupled with persistent selling by foreign investors added to the weakness.
● Foreign Institutional Investors (FIIs) offloaded equities worth over ₹5,500 crore during the week.
● Concerns around a potential change in U.S. H-1B visa norms spooked the IT sector, a key driver of Indian exports.
Technical Backdrop
● The index has now fallen for 7 straight sessions , showing clear downward momentum.
● Immediate support: 24,400–24,500 zone. A break below this could drag the index toward the 23,900–24,000 strong support zone.
● Resistance levels: After slipping below the 25,000 mark, this level will now act as an immediate resistance. Strong resistance is placed at 25,400–25,500.
Market Outlook
With global uncertainties and foreign outflows, cautiousness and volatility are likely to dominate sentiment heading into October.
Strategy for Traders & Investors
● Maintain strict stop-loss discipline and manage position sizing carefully in this environment.
● For short-term traders: watch the 24,400–24,500 support zone for signs of reversal or breakdown.
● For investors: remain selective, focus on quality stocks, and avoid chasing momentum until stability returns.

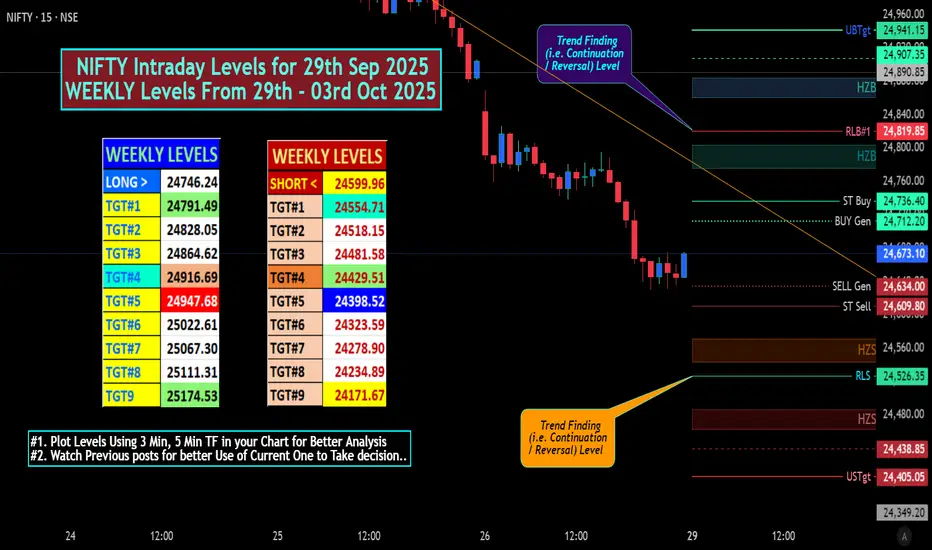
NIFTY Intraday Levels for 29th Sep 2025Outlook: What to Watch on 29th Sep 2025
• The market is likely to open cautiously Last trading day before SEP Exp;
(Though GIFTNIFTY closed with Minor +Ve @ 24705 (+15 odd points.) compare to NIFTY FUT @ 24689.9, with limited directional conviction unless new catalysts emerge.
*** Made a Low near 78.6% (@ 24628.15) Fib Retracement level of recent Swing Low @24404.70 & Swing High @25448.95 Treated as Strong Correction So can say Pullback Rally can not be Ruled out.
• Support zones to watch: ~ 24,400 to ~ 24,520 (Watch Plotted and Tabled levels)
• Resistance / hurdle zones: ~ 24,800 to ~ 25,000 (Watch Plotted and Tabled levels)
• Expect volatility, as India VIX had spiked (~ +6 %) in the previous session, indicating heightened nervousness.
Technical Analysis: Patterns, Indicators, and Key Levels
Technical charts reveal a bearish undertone following recent declines. The index has logged multiple red sessions, with the latest close at 24,654.70 on September 26, 2024, marking a 0.95% drop. Candlestick patterns, including Doji formations, signal indecision amid profit booking in banking and IT sectors. Intraday indicators like RSI (hovering near neutral 45-55) suggest no extreme overbought/oversold conditions, but a break below 24,700 could accelerate selling. Support and resistance levels are critical
Level Type,Key Levels (INR),Implications
Support,"24,676-24,700, 24,400",Potential bounce zones; breach signals deeper correction.
Resistance,"24,761, 25,000-25,100","Upside caps; sustained break could target 25,200."
Fundamental Analysis: Macro Cues, Flows, and Sectoral Impacts
India's macroeconomic backdrop remains robust, with GDP growth projected above 7% for FY25, driven by domestic demand. Inflation has eased, bolstering hopes for RBI rate cuts (potentially 25 bps if benign trends persist). However, FII/DII flows tilt negative: Recent data shows FII selling amid US tariff fears on pharma and visa hikes impacting IT (e.g., 1-2% sectoral drops). DIIs have countered with buys, providing some cushion.
Sectoral news: IT and pharma face headwinds from US policies, while energy and metals benefit from stable global commodities. Global markets add pressure—US indices mixed, Asian peers down—potentially dragging Nifty via correlated moves. Assumptions: No major RBI announcements today; focus on flows as primary driver.
Balanced perspective: Strong inflows and export resilience could mitigate downsides, but short-term sentiment favors caution.
Sector Performance Impact, Key Drivers
IT Down 1-2%, "US visa curbs, tariffs"
Pharma Down 1%, Global trade tensions
Banking Mixed FII outflows offset by DII
Energy Stable Commodity prices
# "WEEKLY Levels" mentioned in BOX format.
^^^^^^^ Plot Levels Using 3 Min, 5 Min Time frame in your Chart for Better Analysis ^^^^^^^
L#1: If the candle crossed & stays above the “Buy Gen”, it is treated / considered as Bullish bias.
L#2: Possibility / Probability of REVERSAL near RLB#1 & UBTgt
L#3: If the candle stays above “Sell Gen” but below “Buy Gen”, it is treated / considered as Sidewise. Aggressive Traders can take Long position near “Sell Gen” either retesting or crossed from Below & vice-versa i.e. can take Short position near “Buy Gen” either retesting or crossed downward from Above.
L#4: If the candle crossed & stays below the “Sell Gen”, it is treated / considered a Bearish bias.
L#5: Possibility / Probability of REVERSAL near RLS#1 & USTgt
HZB (Buy side) & HZS (Sell side) => Hurdle Zone,
*** Specialty of “HZB#1, HZB#2 HZS#1 & HZS#2” is Sidewise (behaviour in Nature)
Rest Plotted and Mentioned on Chart
Color code Used:
Green =. Positive bias.
Red =. Negative bias.
RED in Between Green means Trend Finder / Momentum Change
/ CYCLE Change and Vice Versa.
Notice One thing: HOW LEVELS are Working.
Use any Momentum Indicator / Oscillator or as you "USED to" to Take entry.
⚠️ DISCLAIMER:
The information, views, and ideas shared here are purely for educational and informational purposes only. They are not intended as investment advice or a recommendation to buy, sell, or hold any financial instruments. I am not a SEBI-registered financial adviser.
Trading and investing in the stock market involves risk, and you should do your own research and analysis. You are solely responsible for any decisions made based on this research.
"As HARD EARNED MONEY IS YOUR's, So DECISION SHOULD HAVE TO BE YOUR's".
Do comment if Helpful .
Nifty50 Index - Intraday Technical Analysis - 29 Sept.NSE:NIFTY
Nifty is stabilizing near 24,673 after a steep drop, now oscillating around the lower band of its short-term range with minor bullish attempts off fresh lows.
Bullish (Long) Setup
Long Entry (24,777):
Enter long above 24,777, as this signals a breakout above resistance where prior sell-offs were absorbed and initiates reclaiming the short-term trend.
Additional long positions can be considered around 24,749 if supported by strong buying action on pullbacks.
Upside Targets:
24,802 (Target 1): Represents the first likely supply zone and intraday high; profit-booking can start here.
24,894 (Target 2): Upper mapped extension, marking the next area of resistance.
Stop Loss:
Use below 24,698 to manage risk on false breakouts.
Bearish (Short) Setup
Short Entry (24,721):
Short positions initiate on a break below 24,721, confirming sellers are in control and the recent recovery has failed.
Downside Targets:
24,507 (Target 1): Support/bounce region seen in prior sessions.
24,416 (Target 2): Lower range boundary if selling accelerates.
Stop Loss:
Shorts should be exited if price sustains above 24,777, as that would negate the breakdown.
Range/Neutral Logic
Zero Line (24,655):
Market sentiment shifts at 24,655; sustained action above indicates stabilization, while below it risks further drops.
Ranging price action likely if market oscillates between 24,698 and 24,721; avoid new exposures until a directional move confirms.
This analysis delivers discipline, clear entry/exit, and risk management for both trending and reversal intraday trades in Nifty 50
Follow Chart Pathik for more such insights on Nifty50 Index daily!

Nifty S/R Lines for intraday This is not a single line for S/R ,it is a range with 30 to 50 points. If break any of the range with 15 minut candle (with body)nifty will touch other S/R range .Accuracy 90%

Market Weekly Wrap – Nifty & S&P 500 AnalysisNifty had a tough week, closing at 24654, down 673 points (-2.7%) from last week’s close. This was exactly in line with the downtrend warning I’ve been sharing over the past 3-4 weeks.
Key Highlights:
Weekly Range: High 25331 – Low 24629
Two-Week Correction: Down 3.15% from the recent high of 25448
Key Support Levels: 24474 / 24500 – watch closely!
If Nifty holds 24474/24500, we could see a short-term bounce of 1–2% toward 24950/25000.
But below 24300, brace for a deeper correction — Nifty could retest 23185 support levels.
Investor Tip:
The old saying still applies: "Be greedy when others are fearful."
This is a great time to start deploying capital — either by picking fundamentally strong stocks or through SIP/MF/ETF routes. If the market dips further, you’ll get opportunities to average your positions at better prices.
Sector to Watch Next Week: METALS — this sector looks strong and can outperform if market sentiment turns positive.
My Nifty Range for Next Week: 25050 – 24250
A breakout or breakdown beyond this range could trigger fast, directional moves.
US Markets – S&P 500 Update:
S&P 500 closed at 6643, down just 20 points, holding strong near its key Fibonacci support at 6568.
Upside Levels: Needs to sustain above 6689 for targets at 6780 / 6930 / 6959
Downside Risk: Below 6568, watch for 6502 / 6454 / 6376
Pro Tip: Keep a trailing stop-loss (SL) at 6524 to lock in profits
📌 Key Takeaways:
✅ Market correction was expected – use this opportunity wisely
✅ Watch 24474 support for potential bounce
✅ Metal sector could lead gains next week
✅ S&P 500 holding key support, but keep SLs in place

NIFTY50.....Back to neutral!Hello Traders,
the NIFTY50 had a bad week. It drops -672points, or -2.65%! This is not what I have expected!
The idea of an impulsive structure became less likely, with a wave (ii) beyond the wave (ii), orange, low!
Of course! It can morph into a double waves 1-2, but it would be time to raise!
Chart analysis:
The index is "diving" into a range from 24857-24295, where there is a lot of buying interest! If the price drops to the lower boundary of the pink rectangle, the idea of an impulsive structure will be eliminated!
In this case, a much lower price would be expected in the coming weeks.
This is also the reason, while I argued, that a final selloff is still possible!
If so to come, a steep decline into the area of around 222xx points is truly at hand. Not yet, but thinkable!
On the other hand!
If N50 is can raise above the 25122 points, the odds of substantial gain to new ATH are higher! I am setting my expectations back to neutral!
This is my recommendation to you!
If something important happens, I will inform you immediately.
Have a great week.....
Ruebennase
Please ask or comment as appropriate.
Trade on this analysis at your own risk.

Nifty Spot Daily Trend Analysis from September 29Nifty spot may find support near 24,530 with a potential rebound toward 25,100, indicating the possibility of a Head and Shoulders formation in the coming sessions.
A gap-up opening on September 29, 2025 cannot be ruled out, which may influence these projected levels. Traders should rely on their own technical assessment before initiating positions.
Adherence to disciplined risk management is strongly recommended.

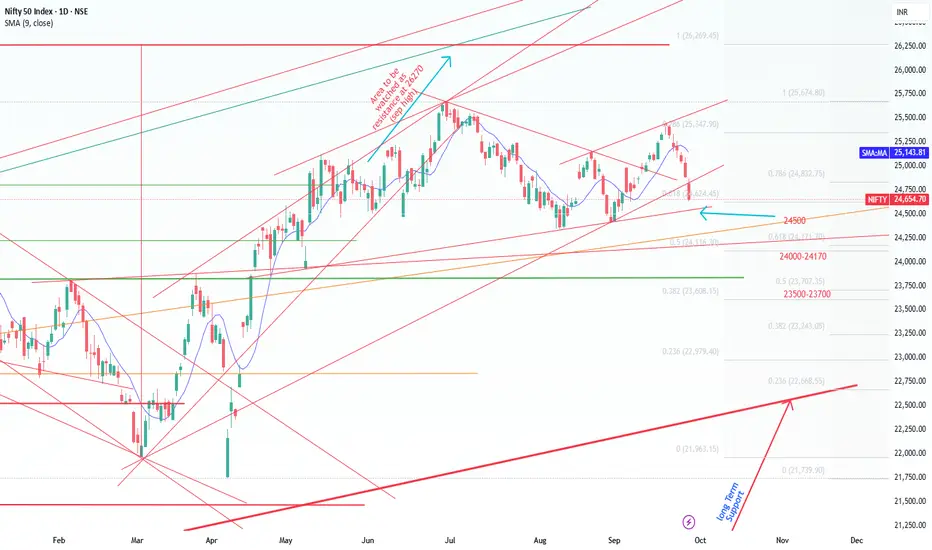
Nifty Short & Medium Term SupportsNifty on a decline mode because of new Tariff's imposed by Trump mainly on Pharma this week.
Primarily New announcement on IT - H1 B Visa and Tax for Outsourcing IT and the recent pharma tarrifs are the concern.
Use the dips (Opportunity) and buy through SIP or through multiple parcel in this uncertain times with a goal of 3-5 years.
Nifty Short Term Supports:
1. 24500 ( Trend Line as shown )
2. 24000-24170 (Fibonacci Retracements Supports- Two Supports in this zone 24116 & 24171 as shown)
Medium Term Support:
3. 23500-23700 ( Fibonacci Retracements Supports- Two Supports in this zone 23608 & 23707 as shown)
4. 23000
Resistance:
1. 25000
2. 25200 ( 25154 Aug 2025 high)
3. 25500 ( 25441 Sep 18th 2025 High )
Medium Term:
1.25670 ( Jun 2025 High)
2.26269 ( Sep 2024 High)
Global Trade Imbalances1. Understanding Global Trade Imbalances
1.1 Definition
Global trade imbalances occur when a country’s current account (the balance of trade in goods and services, income, and transfers) is persistently positive (surplus) or negative (deficit).
Trade Surplus: Exports > Imports (country saves globally).
Trade Deficit: Imports > Exports (country borrows globally).
At the global level, surpluses and deficits should theoretically offset each other. But the distribution of these imbalances—concentrated in certain countries or regions—creates challenges.
1.2 Measuring Imbalances
The most common measure is the current account balance as a percentage of GDP.
Example: In the early 2000s, the U.S. had a deficit of nearly 6% of GDP, while China had surpluses exceeding 10% of GDP.
2. Causes of Global Trade Imbalances
Trade imbalances are multi-dimensional. Some stem from structural economic factors, while others are policy-driven or cyclical.
2.1 Structural Causes
Savings-Investment Gaps:
If a country saves more than it invests domestically, it exports capital abroad, creating a trade surplus (e.g., Germany, Japan).
If it invests more than it saves, it runs deficits (e.g., U.S., U.K.).
Demographics:
Aging societies (Japan, Germany) save more and consume less → surpluses.
Younger populations (India, U.S.) spend more → deficits.
Economic Competitiveness:
Countries with strong manufacturing bases and productivity (China, South Korea) generate sustained surpluses.
2.2 Policy-Driven Causes
Exchange Rate Policies:
Countries that undervalue their currency (historically China) make exports cheaper and imports costlier, boosting surpluses.
Fiscal Policies:
Government deficits often correlate with current account deficits (“twin deficits hypothesis”).
U.S. fiscal expansion often widens trade gaps.
Trade Policies & Protectionism:
Export subsidies, tariffs, and industrial policies shape trade flows.
2.3 Cyclical Causes
Commodity Price Fluctuations:
Oil exporters like Saudi Arabia or Russia run surpluses during high oil prices.
Importers like India or Turkey face deficits.
Global Economic Cycles:
During booms, import demand surges; during recessions, imbalances may shrink.
3. Historical Evolution of Trade Imbalances
3.1 Post-War Period (1945–1970s)
Bretton Woods system ensured relative balance due to fixed exchange rates.
U.S. deficits began growing in the 1960s as it financed global military and economic responsibilities.
3.2 1980s–1990s
Japan’s rise as a major exporter created tensions with the U.S.
Plaza Accord (1985) aimed to reduce U.S. deficits and Japanese surpluses by revaluing currencies.
3.3 2000s – The China Effect
China’s accession to the WTO (2001) transformed global trade.
China’s low-cost manufacturing flooded global markets, generating massive surpluses.
The U.S. deficit ballooned as it imported cheap Chinese goods.
3.4 Post-2008 Global Financial Crisis
The crisis highlighted risks of imbalances, especially between the U.S. (deficit spender) and Asia (surplus savers).
Rebalancing efforts were discussed at the G20 but progress was limited.
3.5 2010s–2020s
Global imbalances narrowed somewhat, but structural gaps remain.
Germany’s persistent surpluses became a focal point in the Eurozone.
The U.S.-China trade war (2018–2019) reflected deep concerns over imbalances.
4. Key Players in Global Trade Imbalances
4.1 United States
World’s largest deficit nation.
Imports far exceed exports, especially in consumer goods, electronics, and oil (though energy deficits have narrowed with shale).
Finances deficits by attracting global capital (U.S. Treasuries as safe assets).
4.2 China
World’s largest surplus nation in the 2000s.
Driven by export-led growth model, state-led savings, and undervalued yuan.
Recently, surpluses have moderated but remain significant.
4.3 Eurozone & Germany
Germany runs chronic surpluses due to high competitiveness and restrained domestic spending.
Southern Europe historically ran deficits, creating internal Eurozone tensions.
4.4 Japan & East Asia
Japan and South Korea are long-term surplus economies, investing savings abroad.
4.5 Oil Exporters
Saudi Arabia, UAE, Russia swing between surpluses and deficits based on oil cycles.
4.6 Emerging Economies
India, Brazil, Turkey, and South Africa often run deficits due to high import dependence (energy, machinery).
5. Consequences of Global Trade Imbalances
5.1 Economic Consequences
Currency Volatility: Persistent deficits may weaken currencies (e.g., Indian rupee, Turkish lira).
Debt Accumulation: Deficit countries borrow heavily, risking crises (Latin America in the 1980s).
Asset Bubbles: Surplus countries’ savings flow into deficit countries, inflating asset prices (U.S. housing bubble before 2008).
5.2 Political Consequences
Trade Wars: U.S.-China tariffs, U.S.-Japan disputes in the 1980s.
Protectionism: Rising tariffs, reshoring, and industrial policies.
Geopolitical Tensions: Surplus-financed investments (e.g., China’s Belt & Road) spark strategic rivalries.
5.3 Global Financial Stability
Large imbalances create vulnerabilities in the international financial system.
IMF and G20 frequently warn that unchecked imbalances could trigger future crises.
6. Theoretical Perspectives
6.1 Classical Economics
David Ricardo’s comparative advantage assumes trade balances over time.
But in reality, structural asymmetries persist.
6.2 Keynesian View
Keynes argued for international mechanisms to prevent persistent surpluses and deficits.
Proposed “International Clearing Union” (not adopted).
6.3 Modern Views
Global Savings Glut (Ben Bernanke, 2005): Excess savings in Asia and oil exporters fueled U.S. deficits.
Hegemonic Stability Theory: U.S. deficits reflect its role as global consumer and provider of reserve currency.
7. Policy Responses to Trade Imbalances
7.1 Domestic Reforms
Boosting Domestic Demand in Surplus Nations:
Germany and China are often urged to consume more, invest domestically.
Reducing Fiscal Deficits in Deficit Nations:
U.S. encouraged to reduce spending and boost competitiveness.
7.2 Exchange Rate Adjustments
Currency appreciation in surplus countries can help rebalance flows.
Plaza Accord was an example.
7.3 Multilateral Efforts
IMF Surveillance: Monitors global imbalances.
G20 Framework for Strong, Sustainable, and Balanced Growth (2009).
7.4 Protectionist Tools
Tariffs, quotas, and industrial policies often used, but risk escalating trade wars.
8. The Future of Global Trade Imbalances
8.1 Digital Economy & Services Trade
Services and digital goods may reshape imbalances, reducing physical trade dependency.
8.2 Green Transition
Energy-importing countries may benefit as renewables reduce oil dependence.
Oil exporters face risks of shrinking surpluses.
8.3 U.S.-China Rivalry
Decoupling efforts may reconfigure trade flows.
Regional trade agreements (RCEP, CPTPP) could reduce reliance on the U.S. market.
8.4 Global South’s Role
India, ASEAN, and Africa may emerge as new trade hubs, altering imbalance patterns.
Conclusion
Global trade imbalances are more than just numbers on balance sheets—they reflect deeper realities of savings behavior, competitiveness, policy choices, and geopolitical power. While some level of imbalance is natural and even beneficial, persistent and extreme imbalances carry risks for economic stability and global cooperation.
The 21st century presents a unique challenge: balancing the benefits of open global trade with the need for fairness, resilience, and stability. Multilateral cooperation, domestic policy reforms, and structural shifts in technology and energy will shape whether future trade imbalances remain manageable or become flashpoints for crises and conflicts.

NIFTY50 UPDATENIFTY50 Analysis
The minimum target set for NIFTY50 (Red arrow formation) on August 26 was reached, followed by a rapid 3% decline in NIFTY50.
Technical Analysis
I expected NIFTY50 to continue its upward trend after breaking the 25,155 resistance level, but with the downward movement and wave overlap, it appears that the correction is not yet complete. Sometimes markets and charts become complex, but this complexity has not yet reached a level where we can predict the short-term future trend with high confidence. This is why Mr. Neely always advises allowing corrective patterns to fully form before making decisions based on observed signals.
Current Market Status
What is clear is that the Indian stock market remains in a phase of indecision, and its short-term direction is still unclear. In such conditions, it’s better to remain an observer or act like a scalper, which requires a high level of skill.
Long-Term Outlook
In the long term, the NIFTY50 trend remains bullish, and the long-term path of this index appears clear.
Good luck
NEoWave Chart

NIFTY1️⃣ Trend Summary
Timeframe (TF) Trend Zone Key Level (Average)
HTF (Yearly/Half-Yearly/Qtrly) UP Demand (Support) ~20,112
MTF (Monthly/Weekly/Daily) UP Support / DMIP / RESIS-SWAP ~24,224
ITF (240M/180M/60M) UP DMIP Demand ~24,465
🔹 All major timeframes are UP.
🔹 Demand zones get progressively tighter toward 24,000–24,600 region.
2️⃣ Key Price Levels
Entry: 24,573
Stop Loss (SL): 24,404
Target: 25,618
Risk (points): 169 (0.7%)
Reward (points): 1,045 (4.3%)
Reward-to-Risk (RR): ~6.18 (point-based), net RR after costs ~3.19.
3️⃣ Trade Plan Highlights
Item Value
Qty Planned to Buy 300
Total Buy Value ₹7,371,900
Margin/Capital (MTF 80%) ₹1,474,380
Brokerage + Taxes (Buy & Sell) 0.490% (₹36,136)
Profit if Target Hit ₹313,500
Net Profit after Costs ₹277,364
Loss if SL Hit ₹50,700
Net Loss after Costs ₹86,836
4️⃣ Interpretation
The plan anticipates a move from 24,573 to 25,618 — a ~4.3% upside.
Stop-loss is tight at 24,404, protecting against downside risk.
Net RR >3 after costs, which is attractive for a swing trade.
All timeframes pointing UP supports bullish bias; entry is aligned with Daily Demand Zone.
5️⃣ Key Levels for Monitoring
Support Zone: 24,369–24,078 (MTF avg); 24,404 (ITF proximal).
Resistance Zone / Target: 25,449–25,618 (last high to target).
6️⃣ Quick Takeaway
Your setup shows:
✅ Strong multi-timeframe confluence.
✅ Good RR with limited capital blocked due to 80% MTF.
⚠️ Key risk is if price closes below 24,404, the demand zone breaks and your trade fails.

Nifty is unable to sustain at higher levelsNifty is unable to sustain at higher levels. Last week was bad for indian stock market.

Nifty Short Term Analysis: Nifty Next Week. Nifty on chart looks very close to being oversold. some It and few Pharma companies are reaching the range were they seem oversold but when the chips are down they can stay that way for a long time. So we cant be sure if the fall will continue or persist. But some IT companies are already trading at mouth watering levels irrespective of H1B visa restriction/fee hike announcements. Pharma manufacturers have also taken the fall due to 100% Tariff on pharma announcement. However the point to be noted is that majority of Indian Pharma export to US is generic in nature and generic pharma is exempt from Tariff! Auto sector was still doing quite well in comparison. There is a new related to 20% stake sale to foreign investors in PSU Banks. Additionally there is a news related of Mega-merger of PSU Banks. Most of Auto purchase whether institutional or personal or corporate happens via Auto loans. So those who provide these loans can benefit. With reduction of GST and relief on Income tax front consumption will also increase. There are many NBFC which can also benefit because there is an increasing trend in buying goods on loan along with holidaying and leisure on loans. Defence spending is also set to increase for sure with ongoing tense environment in the neighbourhood. These are the sectors in my opinion which one must look at. With all these things in mind medium term outlook and long term outlook for India still remains positive.
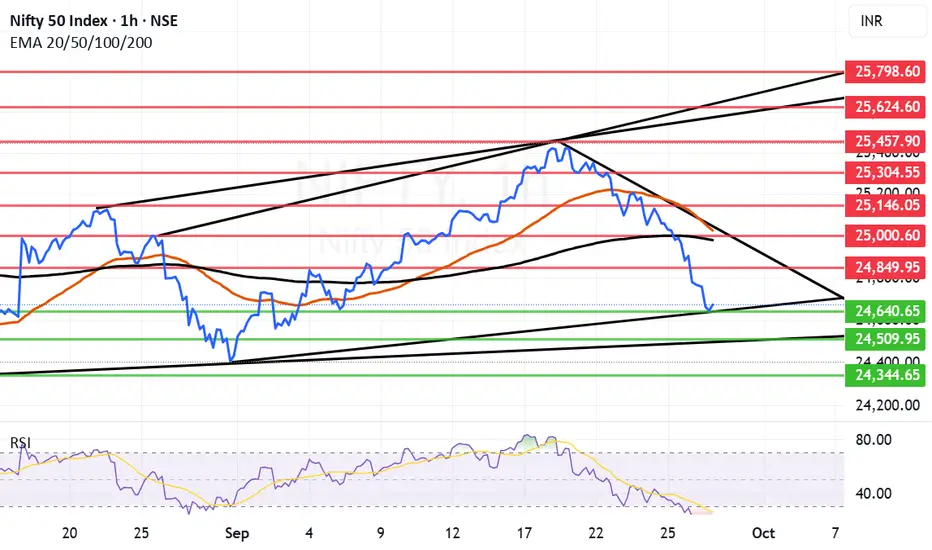
Resistance zone for Nifty with short term perspective seem to be at: 24849, 24980 is the father line, 25000 is an important resistance level and 25026 is the mother line. All the three resistances are close by. So once we get a closing above 25026 things will smoothen out and move towards 25146 or even 25304+ levels.
Support level for Nifty with short term perspective are at: 24640, 24509 and 24344.
Disclaimer: The above information is provided for educational purpose, analysis and paper trading only. Please don't treat this as a buy or sell recommendation for the stock or index. The Techno-Funda analysis is based on data that is more than 3 months old. Supports and Resistances are determined by historic past peaks and Valley in the chart. Many other indicators and patterns like EMA, RSI, MACD, Volumes, Fibonacci, parallel channel etc. use historic data which is 3 months or older cyclical points. There is no guarantee they will work in future as markets are highly volatile and swings in prices are also due to macro and micro factors based on actions taken by the company as well as region and global events. Equity investment is subject to risks. I or my clients or family members might have positions in the stocks that we mention in our educational posts. We will not be responsible for any Profit or loss that may occur due to any financial decision taken based on any data provided in this message. Do consult your investment advisor before taking any financial decisions. Stop losses should be an important part of any investment in equity.
Nifty approaching major support zones very fast. We saw a slide in Nifty this week due to Tariff related concerns and H1B Visa related concerns. The announcements triggered major sell off from FIIs (Who are anyway on a sell path for a long time) and the retail investors. DII and probably HNIs too are buying every sell off which is helping the market from not having a catastrophic fall. Now Nifty is fast approaching the points which can be potential turnaround zones.
Supports For nifty remain at: 24501, 24209 Mother Line Support) falling below Mother line of weekly chart (Very strong support)(50 Weeks EMA) can help the bears to tighten the grip over the market. If we get a closing below 24209 the next support levels will be at 23912, 23116. In very unlikely circumstances Nifty can reach 21741 or 20936 (Father line support).
Resistance For Nifty remain at: 25030, 25516 (Trend line resistance)(Strong resistance), 26277 (Nifty All Time High). If and when we are able to close above 26277. Nifty will gallop quickly towards 27K or even 28K.
It has been a long wait to reach 27K so far after we reached the All time high of 26277 in September 24. 1 year on we are having negative returns on Nifty due to International wars, Indo-Pak war episode followed by Trump Tariff but ones the tide turns a bright upside awaits us. Indian GDP is still expected to grow at 6.5% as per IMF and many other agencies. The night will end and there will be daylight soon. Sometimes it is the darkest before the sun is about to shine. Keep the faith. Sectoral rotation is always advised.
Emphasise on sectors that will benefit from local consumption increase due to Income tax relief, GST relief and Government spending, Chip making, on Infra, Power and defense, Banking, NBFCs and Finances. Sometimes it is just the question of shifting the sail in the direction of the tailwind.
Disclaimer: The above information is provided for educational purpose, analysis and paper trading only. Please don't treat this as a buy or sell recommendation for the stock or index. The Techno-Funda analysis is based on data that is more than 3 months old. Supports and Resistances are determined by historic past peaks and Valley in the chart. Many other indicators and patterns like EMA, RSI, MACD, Volumes, Fibonacci, parallel channel etc. use historic data which is 3 months or older cyclical points. There is no guarantee they will work in future as markets are highly volatile and swings in prices are also due to macro and micro factors based on actions taken by the company as well as region and global events. Equity investment is subject to risks. I or my clients or family members might have positions in the stocks that we mention in our educational posts. We will not be responsible for any Profit or loss that may occur due to any financial decision taken based on any data provided in this message. Do consult your investment advisor before taking any financial decisions. Stop losses should be an important part of any investment in equity.
