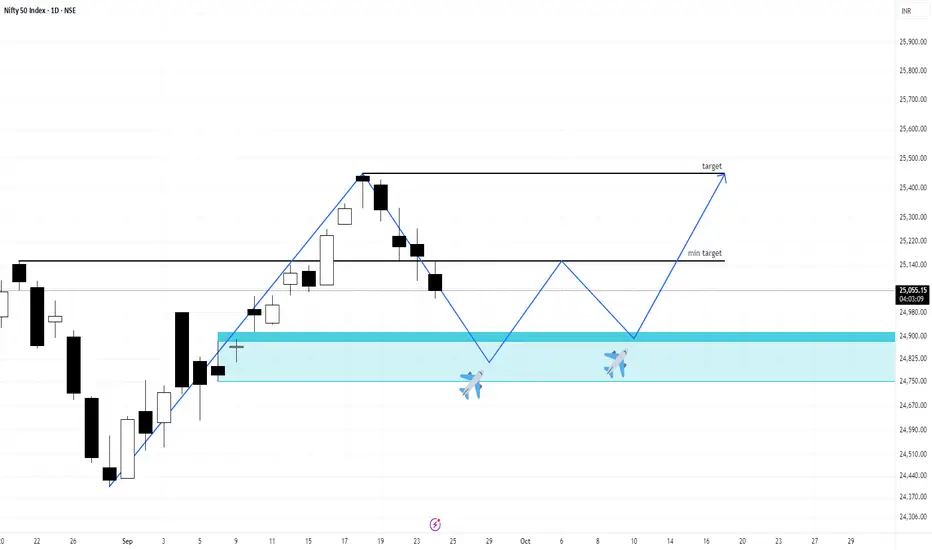
Find trading level with plan in nifty indexMarket treat Completely sideways but we have to find opportunity at any condition. We can wait for our level (price). It is clear that at this time two lower high is available in chart. Big player try to gain the liquidity.
Trade ideas
NIFTY50 Technical Update🔹 NIFTY has formed a W-Pattern, indicating it is currently in accumulation mode.
📍 Key Levels to Watch:
First Stop: 25,027
Major Support: 24,891 (Daily basis)
⚠️ If 24,891 breaks, then possible downside targets are:
➡️ 24,154
➡️ 23,865
➡️ 22,915
🐂 Stay alert for trend confirmation.
🐻 Manage risk wisely.
🔖 #Nifty50 #Nifty #StockMarketIndia #StockMarketNews #MarketUpdate #IndianStockMarket #NSE #Sensex #BullAndBear #TradingSignals #TechnicalAnalysis #StockMarketTrends #BuySellSignals #StockTrading
get more updates @ #𝗧𝗿𝘂𝗲𝗗𝗶𝗿𝗲𝗰𝘁𝗶𝗼𝗻𝘀𝟭

24 sep 2025 Nifty50 kye level
🔑 Key Levels (24-09-2025)
25,480 → Above 10m closing → Shot Cover Level (Bearish cover zone)
25,328 → Above 10m hold CE by Entry Level / Below 10m hold PE by Risky Zone
25,230 → Positive Trade View वर / Negative Trade View खाली
25,120 → Opening आधार (S1 CE Buy level / R1 PE Buy level)
25,018 → CE Buy by Level / PE Sell by Level
24,920 → CE Buy Safe Zone level
24,880 → Below 10m Unwinding level (Strong bearish)

NIFTY 50Will look for price to fall towards my zone and will look for buying confirmations around this zone and target buyside.

Nifty 50 Index - Intraday Analysis - 24 Sept., 2025NSE:NIFTY
Nifty is currently consolidating between major support and resistance, forming a base after a strong bounce from lower levels. Price structure and key intraday levels set a clear framework for the next active trade.
Long Trade Logic
Long Entry (25,184.90):
The long entry aligns with price stabilizing above previous resistance and the 15-minute structure forming higher lows, suggesting buying interest resurfacing at this level.
A further add at 25,173 emphasizes strength if the level holds, supported by demand observed on prior dips.
Targets (25,279 / 25,347):
Target 1 (25,279) is mapped near the next visible supply zone where earlier rejection was seen and fresh selling may emerge.
Target 2 (25,347) aligns with the upper end of today’s trading range and a recent swing high, increasing the chance of profit booking from bulls.
Stop Loss Logic:
Place stop just below 25,152 as a decisive break beneath this invalidates immediate bullish momentum and threatens to retest recent supports.
Short Trade Logic
Short Entry (25,152):
The short bias activates only on a firm break below 25,152, which represents the lower end of the consolidation and a breach of the zero line (25,170), indicating weakness.
Targets (25,060 / 24,992):
Target 1 (25,060) is set near the next historical support from recent bounce points.
Target 2 (24,992) is chosen for a potential washout if breakdown gains momentum, sweeping stop orders and triggering further selling.
Short Exit (25,194):
Reverse or exit short positions above 25,194, where sellers previously lost control and a fresh up move may trigger.
Key Structural Points
The Zero Line (25,170) is key for directional bias. Price holding above favors range expansion to the upside; holding below flips control to bears.
Whipsaw can occur between the short- and long-entry bands, so patience is key—wait for decisive moves and volume confirmation.
This structure is ideal for momentum trading, with clear triggers, targets, and risk management mapped out.
Trade setups favor tight stop-losses and swift partial booking as price approaches each respective target area. Avoid chasing moves; let the price come to the identified bands for best risk-reward.

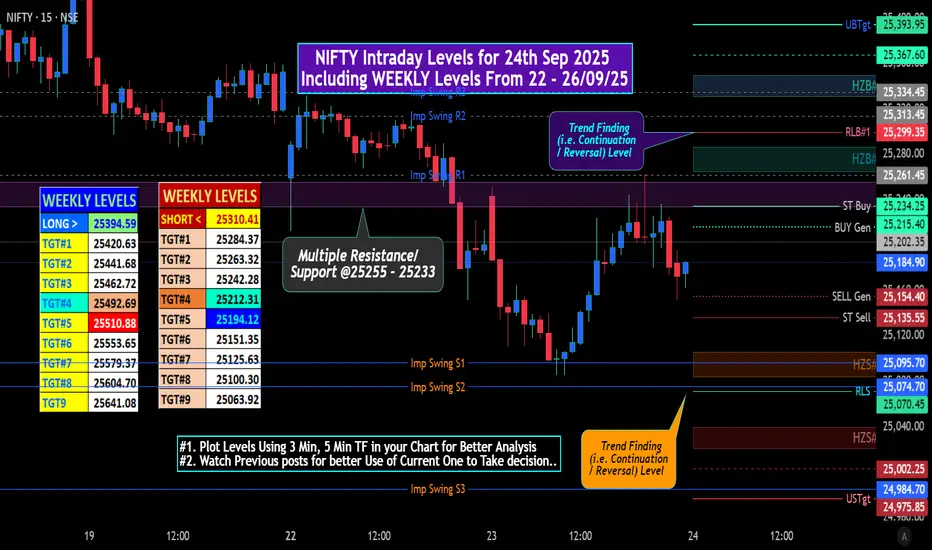
NIFTY Intraday Levels for 24th Sep 2025 Including WEEKLY LevelsMarker Overview:
The NIFTY is exhibiting signs of consolidation after a significant uptrend.But the formation of a Doji candlestick pattern on the Daily TF Chart suggests a state of equilibrium and indecision between bulls and bears. A breakout or breakdown from the current tight range will likely dictate the next directional move.
Intraday Trend (Based on the 15-minute chart)
Trend: Sideways / Mildly bearish. The price action shows the index struggling to sustain above the 25,234 level. The Lower HIGH Lower LOW on Daily Chart and the close near the day's low indicates selling pressure at higher levels.
Short-term (1–3 days): Mildly bearish, needs strength above 25,234
Trend: Losing Momentum. The broader short-term trend from the recent Lows is still up. However, the formation of a Doji candle right at the highs is a warning sign of potential exhaustion .
Summary:
NIFTY is at a critical juncture. The medium-term outlook is bullish, but the short-term price action shows indecision. The Doji candlestick at the peak suggests the rally may be pausing.
Bullish Scenario: A sustained move above 25,214-25235 zone with volume could lead to a continuation of the uptrend towards 25,335- 25360 and higher.
Bearish Scenario: A break below 25,074 could trigger a short-term correction towards the 25,000 Psychological support level. A break below 24,900 would be a more significant bearish signal & may Test 24845 Level..
Traders should watch for a decisive breakout above resistance or a breakdown below support for the next clear directional cue. Watch 25,135 & 25,070 for support, and 25,234 & 25,299 for upside confirmation.
If NIFTY holds above 25,135, bulls may attempt a bounce. Below 25,070, weakness accelerates.
Key Support Levels (Rather than Calculated Plotted Levels)
25,135 – 25,154 (near-term support)
25,074 (critical support)
25,000 – 24,975 (major support zone, if broken trend may weaken)
Key Resistance Levels (Rather than Calculated Plotted Levels)
25,215 – 25,234 (immediate hurdle)
25,303 – 25,334 (short-term supply zone)
25,367 – 25,393 (major upside resistance)
# "WEEKLY Levels" mentioned in BOX format.
^^^^^^^ Plot Levels Using 3 Min, 5 Min Time frame in your Chart for Better Analysis ^^^^^^^
L#1: If the candle crossed & stays above the “Buy Gen”, it is treated / considered as Bullish bias.
L#2: Possibility / Probability of REVERSAL near RLB#1 & UBTgt
L#3: If the candle stays above “Sell Gen” but below “Buy Gen”, it is treated / considered as Sidewise. Aggressive Traders can take Long position near “Sell Gen” either retesting or crossed from Below & vice-versa i.e. can take Short position near “Buy Gen” either retesting or crossed downward from Above.
L#4: If the candle crossed & stays below the “Sell Gen”, it is treated / considered a Bearish bias.
L#5: Possibility / Probability of REVERSAL near RLS#1 & USTgt
HZB (Buy side) & HZS (Sell side) => Hurdle Zone,
*** Specialty of “HZB#1, HZB#2 HZS#1 & HZS#2” is Sidewise (behaviour in Nature)
Rest Plotted and Mentioned on Chart
Color code Used:
Green =. Positive bias.
Red =. Negative bias.
RED in Between Green means Trend Finder / Momentum Change
/ CYCLE Change and Vice Versa.
Notice One thing: HOW LEVELS are Working.
Use any Momentum Indicator / Oscillator or as you "USED to" to Take entry.
📢 Disclaimer
I am not a SEBI-registered financial adviser.
The information, views, and ideas shared here are purely for educational and informational purposes only. They are not intended as investment advice or a recommendation to buy, sell, or hold any financial instruments.
Trading and investing in the stock market involves risk, and you should do your own research and analysis. You are solely responsible for any decisions made based on this research.
"As HARD EARNED MONEY IS YOUR's, So DECISION SHOULD HAVE TO BE YOUR's".
Nifty Analysis EOD – September 23, 2025 – Tuesday🟢 Nifty Analysis EOD – September 23, 2025 – Tuesday 🔴
Expiry Day Drama – Two-Sided Moves, Tug of War Continues
🗞 Nifty Summary
Nifty opened with a 43-point gap up right at the strong resistance of 25,240, but selling pressure quickly kicked in. Within the first 30 minutes, the index fell 140 points from the high to test the crucial support at 25,115.
From there, a descending triangle pattern formed. Breakdown was triggered at 11:00 AM, but the next support at 25,085 came to the rescue. This 25,085–25,115 zone acted as a base, and once 25,115 was reclaimed, Nifty surged 108 points back to PDC. After a brief pause, the rally extended toward the day’s high, but the CPR Zone, CDO, CDH, and strong 25,240 resistance halted the move. Sellers pushed the index back below mean and PDC, closing at 25,169.50.
👉 Overall, expiry day was a roller coaster —
Great for option buyers with two-sided moves, but also tough to handle both sides that saw traps.
Tough for option sellers as both sides move on expiry day, too hot to handle.
Another spinning top–like candle emerged, reflecting the tug of war. With range expansion already visible, the next session may cool down into a narrower range, provided today’s high or low holds.
🛡 5 Min Intraday Chart with Levels
📉 Daily Time Frame Chart with Intraday Levels
🕯 Daily Candle Breakdown
Open: 25,209.00
High: 25,261.90
Low: 25,084.65
Close: 25,169.50
Change: −32.85 (−0.13%)
🏗️ Structure Breakdown
Small red candle (Close < Open).
Body: ~39.5 points → small body, indecision.
Range: ~177.25 points → wide swings.
Upper wick: ~52.90 points → rejection at 25,260.
Lower wick: ~84.85 points → buyers active at 25,085.
Close near lower-mid of the range.
📚 Interpretation
Opened at resistance → sellers took control early.
Buyers held 25,085–25,115, creating a base.
Rally attempts were capped at 25,240 resistance.
Close shows market still in tug of war, with sellers slightly ahead.
🕯Candle Type
Spinning Top → indecision but weak bias.
📉📈 Short-Term View – September 24, 2025
Resistance Zone: 25,250–25,340 → repeated selling here.
Support Zone: 25,085–25,115 → defended again today.
Break below 25,085 → downside to 25,048 / 25,000 / 24,990.
Bullish continuation only above 25,260–25,340.
👉 3-Day Context (19th → 23rd Sept)
19th Sept: Bearish rejection candle from ~25,420.
22nd Sept: Strong rejection near 25,330, weak close at 25,202.
23rd Sept: Spinning Top at 25,170 → hesitation, indecision, tilt bearish.
👉 The sequence shows distribution pressure building.
📌 Conclusion:
Nifty is losing bullish momentum as sellers hold 25,250–25,450 firmly, while bulls are desperately defending 25,080–25,150. Until one side gives way, expect volatile but range-bound trade. The bias leans toward a short-term correction unless bulls reclaim 25,330+ convincingly.
🛡 5 Min Intraday Chart
⚔️ Gladiator Strategy Update
ATR: 162.87
IB Range: 140.8 → Big
Market Structure: Imbalanced
Trade Highlights:
09:20 → Short Trade ✅ Target Achieved (R:R = 1:2)
11:10 → Short Trade ❌ SL Hit
12:25 → Long Trade ✅ Target Achieved (R:R = 1:3.63)
📌 Support & Resistance Levels
Resistance Zones:
25,240
25,290 ~ 25,307
25,340 ~ 25,385
25,425 ~ 25,460
Support Zones:
25,165 ~ 25,140
25,115
25,085
25,045
25,000 ~ 24,990
💡 Final Thoughts
The market played both sides on expiry day, rewarding nimble traders and punishing late movers. Key battle zone remains 25,085–25,150 vs. 25,250–25,340. Whoever wins this zone will dictate the next directional leg.
📖 “A range is the battlefield — breakout is the victory.”
✏️ Disclaimer
This is just my personal viewpoint. Always consult your financial advisor before taking any action.

Nifty 50 Technical Analysis: Simple Breakdown for September 2025As of September 23, 2025, the Nifty 50 index, the benchmark for the Indian equity market, stands at approximately 25,200, reflecting a marginal dip of around 0.08% in the latest session.
EMA: Checking the Trend Direction
Exponential Moving Averages (EMAs) help us see if the market is going up or down by focusing on recent prices. The 20-day EMA (around 25,241) and 50-day EMA (around 25,208) are key for short- and medium-term trends.
Right now, the Nifty 50 is just below the 20-day EMA but above the 50-day EMA. This means we might see a short pause, but the overall upward trend from early September is still strong. The price rose from 24,500 in August to a high of 25,630 recently, showing steady growth. When the 20-day EMA crosses above the 50-day EMA (called a "golden cross"), it’s a good sign for buyers—this happened last month. A drop below both could signal trouble, but that’s not happening yet.
The 5-day EMA (25,204) and 10-day EMA (25,212) are also close, suggesting a possible bounce if more people start buying. For simple trading, watch for the price to go back above 25,241—that could mean it’s ready to rise again.
RSI: Is the Market Too High or Too Low?
The Relative Strength Index (RSI) tells us if the market is overbought (above 70) or oversold (below 30). It’s a tool to measure momentum on a scale of 0 to 100.
Today, the Nifty’s RSI is at 50.6, which is neutral. This means it’s not too high or too low, fitting with the recent sideway movement between 25,000 and 25,600. Earlier this month, RSI hit 65 when the index reached 25,630, but it pulled back without any big warning signs. At 50.6, there’s room to grow, but a drop below 40 could mean more selling.
Another tool, the Stochastic oscillator, is at 98.9, showing it’s overbought short-term. But in a rising market, this can last longer. Look for the RSI to stay above 50 for a bullish hint, making dips a good time to buy.
Support and Resistance: Key Price Levels
Support and resistance are like floors and ceilings where the price tends to stop or turn. Support is where buyers step in, and resistance is where sellers take over.
For support, the first level is around 25,170, with stronger ones at 25,128 and 25,101. These match the 50-day EMA at 25,208, making it a solid base. If it falls below 25,070, it might drop to 25,000. Recent lows around 25,050 also act as support.
Resistance starts at 25,238, then 25,265 and 25,306, near the 20-day EMA and recent highs. Breaking 25,450 could push it to 25,500-25,700, especially with good global news. The high of 25,630 is a big resistance where selling often happens.
These levels help you plan trades—set stop-losses below support and aim for resistance as targets.
Prediction: What’s Next for Nifty 50?
Putting it all together, the Nifty 50 looks cautiously positive for late September 2025. With EMAs showing a strong buy and RSI neutral, it might stay above 25,150-25,170 and rise to 25,300-25,450 by the end of the week. Good news from the US or company earnings could boost it further.
But there are risks: a MACD sell signal (-21.48) and overbought Stochastic suggest some volatility. If it drops below 25,100, it could fall to 24,900, especially if global markets turn. There’s a 60% chance of going up to 25,500 and a 40% chance of dropping to 25,000, based on past patterns.
For trading, buy above 25,200 with a stop-loss at 25,150, or sell below 25,100 targeting 25,000. Check Bank Nifty too, as it moves with Nifty but with bigger swings.
Final Thoughts: Stay Smart with Nifty 50
The Nifty 50 chart on September 23, 2025, shows strength with some caution. EMAs keep the uptrend alive, RSI gives balance, and support/resistance guide your moves. Use these tools wisely, mix with basic market news, and adjust as things change. Keep learning and trading smart!

Nifty levels - Sep 24, 2025Nifty support and resistance levels are valuable tools for making informed trading decisions, specifically when combined with the analysis of 5-minute timeframe candlesticks and VWAP. By closely monitoring these levels and observing the price movements within this timeframe, traders can enhance the accuracy of their entry and exit points. It is important to bear in mind that support and resistance levels are not fixed, and they can change over time as market conditions evolve.
The dashed lines on the chart indicate the reaction levels, serving as additional points of significance to consider. Furthermore, take note of the response at the levels of the High, Low, and Close values from the day prior.
We hope you find this information beneficial in your trading endeavors.
* If you found the idea appealing, kindly tap the Boost icon located below the chart. We encourage you to share your thoughts and comments regarding it.
Wishing you success in your trading activities!

NIFTY LOWER TF ANALYSIS 23-SEP-2025NIFTY LTP 25113
Supports: 25016/24987/24621/521/403
Resistance 25464
Reversal level:
Expecting reversal from 25139-25050 zone.
Upside can can be 25446, 516, 666, 777, 26007, 26234

Nifty 50 – Market View After taking trendline support, Nifty 50 rallied strongly up to 25441, while we were eyeing the 25600 target.
However, sentiment turned cautious due to Trump’s Tariff War headlines and the H1B1 Visa issue. Despite these global triggers, the market structure remains bullish.
🔍 Key Observations:
✅ Market held EMA 8 support – bullish sign.
🏗️ Today’s Eight Core Industries data came in strong, supporting the recovery view.
🛡️ Recent low formed on a mitigation block – a positive technical sign.
📈 Nifty may look for a bounce back toward 25300 in the short term.
⚠️ Bias: Still bullish as long as EMA 8 support is respected.
#Nifty50 #IndianStockMarket #TechnicalAnalysis #EMA #PriceAction #SmartMoneyConcepts #NiftyUpdate #MarketNews #TariffWar #VisaNews #MitigationBlock #TrueDirections1

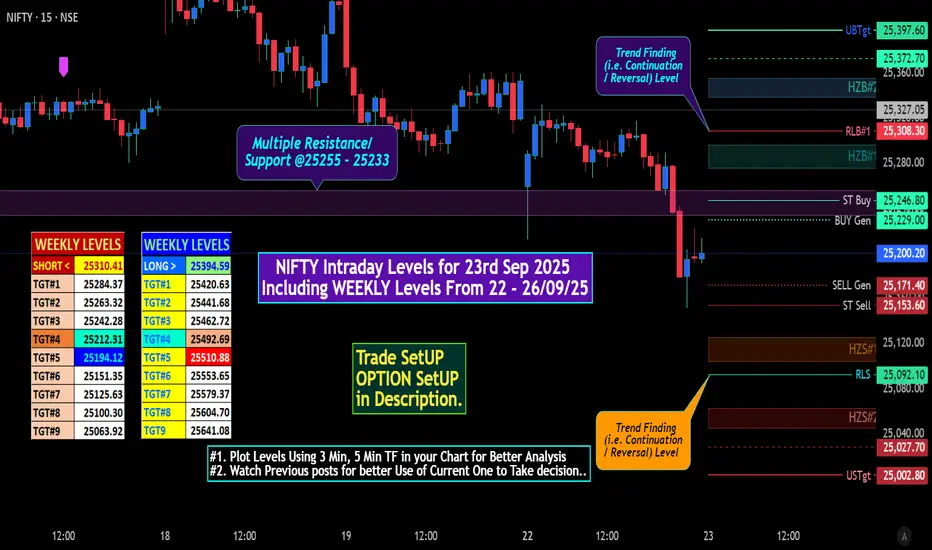
NIFTY Intraday Levels for 23rd Sep 2025NIFTY Intraday Levels for 23rd Sep 2025
Key Takeaways:
• Immediate Action: Watch the 25,154 - 25,308 range. The breakout/breakdown from this band will dictate the next immediate move.
• Warning Sign: The lower high at ~25,331.7 is the most significant technical red flag for the short-term bullish trend.
• Critical Level: 25,028 is the line in the sand for bulls. Holding it is crucial to maintain the positive structure.
Market View
Intraday View (For the next session)
• View: Neutral / Range-bound. BIAS: Cautious / Neutral to Bearish.
• Scenario 1 (Bullish) : A sustained move above 25,245- 25255 could trigger a short-covering rally towards 25,400.372. (In between some levels plotted in Chart)
• Scenario 2 (Bearish) : Break below the key support of 25,172 - 25154 could lead to a decline towards the strong support zone of 25,092-25,027.
• Strategy: Trade the range (buy near 25,092 support, sell near 25,305 resistance) with strict stop-losses. Wait for a breakout from this range for a directional move.
Iron Butterfly ( Most Suitable for Expiry )
• Sell ATM: 25,200 CE & 25,200 PE
• Buy OTM: 25,250 CE & 25,150 PE
• Max Profit: Premium received (works best if Nifty expires between 25,170-25,230)
• Ideal for: Low volatility, range-bound expiry day
* All levels mentioned on NIFTY spot Basis.
** Try to publish NIFTY Future with More OPTION Strategy.
# "WEEKLY Levels" mentioned in BOX format.
^^^^^^^ Plot Levels Using 3 Min, 5 Min Time frame in your Chart for Better Analysis ^^^^^^^
L#1: If the candle crossed & stays above the “Buy Gen”, it is treated / considered as Bullish bias.
L#2: Possibility / Probability of REVERSAL near RLB#1 & UBTgt
L#3: If the candle stays above “Sell Gen” but below “Buy Gen”, it is treated / considered as Sidewise. Aggressive Traders can take Long position near “Sell Gen” either retesting or crossed from Below & vice-versa i.e. can take Short position near “Buy Gen” either retesting or crossed downward from Above.
L#4: If the candle crossed & stays below the “Sell Gen”, it is treated / considered a Bearish bias.
L#5: Possibility / Probability of REVERSAL near RLS#1 & USTgt
HZB (Buy side) & HZS (Sell side) => Hurdle Zone,
*** Specialty of “HZB#1, HZB#2 HZS#1 & HZS#2” is Sidewise (behaviour in Nature)
Rest Plotted and Mentioned on Chart
Color code Used:
Green =. Positive bias.
Red =. Negative bias.
RED in Between Green means Trend Finder / Momentum Change
/ CYCLE Change and Vice Versa.
Notice One thing: HOW LEVELS are Working.
Use any Momentum Indicator / Oscillator or as you "USED to" to Take entry.
📢 Disclaimer
I am not a SEBI-registered financial adviser.
The information, views, and ideas shared here are purely for educational and informational purposes only. They are not intended as investment advice or a recommendation to buy, sell, or hold any financial instruments.
Trading and investing in the stock market involves risk, and you should do your own research and analysis. You are solely responsible for any decisions made based on this research.
"As HARD EARNED MONEY IS YOUR's, So DECISION SHOULD HAVE TO BE YOUR's".
Do Comment if helpful
Channel top and H1B visa mayhem hits Nifty. Nifty was today hit by dual mayhem of Channel top resistance and the hike in H1B visa fees by US. As we know IT sector was the worst hit today as IT index plummeted further down by -2.95%. Pharma and Small Cap index where other indices which took major hit. Commodities like Gold and Silver continued to shine. It is yet to be seen if IT index will plummet further or this was just a one day negativity. There are Pros and Cons of the hike lot of analyst believe that this is definitely a jolt for now but it will end up strengthening Indian It sector as lot more offshoring of work will happen. It is too early to judge if this shock will be absorbed in a day, week or IT index will take more time to recover from this issue.
The support for Nifty remain at: 25200 is the immediate trend line support where the Nifty stopped today, followed by 25133 and 24997. 24947 is the mid channel line support below which Nifty will become very weak.
The Resistances for Nifty remain at: 25221 (Mother line resistance) followed by 25309 and 25364. If we get a closing above 25364 Channel top seems to be near 25431 and 25469. Closing above 25469 will give us a channel Break Out and will have potential to lead us to new highs.
Disclaimer: The above information is provided for educational purpose, analysis and paper trading only. Please don't treat this as a buy or sell recommendation for the stock or index. The Techno-Funda analysis is based on data that is more than 3 months old. Supports and Resistances are determined by historic past peaks and Valley in the chart. Many other indicators and patterns like EMA, RSI, MACD, Volumes, Fibonacci, parallel channel etc. use historic data which is 3 months or older cyclical points. There is no guarantee they will work in future as markets are highly volatile and swings in prices are also due to macro and micro factors based on actions taken by the company as well as region and global events. Equity investment is subject to risks. I or my clients or family members might have positions in the stocks that we mention in our educational posts. We will not be responsible for any Profit or loss that may occur due to any financial decision taken based on any data provided in this message. Do consult your investment advisor before taking any financial decisions. Stop losses should be an important part of any investment in equity.

Nifty Analysis EOD – September 22, 2025 – Monday🟢 Nifty Analysis EOD – September 22, 2025 – Monday 🔴
Gap-Down, Whipsaw, and Late-Session Breakdown
🗞 Nifty Summary
Nifty opened with a 93-point gap down at 25,240, right at our support level, but slipped another 48 points to test 25,212, marking the day’s low. A sharp 120-point recovery followed, filling the gap within 35 minutes.
For most of the session, price action stayed muted in a 54-point range (25320–25267) near PDL and S1, reflecting indecision. However, the late second half brought a sharp sell-off as 25,240 broke, sending Nifty to test 25,165 before a minor bounce. The index closed at 25,202.35, just above the day’s low.
👉 Overall, the session was rough:
Morning = Bulls dominated with recovery.
Midday = Both sides in a stalemate.
Late = Bears seized control with a decisive breakdown.
🛡 5 Min Intraday Chart with Levels
📉 Daily Time Frame Chart with Intraday Levels
🕯 Daily Candle Breakdown
Open: 25,238.10
High: 25,331.70
Low: 25,151.05
Close: 25,202.35
Change: −124.70 (−0.49%)
🏗️ Structure Breakdown
Red candle (Close < Open).
Body: ~35.75 points (small vs. range).
Range: ~180.65 points (high intraday volatility).
Upper wick: ~93.60 points (rejection near 25,331).
Lower wick: ~51.30 points (buyers tried to defend near 25,150).
Closed near the day’s low → bears ended in control.
📚 Interpretation
Nifty tested 25,331 early but supply kicked in hard.
Selling dragged price to 25,151 before buyers attempted defense.
Recovery attempts failed near 25,200 → sellers controlled late trade.
🕯Candle Type
Resembles an Inverted Hammer / Shooting Star–like red candle, with strong upper rejection.
📉📈 Short-Term View – September 23, 2025
Resistance Zone: 25,320–25,350 (tested, rejected).
Support Zone: 25,150–25,200 (buyers active intraday, but weak close).
Break below 25,150 → could extend fall toward 25,050–25,000.
Upside strength only if 25,330+ is reclaimed.
📌 Conclusion: Recent sessions are showing distribution signs after a strong rally. Bulls are holding 25,150–25,200, but repeated failures near 25,330–25,450 hint at a short-term pullback unless reclaimed.
🛡 5 Min Intraday Chart
⚔️ Gladiator Strategy Update
ATR: 161.28
IB Range: 120.10 → Medium
Market Structure: Imbalanced
Trade Highlights:
11:15 Short Trade → ❌ SL Hit
13:20 Short Trade → ✅ Target Achieved (R:R = 1:2)
📌 Support & Resistance Levels
Resistance Zones:
25,240
25,290 ~ 25,307
25,340 ~ 25,385
25,425 ~ 25,460
Support Zones:
25,165 ~ 25,140
25,115
25,085
25,045
25,000 ~ 24,990
💡 Final Thoughts
The index danced in all directions today but closed with bears firmly ahead. Buyers are still defending 25,150–25,200, but cracks are visible.
👉 Watch 25,150 carefully — losing this could open the gates toward 25,000.
📖 “Markets don’t move in straight lines — they trap, test, and only then trend.”
✏️ Disclaimer
This is just my personal viewpoint. Always consult your financial advisor before taking any action.

Nifty levels - Sep 23, 2025Nifty support and resistance levels are valuable tools for making informed trading decisions, specifically when combined with the analysis of 5-minute timeframe candlesticks and VWAP. By closely monitoring these levels and observing the price movements within this timeframe, traders can enhance the accuracy of their entry and exit points. It is important to bear in mind that support and resistance levels are not fixed, and they can change over time as market conditions evolve.
The dashed lines on the chart indicate the reaction levels, serving as additional points of significance to consider. Furthermore, take note of the response at the levels of the High, Low, and Close values from the day prior.
We hope you find this information beneficial in your trading endeavors.
* If you found the idea appealing, kindly tap the Boost icon located below the chart. We encourage you to share your thoughts and comments regarding it.
Wishing you success in your trading activities!


nifty setup for 22/sep/2025past setup was hit .
now 25360-25280
market still stuck in this range .
retailers be careful dont getting trapped .
gap down than wait for level
25200 below buy put tgt -25100/25035.
if market near 25280 than also go for put ,
dont try for call side.
second half after 1 pm. possible recovery of market is only 10-20%
so focus on only 25280,25200 level traders .

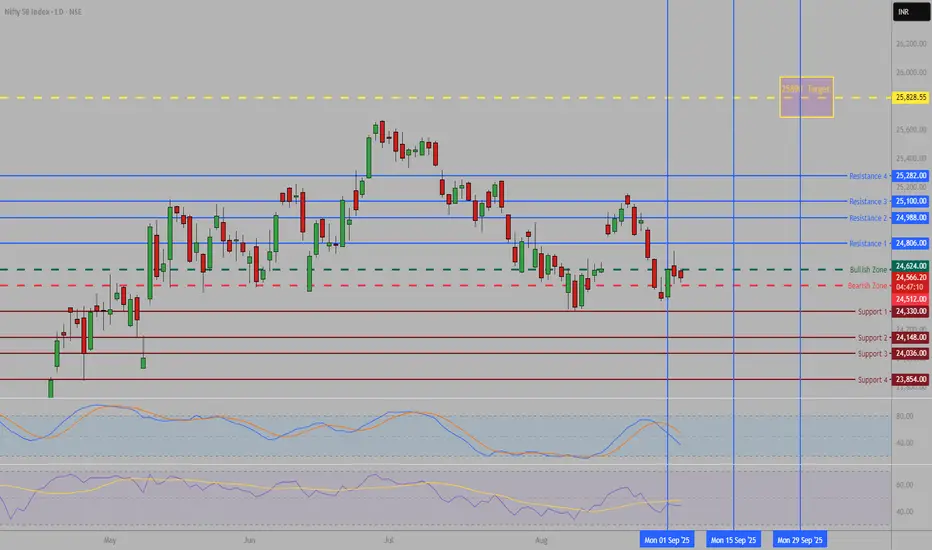
Nifty Rides 3-Week Rally, Faces Tough Resistance AheadThe Indian benchmark indices extended their rally for the third week in a row, reinforcing the ongoing bullish sentiment.
From a technical perspective, Nifty is trading just below its long-term trendline resistance, where it recently lost some steam. Immediate support lies in the 25,200–25,300 zone, while resistance is expected around 25,400–25,500, due to heavy call writing.
On the global front, markets were briefly unsettled after Donald Trump announced a sharp H-1B visa fee hike, triggering concerns for Indian IT companies. However, clarity came soon after — the White House confirmed that the $100,000 fee would apply only to new petitions, not to renewals or existing holders. This eased fears, ensuring minimal impact on ongoing IT operations.
Outlook: Nifty may witness short-term swings amid global uncertainties, but the broader setup still points to an underlying bullish trend.

NIFTY Analysis 21-Sep-2025: BIGGER PICTURELTP 25327
Supports: 25153/24337
Resistances: 25450/25670/26278
As long as 25153 holds support, we can see 25721 first.
Further new ATH and ultimate destination towards 28477 in the coming months/years.

Nifty still in uptrendSo far Nifty is still in the uptrend channel.....The time to be bearish would be below 21600, so far its buy on dips, It could reach 29000 and above soon.....However, keep your positions small and if you're an investor, remember you're investing at the highs....be quick to take profits and keep ur profits as cash....When that rug pull comes, your favorite stocks will be available at discount....use the cash then....trade safe people....cheers

Weekly Market Outlook – Nifty, BankNifty & S&P 500Nifty ended the week on a positive note, closing at 25,327 – up 213 points from last week’s close. This week’s price action was once again perfectly aligned with my projected range of 25,500 – 24,700, making a high of 25,448 and a low of 25,048.
Nifty Outlook for Next Week:
I expect Nifty to trade within 25,700 – 24,900. A break below 24,900 could open the doors towards 24,600 / 24,400.
Sector Strength Check:
Looking at the monthly time frame, none of the major indices look particularly strong right now. On the weekly chart, strength is visible only in selective sectors like Consumption, FMCG, Metals, and a few Auto stocks.
⚠️ Caution: Until we see strength coming back in at least 3–4 major indices, it’s better to stay selective and avoid aggressive long positions.
BankNifty Analysis:
BankNifty has staged a sharp V-shaped recovery, but I am not fully convinced with this move.
Support to watch: 55,000 – a break below this can take it down to 54,700 / 54,600.
Resistance to watch: Above this week’s high of 55,835, it can test 56,000 / 56,400.
Expected Range: 56,400 – 54,550
India VIX Alert:
India VIX is currently near its support zone, which signals possible volatility ahead – so stay cautious.
Global Markets – S&P 500:
S&P 500 once again gave an all-time high close at 6,671 (+80 points WoW).
Breakout Levels: Above 6,671, we could see 6,689 / 6,780 / 6,930 / 6,959 (key level).
Investors holding long positions should keep a trailing SL at 6,450 to protect profits.

Nifty September TDX Levels -Please refer to these levels for Trend guidance.
Once you are familiar with them, transition to hourly charts for decision-making.
NIFTYKey Takeaways / Trade Points
Long-term supports: 19,152 – 21,071 (HTF).
Medium-term supports: 23,404 – 24,578 (MTF).
Immediate / intraday demand zone: 25,038–25,116 (ITF).
Bias: Fully bullish across all timeframes → pullbacks into any of these demand zones could be considered as potential buy zones.
Watch levels:
Above 25,089 → continuation of current trend likely.
Below 25,038 → intraday demand breaks, could trigger a deeper pullback.
🔹 Core Trade Setup
Parameter Value Interpretation
Entry-1 25,140 Entry near immediate demand zone (matches ITF demand 25,038–25,116).
Stop Loss (SL) 25,038 Below intraday demand to reduce false breakdowns.
Risk 102 pts Difference between entry and SL.
Reward 749 pts Potential profit to target.
Target as per Entry 25,889 Profit-taking level; aligns with the next resistance zone.
RR (Risk:Reward) 7.34:1 Excellent RR ratio — high edge trade.
🔹 Market Context
Last High: 25,153 (just above entry, meaning breakout is possible).
Last Low: 24,404 (major swing low).
Point Var: 749 (matches your reward).
🔹 Gann Levels
Gann Point High: 23,452
Gann Point Low: 23,273
These are deep support levels (long-term pivot areas). Price staying above these confirms the bullish bias.
🔹 Quick View
Bias: Strongly bullish across all timeframes.
Preferred Action: Buy dips near 25,100–25,140 with SL at 25,038, targeting 25,889.
Upside Potential: Next resistance zone ~25,900+.
🔹 Execution Tips
Entry Confirmation: Watch for reversal candles or high-volume buying near 25,100–25,140 zone before entering.
Partial Booking: Consider taking partial profits around 25,600–25,700 to lock gains.
Trailing SL: Once price crosses 25,400–25,500, move SL to breakeven to protect profits.
