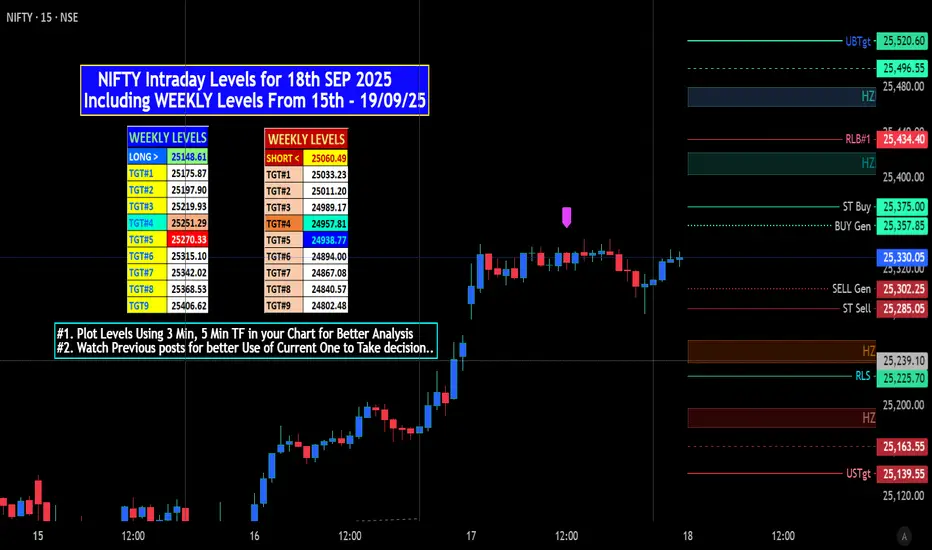
NIFTY Intra & Swing Levels for 22nd Sep 2025 Onwards.• Overall Uptrend: The Nifty 50 has been in a sustained uptrend for most of September 2025. It has recovered significantly from a late-August low and has been making a series of higher highs and higher lows. Though there is PAUSE (but without Confirmation) on last trading Day as Pattern Breaks from " H-H - H-L" to "Lower HIGH - Lower LOW"
• Recent Volatility: On September 19th, the market saw a slight decline, snapping a three-day winning streak. This indicates some profit-booking at higher levels and a potential for short-term consolidation or volatility.
• Underlying Strength: The overall technical setup remains bullish, supported by positive momentum indicators and strong domestic institutional investor (DII) buying. The market is trading above its key moving averages, reinforcing the positive sentiment.
In summary, the trend for the Nifty 50 in September 2025 is bullish, despite a recent minor pullback.
Implied Volatility (IV)
Implied Volatility (IV) is a crucial metric for option traders as it reflects the market's expectation of future price swings. A higher IV suggests greater expected volatility, while a lower IV suggests a more stable price outlook.
• Nifty 50:
o The India VIX, which measures the implied volatility of Nifty 50 options, closed up slightly at 9.9675 on Friday, September 19, 2025 (On 18/09/2025 closing was 9.885), But recovered from month LOW 9.3975
o The 30-day IV for the Nifty 50 is around 12.3. This is a relatively low reading, suggesting measured optimism and a general lack of fear in the market.
So to Create Fear What Institutions do................. Wait & See.
# "WEEKLY Levels" mentioned in BOX format.
^^^^^^^ Plot Levels Using 3 Min, 5 Min Time frame in your Chart for Better Analysis ^^^^^^^
L#1: If the candle crossed & stays above the “Buy Gen”, it is treated / considered as Bullish bias.
L#2: Possibility / Probability of REVERSAL near RLB#1 & UBTgt
L#3: If the candle stays above “Sell Gen” but below “Buy Gen”, it is treated / considered as Sidewise. Aggressive Traders can take Long position near “Sell Gen” either retesting or crossed from Below & vice-versa i.e. can take Short position near “Buy Gen” either retesting or crossed downward from Above.
L#4: If the candle crossed & stays below the “Sell Gen”, it is treated / considered a Bearish bias.
L#5: Possibility / Probability of REVERSAL near RLS#1 & USTgt
HZB (Buy side) & HZS (Sell side) => Hurdle Zone,
*** Specialty of “HZB#1, HZB#2 HZS#1 & HZS#2” is Sidewise (behaviour in Nature)
Rest Plotted and Mentioned on Chart
Color code Used:
Green =. Positive bias.
Red =. Negative bias.
RED in Between Green means Trend Finder / Momentum Change
/ CYCLE Change and Vice Versa.
Notice One thing: HOW LEVELS are Working.
Use any Momentum Indicator / Oscillator or as you "USED to" to Take entry.
📢 Disclaimer
I am not a SEBI-registered financial adviser.
The information, views, and ideas shared here are purely for educational and informational purposes only. They are not intended as investment advice or a recommendation to buy, sell, or hold any financial instruments.
Trading and investing in the stock market involves risk, and you should do your own research and analysis. You are solely responsible for any decisions made based on this research.
"As HARD EARNED MONEY IS YOUR's, So DECISION SHOULD HAVE TO BE YOUR's".
DO COMMENT FOR BETTERMENT OF POST.
Trade ideas

H1B VISA FEE ISSUE TO HAUNT NIFTY ??? WEEKLY ANALYSISNifty is trading above an important resistance zone of 25000-25150. Even then, we can expect a dip towards 25000-25150 as now it will work as an important support zone due to the H1B visa fiasco . But more or less, the chart is not indicating bearishness, and we can expect Nifty to bounce back from lows and continue the upside momentum .
All levels are marked in the chart posted .

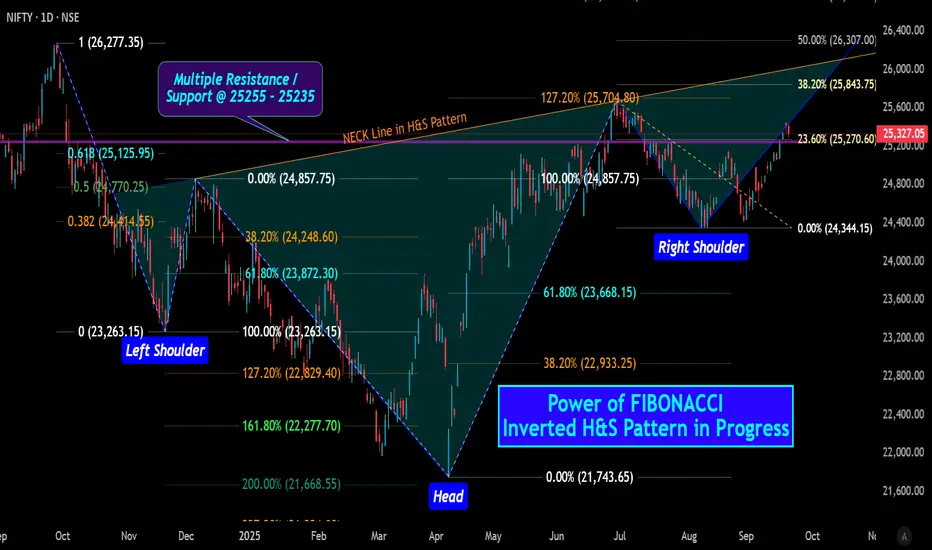
NIFTY: Power of FIBONACCI Inverted H&S Pattern in ProgressNIFTY: Power of FIBONACCI Inverted H&S Pattern in Progress
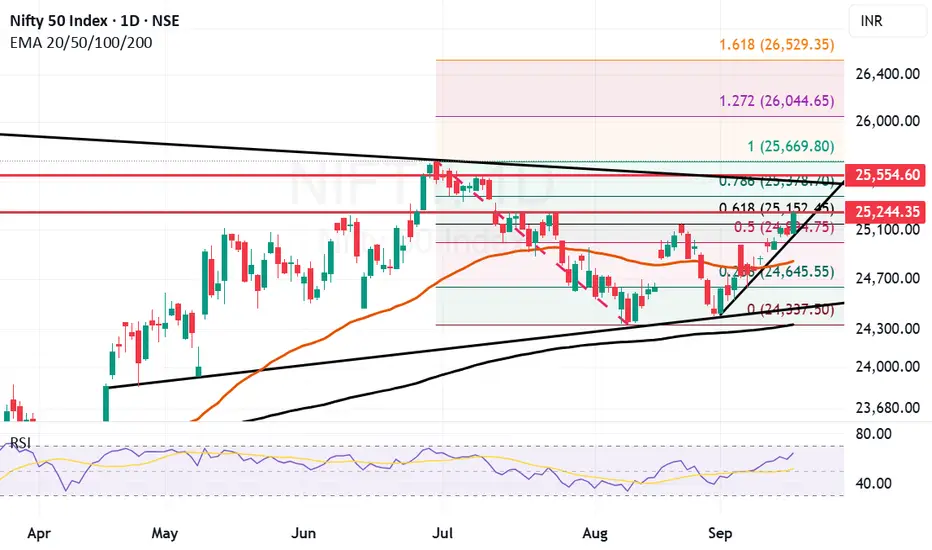
Overview of Nifty 50 Support and Resistance
After Closing September 19, 2025, the Nifty 50 index is in a strong medium- to long-term uptrend, although it has shown some signs of consolidation and profit-booking in the recent sessions . The bullish sentiment remains largely intact. Though SEBI Registered market analysts are advising a "buy-on-dips" strategy But I am not 100% AGREE with them .
Key Resistance Levels
25,435 - 25,549 : This is the most immediate and crucial resistance zone. The index has faced selling pressure around these levels, and a decisive break above this range is necessary to resume the upward momentum. A sustained move beyond this point is expected to trigger a fresh rally.
25,714.50 [ /b]: If the index successfully breaks past the 25,550 mark, this is the next significant resistance level and a potential short-term target.
25850 - 25928 : If the index successfully breaks past the 25,714 mark, this is the next significant resistance level and a potential mid-term target.
26,029 : This is near a major psychological (i.e 26000) resistance level. A strong and sustained move above 25,928 could pave the way for a rally toward this landmark.
26244 : This is Last resistance level (near all time High i.e 26277) before Creating New All Time High. A strong and sustained move above 26,029 could pave the way for a rally toward this landmark.
Key Support Levels
25,255 to 25,235 : This is the immediate and strong support zone. The index has found buying interest at these levels, and a hold above this range is a positive signal. This area is considered a key level to watch for potential buying opportunities (if Slips may touch 25214)on short-term pullbacks.
25,118 - 25041 : This area, which around coincides with the 20-day Exponential Moving Average (EMA) and key Fibonacci retracement level, is a major support. A break below this level could indicate a more significant correction.
24,970 to 24,714 : These are strong support zones that, in the event of a deeper correction, are likely to attract significant buying interest. Any decline towards these levels is widely seen as a valuable entry point for long-term investors. Though 24810 may resist the Fall.
# " Intraday &WEEKLY Levels" will be published later
Use any Momentum Indicator / Oscillator or as you "USED to" to Take entry.
📢 Disclaimer
I am not a SEBI-registered financial adviser.
The information, views, and ideas shared here are purely for educational and informational purposes only. They are not intended as investment advice or a recommendation to buy, sell, or hold any financial instruments.
Trading and investing in the stock market involves risk, and you should do your own research and analysis. You are solely responsible for any decisions made based on this research.
"As HARD EARNED MONEY IS YOUR's, So DECISION SHOULD HAVE TO BE YOUR's".
Nifty 50 at a Turning Point? Key Levels & Market Outlook AheadThe Nifty 50 ended the week at 25,327.05, gaining +0.85%.
Key Levels for the Upcoming Week
Price Action Pivot Zone:
25,248 to 25,407 – This range is crucial for identifying potential trend continuation or reversal. A move outside this zone could set the directional tone for the coming sessions.
Support Levels:
Support 1 (S1): 25,011
Support 2 (S2): 24,694
Support 3 (S3): 24,355
Resistance Levels:
Resistance 1 (R1): 25,647
Resistance 2 (R2): 25,984
Resistance 3 (R3): 26,320
Market Outlook
Bullish Scenario:
A sustained move above 25,407 (top of the pivot zone) may attract buying interest. If momentum builds, the index could test R1 (25,647), and potentially advance towards R2 (25,984) and R3 (26,320).
Bearish Scenario:
Failure to hold above 25,248 (bottom of the pivot zone) may lead to downside pressure. In such a case, Nifty may move towards S1 (25,011), and deeper support levels like S2 (24,694) and S3 (24,355)
Disclaimer: tinyurl.com

NIFTY50.....Impulsive vs corrective? The facts!Hello Traders,
the NIFTY50 closed the week with a gain of213 points or 0.85%!
So the structure of the waves has become more clear as it has been in previous weeks.
I have switched my count from corrective to impulsive, and with the "tailwind" of the rate cut by the FED, the market will become clearer for the coming weeks.
Chart analysis:
Probably a wave (iii), orange, has ended and a wave 4 of the same degree should start soon. One price target is around the blue rectangle at 25122–24990 points. A wide range, but that's the fact. I expect a possible wave (iv), orange, to end above the higher range and reverse and start a wave (iv), orange to end a wave (iii), green.
For now, the structure looks like a "three-up", but I have counted the movements as a double waves 1-2. This means, one of these wave is about to extend the range. A new ATH is possible, but not guaranteed.
To the downside, there is a potential to drop to the second blue rectangle, ranging from 24473-24348. Between both two ranges, there is no "meat, no fish" as the Germans said!
To speak in general: A rise above the 25670 area has the potential to create a new ATH, a drop to 23450 area has the potential to crash the downside. A decline to or around the 23900 area is possible.
Please ask or comment as appropriate.
Trade on this analysis at your own risk.

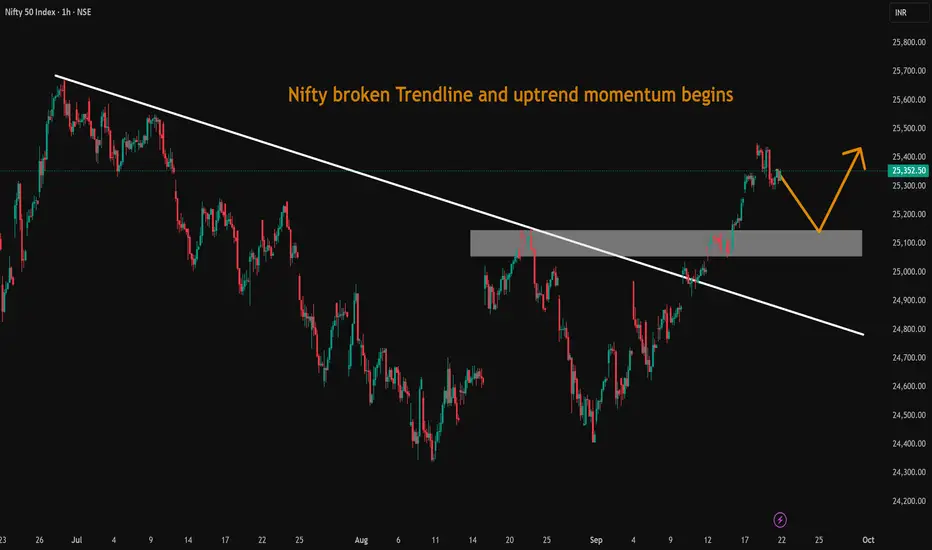
Nifty broken Trendline and uptrend momentum beginsNifty broken Trendline and uptrend momentum begins.
Wild Week Ahead For Nifty on the verge of cup and handle BO.Till Thursday the situation was like 11 overs 100 to win with 8 wickets in hand. Bears pulled one tight over and took a wicket on Friday. Now If someone tells you the team chasing needs 95 runs in 10 overs with 7 wickets in hand with one well set batsmen at the crease and a 'Cricketing Goat' coming in to bat along with well set batsman. Would you like to watch this T-20 match? Obviously you we will say,"Bring it on!" Very exciting match ahead. Right! Well we have a similar match going on between bulls and bears.
Nifty is on the verge of a cup and handle Breakout. In the last throw of dice Bears tried to marinate some negativity on Friday where Nifty closed at 25327 after making a high of 25448 during the week. The correction from high was also due to few technical reasons like high RSI and overbought market zones on daily and hourly charts.
The other reason was that current round of Trade talks between US and Europe are also not yielding some concrete results and Pakistan is going all out with strategic defense deal with KSA. Such deals have more or less no 'locus standi' either in reality or on the market but certainly they 'on paper' seem to be supporting our enemy state. The new GST rates will come into effect from next week which can be a great news for some sectors at the same time some sectors can come out as on the wrong side of the stick.
What to expect? Lot of volatility and sectoral changes. Mutual Funds / HNIs / FII and other DII will try to readjust their portfolio. Such situation can throw wild swings. Intraday trading and short term positional trading will be very risky. F&O traders should be very careful with their positions. They can make or terribly break your banks. Long term retail investors should go with the flow and steer their ship with minute adjustment to their sail or make calculated adjustments if required. Avoid knee-jerk reactions in any case.
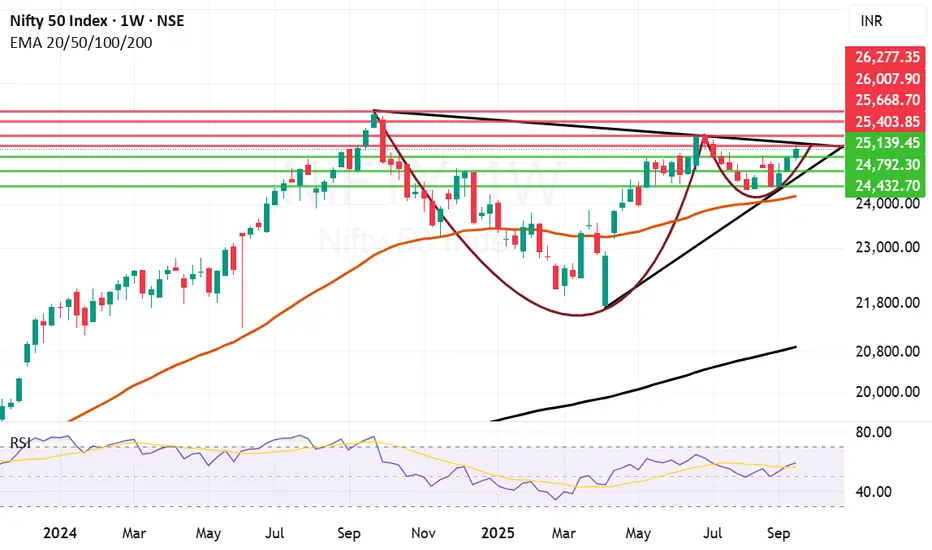
If the cup and handle Breakout happens on Nifty we can swifty reach the previous ATH (All Time High or make a New high within this quarter. If the Cup and Handle / Trend-line Break out fails Nifty will be again send back to search for supports. This week Nifty did try to get a trend line breakout but it did not succeed still the form and momentum looks good. on Friday FII and DII both were on the buying side. This means there are chances that positive momentum can continue making shadow of the candle green.
Supports for Nifty currently remain at: 25139, 24792, 24432 and finally Mother line support of 50 Weeks EMA at 24191.
Resistances for Nifty remain at: Zone between 25403 and 25668 strong resistance zone which includes major Trend line resistance and highs of the year 2025. Above this zone the next resistance can be seen in the chart at 26007 and 26277 (All Time High of Nifty).
As described in the first paragraph the game is in balance right now with possibilities of Breakout and Breakdown remaining almost equal with Bulls currently having a slight edge. Volatile month end awaits with a chance of big red or green candles to be seen in the next 2 to 3 weeks. Very interesting time ahead lets see how the cookie crumbles.
So it is like a team chasing in a T-20 needs 95 runs in 10 overs with 7 wickets in hand with Two well set batsmen at the crease. Bring it on!
If you love cricket as well as the stock market, you can read my book The Happy Candles Way to Wealth Creation. The book juxtaposes cricket and stock market in many ways. Lot of cricketing examples are given for understanding stock market behaviour. You will love it. Those who have read it love the book as it has a rating of 4.8/5 on Amazon. It is value for money hand book to learn Techno-funda Analysis. Do read it. Kindle version is available too!
Disclaimer: The above information is provided for educational purpose, analysis and paper trading only. Please don't treat this as a buy or sell recommendation for the stock or index. The Techno-Funda analysis is based on data that is more than 3 months old. Supports and Resistances are determined by historic past peaks and Valley in the chart. Many other indicators and patterns like EMA, RSI, MACD, Volumes, Fibonacci, parallel channel etc. use historic data which is 3 months or older cyclical points. There is no guarantee they will work in future as markets are highly volatile and swings in prices are also due to macro and micro factors based on actions taken by the company as well as region and global events. Equity investment is subject to risks. I or my clients or family members might have positions in the stocks that we mention in our educational posts. We will not be responsible for any Profit or loss that may occur due to any financial decision taken based on any data provided in this message. Do consult your investment advisor before taking any financial decisions. Stop losses should be an important part of any investment in equity.
Nifty Analysis EOD – September 19, 2025 – Friday🟢 Nifty Analysis EOD – September 19, 2025 – Friday 🔴
Flat Open, Sharp Fall, and a Range-Bound Trap
🗞 Nifty Summary
Gift Nifty hinted at a 50-point gap down, but Nifty opened nearly flat at 25,410. However, the bulls couldn’t hold, and within the first 45 minutes, the index slipped 132 points, breaking S1 and PDL to mark the day’s low at 25,297.
The rest of the day was stuck in a narrow 50-point band, with both sides witnessing fakeouts. The index finally closed exactly at S1 (25,352.5), about 66 points above the low.
The total range for the day stood at 142 points, and closing below previous day low showing weakness after yesterday’s sharp recovery attempt.
Yesterday’s note highlighted:
“The 100-point recovery was unexpected.”
— Today, that very recovery got completely wiped out in the early part of the session.
🗞 Last 3 Sessions breakdown
17th Sep 2025 → Open: 25,276.60 | Close: 25,330.25 | Change: +91.15 (+0.36%) → Bullish, small green candle
18th Sep 2025 → Open: 25,441.05 | Close: 25,423.60 | Change: +93.35 (+0.37%) → Bullish continuation, narrow range
19th Sep 2025 → Open: 25,410.20 | Close: 25,327.05 | Change: −96.55 (−0.38%) → Bearish, closes near 17th close
📌 Pattern Check:
The 3-session structure shows some similarity (~65%) with an Evening Star, but not a textbook one:
1st candle = Bullish
2nd candle = Strong bullish continuation (not a small-bodied star)
3rd candle = Bearish close near/below 17th session’s midpoint
👉 Interpretation:
This looks like a weak Evening Star variation, hinting at possible reversal.
For trading perspective, it’s more of a caution signal than a short trigger — confirmation from the next session’s candle is essential.
🛡 5 Min Intraday Chart with Levels
📉 Daily Time Frame Chart with Intraday Levels
🕯 Daily Candle Breakdown
Open: 25,410.20
High: 25,428.75
Low: 25,286.30
Close: 25,327.05
Change: −96.55 (−0.38%)
🏗️ Structure Breakdown
Red candle (Close < Open).
Body: ~83.15 points (moderate).
Upper wick: ~18.55 points.
Lower wick: ~40.75 points.
Closed closer to the low → Selling pressure throughout the session.
📚 Interpretation
Market opened flat but faced resistance near 25,428 (close to yesterday’s high).
Selling dragged it to 25,286, with only a mild recovery into the close.
Indicates a supply zone around 25,420–25,450.
🕯Candle Type
Bearish candle with a small lower wick.
Not a reversal by itself, but signals loss of momentum after prior strength.
📉📈 Short-Term View – September 22, 2025
Resistance: 25,420–25,450 remains strong.
Support: 25,285–25,300 (today’s low).
Breakdown below 25,240 → Downside may stretch to 25,200–25,140.
Bulls need to reclaim 25,400+ quickly to keep the uptrend alive.
🛡 5 Min Intraday Chart
⚔️ Gladiator Strategy Update
ATR: 159.12
IB Range: 114.45 → Wide
Market Structure: balanced
Trade Highlights:
11:45 Short Trade → SL Hit
📌 Support & Resistance Levels
Resistance Zones:
25,340 ~ 25,385
25,425 ~ 25,460
25,500 (Psychological Level)
25,535
Support Zones:
25,307
25,290
25,275 ~ 25,260
25,240
💡 Final Thoughts
The market delivered a sharp fall early, followed by a dull range-bound trap. The weak Evening Star variation hints that momentum is fading.
👉 Bulls must reclaim 25,400+, else a drift toward 25,200 cannot be ruled out.
📖 “Markets often whisper before they shout — today was one such whisper of caution.”
✏️ Disclaimer
This is just my personal viewpoint. Always consult your financial advisor before taking any action.

Nifty levels - Sep 22, 2025Nifty support and resistance levels are valuable tools for making informed trading decisions, specifically when combined with the analysis of 5-minute timeframe candlesticks and VWAP. By closely monitoring these levels and observing the price movements within this timeframe, traders can enhance the accuracy of their entry and exit points. It is important to bear in mind that support and resistance levels are not fixed, and they can change over time as market conditions evolve.
The dashed lines on the chart indicate the reaction levels, serving as additional points of significance to consider. Furthermore, take note of the response at the levels of the High, Low, and Close values from the day prior.
We hope you find this information beneficial in your trading endeavors.
* If you found the idea appealing, kindly tap the Boost icon located below the chart. We encourage you to share your thoughts and comments regarding it.
Wishing you success in your trading activities!

NIFTY Intraday Levels for 19th SEP 2025Market short view:
As of now GIFTNIFTY Traded @ 25451 made a Low @ 25416.50 ,
Showing BEARISH TREND Compare to NIFTY Fut @ 25510.90 Closed at 3.30 pm.
If this trend continues Probability of “-ve to Flat” Opening
Though Nifty 50 Index is currently showing a Bullish Trend as indicated by the formation of an Ascending Channel. This pattern is characterized by Higher HIGHs and Higher LOWs, technically suggesting a continued UP-ward momentum. The price is well above 20 EMA 50EMA as well as 200 EMA, reinforcing the bullish sentiment.
Chart Patterns: Ascending Channel Higher HIGHs Higher LOW
Indicator View: Opportunity for further gains.
RSI (Daily) => 68.37 (Less Than 70 Some Steam Left, Technical mening)
Stoch (Both %K & %D): Above 90
CCI => 130.22 .
MACD => witnessing a Bullish Crossover .
Positional / SWING levels:
Supports: 25090 – 24846 – 24530 …
Resistances: 25421 – 25670 – 25985.
# "WEEKLY Levels" mentioned in BOX format.
^^^^^^^ Plot Levels Using 3 Min, 5 Min Time frame in your Chart for Better Analysis ^^^^^^^
L#1: If the candle crossed & stays above the “Buy Gen”, it is treated / considered as Bullish bias.
L#2: Possibility / Probability of REVERSAL near RLB#1 & UBTgt
L#3: If the candle stays above “Sell Gen” but below “Buy Gen”, it is treated / considered as Sidewise. Aggressive Traders can take Long position near “Sell Gen” either retesting or crossed from Below & vice-versa i.e. can take Short position near “Buy Gen” either retesting or crossed downward from Above.
L#4: If the candle crossed & stays below the “Sell Gen”, it is treated / considered a Bearish bias.
L#5: Possibility / Probability of REVERSAL near RLS#1 & USTgt
HZB (Buy side) & HZS (Sell side) => Hurdle Zone,
*** Specialty of “HZB#1, HZB#2 HZS#1 & HZS#2” is Sidewise (behaviour in Nature)
Rest Plotted and Mentioned on Chart
Color code Used:
Green =. Positive bias.
Red =. Negative bias.
RED in Between Green means Trend Finder / Momentum Change
/ CYCLE Change and Vice Versa.
Notice One thing: HOW LEVELS are Working.
Use any Momentum Indicator / Oscillator or as you "USED to" to Take entry.
📢 Disclaimer
I am not a SEBI-registered financial adviser.
The information, views, and ideas shared here are purely for educational and informational purposes only. They are not intended as investment advice or a recommendation to buy, sell, or hold any financial instruments.
Trading and investing in the stock market involves risk, and you should do your own research and analysis. You are solely responsible for any decisions made based on this research.
"As HARD EARNED MONEY IS YOUR's, So DECISION SHOULD HAVE TO BE YOUR's".

nifty setup for 18/09/202525340-25280 no trading zone .
retailers dont getting trape .
safe side trading after 11 am.
25340 above tgt-25400/25500
25280 below tgt-25220/25100
today strict range follow for tomorrow volatile.

Nifty Analysis EOD – September 18, 2025 – Thursday🟢 Nifty Analysis EOD – September 18, 2025 – Thursday 🔴
Gap-Up Test, Triangle Breakdown, and Sharp Recovery
🗞 Nifty Summary
Nifty opened with a 111-point gap-up at 25,441, right near our target zone of 25,460. The first 10 minutes formed an IB range of 55 points, and for the next 3 hours the index consolidated inside this band, shaping a symmetrical triangle pattern. (Refer to the 5 min Chart)
At 12:30 PM, the triangle broke down, and within 30 minutes its pattern target was achieved. In this move, Nifty not only filled the opening gap but also broke below R1 and PDH. At that stage, PDC, CPR, and the previous day’s resistance zone at 25,340 acted as strong support.
From there, a sudden 100-point sharp recovery pulled the index back to the mid-point of the earlier triangle. Nifty closed at 25,420, just 28 points below the day’s high.
📌 Yesterday’s note said:
Bulls face resistance at 25,340, breakout above it could open 25,460+ ✅ (tested in gap-up).
Sideways consolidation may happen ✅ (saw 3+ hours).
Pullback for gap-filling likely ✅ (done by mid-session).
📌 Yesterday’s note end:
👉 What wasn’t expected: the late-session sharp recovery, which shows bulls are still alive but lack strength to break new highs decisively. Tomorrow’s session becomes a litmus test for bulls — they must cross today’s high and close above 25,450 to keep momentum intact.
🛡 5 Min Intraday Chart with Levels
📉 Daily Time Frame Chart with Intraday Levels
🕯 Daily Candle Breakdown
Open: 25,441.05
High: 25,448.95
Low: 25,329.75
Close: 25,423.60
Change: +93.35 (+0.37%)
🏗️ Structure Breakdown
Red candle (Close < Open), yet index closed higher vs yesterday’s close.
Body: ~17.45 points (small).
Upper wick: ~7.90 points.
Lower wick: ~93.85 points (long).
Close is slightly below open but far above the day’s low → strong intraday recovery.
📚 Interpretation
Opened strong, extended slightly to 25,449, then fell to 25,330.
Buyers defended support and absorbed selling pressure, pulling back to 25,420.
Despite closing red, the candle reflects bullish undertone with demand at lower levels.
🕯Candle Type
Hammer-like candle → long lower shadow, small real body near the high. Suggests support defence and dip-buying strength.
📉📈 Short-Term View – September 19, 2025
Support: 25,330 (today’s low).
Resistance: 25,445–25,450 (today’s high).
👉 Sustaining above 25,330 keeps the bullish structure intact.
👉 Breakout above 25,450 could open doors to 25,535–25,550.
🛡 5 Min Intraday Chart
⚔️ Gladiator Strategy Update
ATR: 160.98
IB Range: 55.15 → Medium
Market Structure: ImBalanced
Trade Highlights:
12:30 PM – Short Trigger → Target Achieved (R:R = 1:3.59)
📌 Support & Resistance Levels
Resistance Zones:
25,460
25,500 (Psychological)
25,535
Support Zones:
25,385
25,340
25,307 ~ 25,290
25,275 ~ 25,260 (Previous Day Low & Gap)
💡 Final Thoughts
The day perfectly tested the upper target, retraced for gap fill, and rebounded sharply. Bulls showed resilience but need confirmation. Tomorrow is key: above 25,450 = continuation; below 25,330 = weakness resurfaces.
📖 “Markets often test your conviction by shaking you out before the real move begins.”
✏️ Disclaimer
This is just my personal viewpoint. Always consult your financial advisor before taking any action.

NIFTY Levels for 18th SEP 2025 onwards.NIFTY Intraday Levels for 18th SEP 2025
Market Short View:
Nifty 50 Index is currently showing a Bullish Trend as indicated by the formation of an Ascending Channel. This pattern is characterized by Higher HIGHs and Higher LOWs, technically suggesting a continued UPward momentum. The price is well above 20 EMA 50EMA as well as 200 EMA, reinforcing the bullish sentiment.
Chart Patterns: Ascending Channel Higher HIGHs Higher LOW
Indicator View: Opportunity for further gains.
RSI < 70 => Overbought, Technical mening
CCI => 111.58 Crossed above 100 from Low.
MACD => witnessing a Bullish Crossover.
SWING levels:
Supports: 25090 – 24846 – 24530
Resistances: 25421 – 25670 – 25985
My personal View: NEUTRAL Stance.
# "WEEKLY Levels" mentioned in BOX format.
^^^^^^^ Plot Levels Using 3 Min, 5 Min Time frame in your Chart for Better Analysis ^^^^^^^
L#1: If the candle crossed & stays above the “Buy Gen”, it is treated / considered as Bullish bias.
L#2: Possibility / Probability of REVERSAL near RLB#1 & UBTgt
L#3: If the candle stays above “Sell Gen” but below “Buy Gen”, it is treated / considered as Sidewise. Aggressive Traders can take Long position near “Sell Gen” either retesting or crossed from Below & vice-versa i.e. can take Short position near “Buy Gen” either retesting or crossed downward from Above.
L#4: If the candle crossed & stays below the “Sell Gen”, it is treated / considered a Bearish bias.
L#5: Possibility / Probability of REVERSAL near RLS#1 & USTgt
HZB (Buy side) & HZS (Sell side) => Hurdle Zone,
*** Specialty of “HZB#1, HZB#2 HZS#1 & HZS#2” is Sidewise (behaviour in Nature)
Rest Plotted and Mentioned on Chart
Color code Used:
Green =. Positive bias.
Red =. Negative bias.
RED in Between Green means Trend Finder / Momentum Change
/ CYCLE Change and Vice Versa.
Notice One thing: HOW LEVELS are Working.
Use any Momentum Indicator / Oscillator or as you "USED to" to Take entry.
📢 Disclaimer
I am not a SEBI-registered financial adviser.
The information, views, and ideas shared here are purely for educational and informational purposes only. They are not intended as investment advice or a recommendation to buy, sell, or hold any financial instruments.
Trading and investing in the stock market involves risk, and you should do your own research and analysis. You are solely responsible for any decisions made based on this research.
"As HARD EARNED MONEY IS YOUR's, So DECISION SHOULD HAVE TO BE YOUR's".
Nifty levels - Sep 19, 2025Nifty support and resistance levels are valuable tools for making informed trading decisions, specifically when combined with the analysis of 5-minute timeframe candlesticks and VWAP. By closely monitoring these levels and observing the price movements within this timeframe, traders can enhance the accuracy of their entry and exit points. It is important to bear in mind that support and resistance levels are not fixed, and they can change over time as market conditions evolve.
The dashed lines on the chart indicate the reaction levels, serving as additional points of significance to consider. Furthermore, take note of the response at the levels of the High, Low, and Close values from the day prior.
We hope you find this information beneficial in your trading endeavors.
* If you found the idea appealing, kindly tap the Boost icon located below the chart. We encourage you to share your thoughts and comments regarding it.
Wishing you success in your trading activities!

Gold as a Safe HavenWhy Global Investors Turn to Gold During Market Uncertainty
1. The Concept of a Safe Haven
A safe haven is an investment that retains or increases its value during periods of financial market stress or economic instability. Such assets offer investors protection against volatility, uncertainty, and systemic risks. Typical safe havens include:
Gold – A tangible store of value.
U.S. Treasury Bonds – Backed by the U.S. government.
Swiss Franc – A stable currency often seen as a hedge against global turmoil.
Japanese Yen – Another defensive currency.
Among these, gold stands out because it has both intrinsic value and historical precedent. Unlike currencies, which are tied to governments and central banks, gold is independent of political promises. Unlike corporate bonds or stocks, it doesn’t rely on business performance. This makes gold universally attractive as a hedge in uncertain times.
2. Historical Significance of Gold
To understand gold’s safe haven status, it is essential to trace its history:
a) Gold as Money
For thousands of years, gold served as money. From the Lydians minting the first gold coins in the 7th century BCE to the widespread use of gold coins across empires, gold became synonymous with value.
b) The Gold Standard
In the 19th and early 20th centuries, most economies adhered to the gold standard, where currencies were directly backed by gold. This system provided monetary stability, limiting inflation because money supply was tied to gold reserves.
c) End of the Gold Standard
In 1971, the U.S. under President Nixon abandoned the gold standard, ending the Bretton Woods system. Currencies became “fiat” (backed by government decree rather than physical assets). Despite this, gold’s importance didn’t vanish—it simply shifted from being official money to being a key hedge and investment asset.
d) Gold During Crises
Throughout history, gold prices have surged during crises:
During the Great Depression of the 1930s, gold was hoarded as banks collapsed.
In the 1970s, oil shocks and inflation pushed gold prices to record highs.
During the 2008 Global Financial Crisis, gold soared while equities collapsed.
In the COVID-19 pandemic (2020), gold hit record highs as markets plunged.
3. Why Investors Turn to Gold During Market Uncertainty
There are several reasons why gold is considered a safe haven:
a) Scarcity and Limited Supply
Gold cannot be created at will. Unlike paper money, central banks cannot print gold. Mining new gold is expensive and time-consuming, meaning supply growth is limited. This scarcity supports its long-term value.
b) Universal Acceptance
Gold is universally recognized across cultures and borders. Whether in Asia, Europe, Africa, or the Americas, gold carries intrinsic appeal. In times of crisis, this universal acceptance makes gold highly liquid and tradable.
c) Inflation Hedge
Gold is often seen as a hedge against inflation. When central banks print excessive money or when the purchasing power of currencies declines, gold tends to rise in value. For instance, in the 1970s, U.S. inflation soared, and so did gold prices.
d) Protection Against Currency Depreciation
When a country’s currency weakens, investors often shift to gold. For example, during the Eurozone debt crisis, European investors moved capital into gold to avoid potential currency collapses.
e) Store of Value in Geopolitical Turmoil
Wars, political instability, or trade tensions often trigger a flight to gold. During the Russia-Ukraine war (2022), investors flocked to gold, fearing disruptions in global trade and energy supplies.
f) Low Correlation with Other Assets
Gold has a low or even negative correlation with assets like equities and bonds. This means when markets fall, gold often rises, making it an excellent diversification tool in a portfolio.
4. Case Studies of Gold as a Safe Haven
a) The 2008 Financial Crisis
The collapse of Lehman Brothers and subsequent market meltdown saw investors rushing to gold. Between 2007 and 2011, gold prices nearly doubled, reaching $1,900 per ounce in 2011.
b) The COVID-19 Pandemic (2020)
As global markets crashed in March 2020, gold initially dipped due to liquidity demands but soon rallied to record highs above $2,000 per ounce by August 2020.
c) Inflationary Pressures (2021–2023)
With central banks printing trillions in stimulus, inflation spiked worldwide. Gold again acted as a hedge, maintaining strong demand despite rising interest rates.
5. How Investors Use Gold
Investors have multiple ways to gain exposure to gold:
Physical Gold – Bars, coins, jewelry (traditional and safe but involves storage costs).
Gold ETFs – Exchange-traded funds like SPDR Gold Trust (GLD) allow easy trading.
Gold Futures & Options – For traders seeking leveraged exposure.
Gold Mining Stocks – Companies engaged in gold production often benefit from rising prices.
Central Bank Reserves – Nations hold gold reserves as insurance against currency crises.
6. The Psychology of Gold Investment
Gold is not just a financial asset—it is deeply tied to human psychology. In uncertain times, people want something tangible and timeless. Unlike digital assets or government bonds, gold provides a sense of security rooted in thousands of years of human experience. This psychological factor explains why, even in modern times, gold demand rises sharply during market panic.
Conclusion
Gold’s enduring reputation as a safe haven asset stems from its scarcity, universal acceptance, ability to hedge against inflation and currency depreciation, and low correlation with other asset classes. History has repeatedly shown that during wars, recessions, financial crises, and inflationary spirals, gold protects wealth when other assets fail.
Although gold is not without limitations—it generates no yield and can be volatile—it remains one of the most trusted hedges against uncertainty. In an era of rising global instability, central bank money printing, and volatile equity markets, the ancient allure of gold is unlikely to fade.
For investors seeking stability in an uncertain world, gold continues to glitter as the ultimate safe haven.

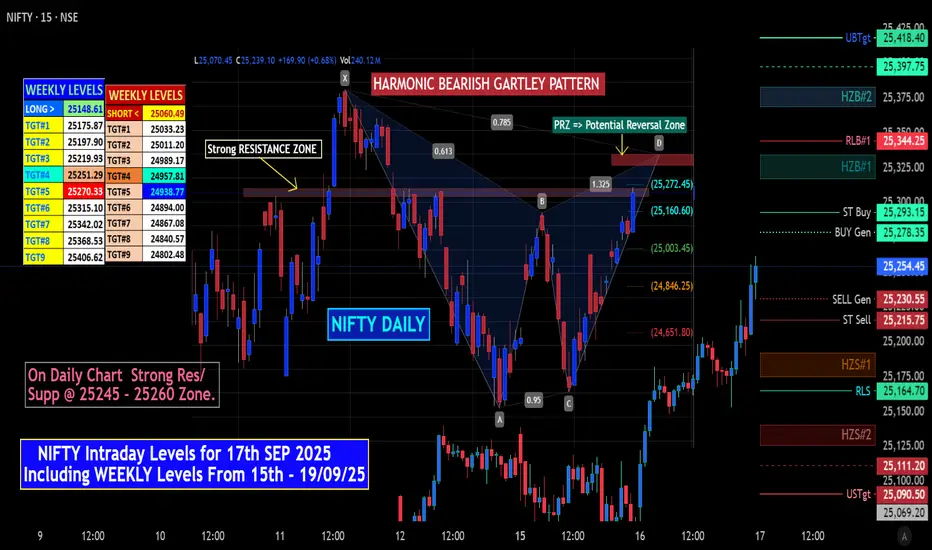
Harmonic Patterns In NIFTYHarmonic patterns are advanced technical analysis tools used in trading to identify potential price reversals or continuations in financial markets, including indices like the NIFTY 50 (the benchmark index of the National Stock Exchange of India). These patterns are based on Fibonacci ratios (e.g., 0.618, 0.786, 1.272, 1.618) and form specific geometric structures across price swings, helping traders predict key levels for entries, stops, and targets. They are particularly popular among swing and position traders for their precision in volatile markets like NIFTY, which is influenced by domestic and global factors such as economic data, corporate earnings, and geopolitical events.
Key Harmonic Patterns and Their Relevance to NIFTY
Harmonic patterns typically consist of four points (X, A, B, C, D) representing price swings. Here's a brief overview of the most common ones, with examples of how they've appeared in NIFTY or related indices recently:
AB = 0.618
XA; BC = 0.382-0.886
Seen in NIFTY's D charts .TARGET AROUND 25500-25521

NIFTY Technical Outlook: Breakout Backed by Trade Talk Optimism.NIFTY has successfully broken the resistance level of 25,150 and is holding steady above it. A retest of this level could provide a good entry opportunity, with the next target at 25,550.
The market is maintaining a steady uptrend, largely supported by optimism around the resumption of trade talks between India and the USA. Hopes of a potential trade deal are fueling positive sentiment.
However, traders should remain cautious — any delay or setback in negotiations could quickly trigger downside pressure. If you plan to take a position, it’s wise to manage risk carefully, trade with smaller quantities, and keep positions light.
Nifty trying to break the shackles and breakout. Nifty gave a great closing above important Fibonacci resistance. Today Nifty closed at 25239 which is fairly above the Fibonacci resistance at 25152. The next Fibonacci resistance is at 25378 which is also a Trend line resistance.
Before reaching there the resistance just round the corner is at 25244. So the key resistance now are at 25244 and 25378. Above 25378 there is possibility of very strong bullish breakout which can lead Nifty towards 25554 and 25669. Supports for Nifty currently remain at 25152, 24994 both Fibonacci levels.
Mother line support of daily chart remains at 24844. Shadow of the candle right now neutral as the RSI on hourly chart is getting into overbought zone. RSI however on the daily chart still shows more room to grow.
Disclaimer: The above information is provided for educational purpose, analysis and paper trading only. Please don't treat this as a buy or sell recommendation for the stock or index. The Techno-Funda analysis is based on data that is more than 3 months old. Supports and Resistances are determined by historic past peaks and Valley in the chart. Many other indicators and patterns like EMA, RSI, MACD, Volumes, Fibonacci, parallel channel etc. use historic data which is 3 months or older cyclical points. There is no guarantee they will work in future as markets are highly volatile and swings in prices are also due to macro and micro factors based on actions taken by the company as well as region and global events. Equity investment is subject to risks. I or my clients or family members might have positions in the stocks that we mention in our educational posts. We will not be responsible for any Profit or loss that may occur due to any financial decision taken based on any data provided in this message. Do consult your investment advisor before taking any financial decisions. Stop losses should be an important part of any investment in equity.
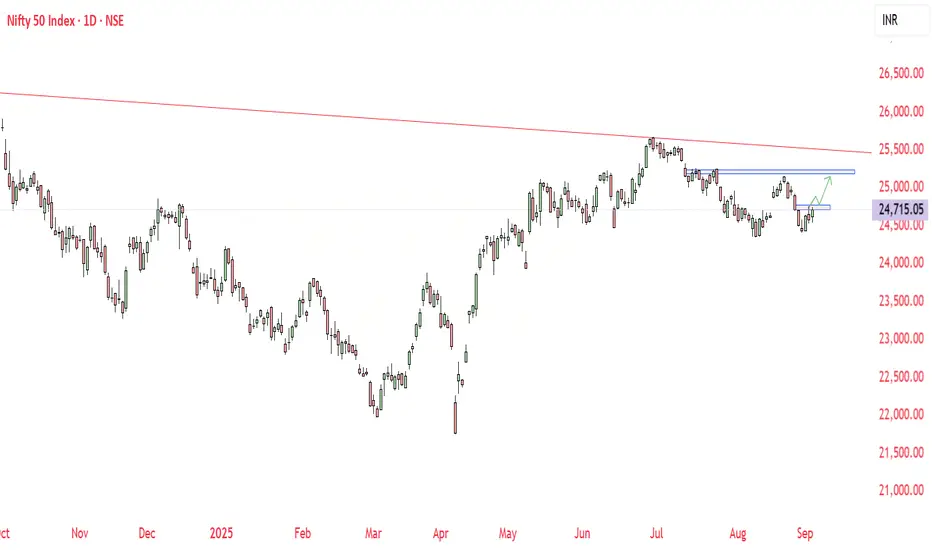
NIFTY 50 - Weekend ViewNifty may see 25200 this weekend, looking at US tariff relief on India. Just an technical view.
Overall Nifty 50 making lower highs since it made ATH. Not much upside seen, it may do 25200 then again we may see reverse.
Do your own research before taking any trade. This chart is only for educational purpose.
Nifty levels - Sep 18, 2025Nifty support and resistance levels are valuable tools for making informed trading decisions, specifically when combined with the analysis of 5-minute timeframe candlesticks and VWAP. By closely monitoring these levels and observing the price movements within this timeframe, traders can enhance the accuracy of their entry and exit points. It is important to bear in mind that support and resistance levels are not fixed, and they can change over time as market conditions evolve.
The dashed lines on the chart indicate the reaction levels, serving as additional points of significance to consider. Furthermore, take note of the response at the levels of the High, Low, and Close values from the day prior.
We hope you find this information beneficial in your trading endeavors.
* If you found the idea appealing, kindly tap the Boost icon located below the chart. We encourage you to share your thoughts and comments regarding it.
Wishing you success in your trading activities!

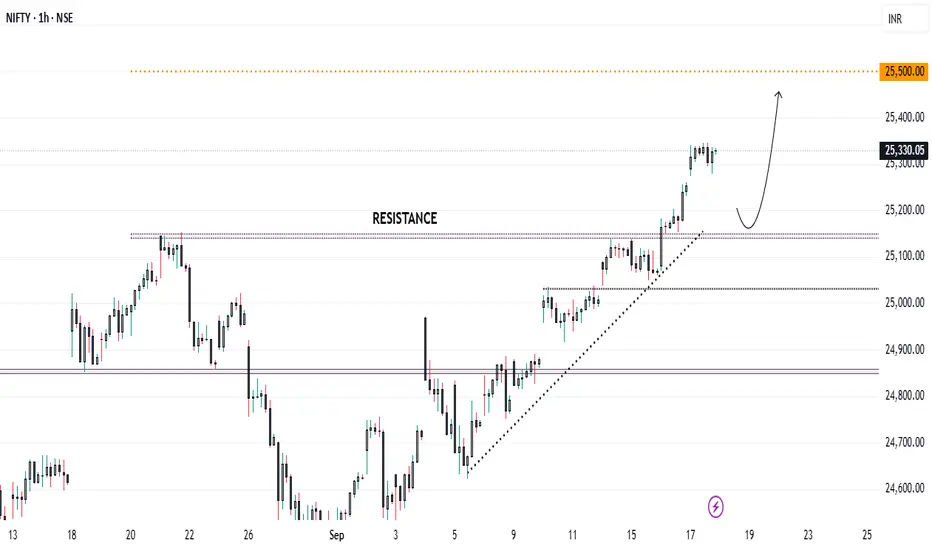
NIFTY Intraday Levels for 17th SEP 2025 & SWING PointsMarket Analysis:
NIFTY 50 Index is currently showing Bullish sentiment as it moves within an Ascending Channel (in Daily Chart ), indicating a potential upward trend continuation.
Though formed Bearish Harmonic Gartley Pattern havimg PRZ Near "25345 - 25395" Zone , signaling profit taking at any point of time on Above mentioned zone..
Indicator & Oscillator Short Analysis: "The price is above the 50-period moving average, suggesting a positive momentum. A Bullish MACD crossover further supports the upward movement, providing additional confirmation for potential buying interest.
Major Support levels Shifted from lower level near 24750 - 24850 to at 25110 - 25090 and 25000 ,
while resistance levels at 25345, 24395 and 25418 mark .
# "WEEKLY Levels" mentioned in BOX format.
^^^^^^^ Plot Levels Using 3 Min, 5 Min Time frame in your Chart for Better Analysis ^^^^^^^
L#1: If the candle crossed & stays above the “Buy Gen”, it is treated / considered as Bullish bias.
L#2: Possibility / Probability of REVERSAL near RLB#1 & UBTgt
L#3: If the candle stays above “Sell Gen” but below “Buy Gen”, it is treated / considered as Sidewise. Aggressive Traders can take Long position near “Sell Gen” either retesting or crossed from Below & vice-versa i.e. can take Short position near “Buy Gen” either retesting or crossed downward from Above.
L#4: If the candle crossed & stays below the “Sell Gen”, it is treated / considered a Bearish bias.
L#5: Possibility / Probability of REVERSAL near RLS#1 & USTgt
HZB (Buy side) & HZS (Sell side) => Hurdle Zone,
*** Specialty of “HZB#1, HZB#2 HZS#1 & HZS#2” is Sidewise (behaviour in Nature)
Rest Plotted and Mentioned on Chart
Color code Used:
Green =. Positive bias.
Red =. Negative bias.
RED in Between Green means Trend Finder / Momentum Change
/ CYCLE Change and Vice Versa.
Notice One thing: HOW LEVELS are Working.
Use any Momentum Indicator / Oscillator or as you "USED to" to Take entry.
📢 Disclaimer
I am not a SEBI-registered financial adviser.
The information, views, and ideas shared here are purely for educational and informational purposes only. They are not intended as investment advice or a recommendation to buy, sell, or hold any financial instruments.
Trading and investing in the stock market involves risk, and you should do your own research and analysis. You are solely responsible for any decisions made based on this research.
"As HARD EARNED MONEY IS YOUR's, So DECISION SHOULD HAVE TO BE YOUR's".
Nifty 50 : Crossed an important resistance level of 25300Nifty 50 : After a Buy signal was triggered just few sessions back ,it crossed an important resistance level of 25300 today. Hoping to close it above it . Next resistance is at 25600.
( Not a Buy / Sell Recommendation
Do your own due diligence ,Market is subject to risks, This is my own view and for learning only .)

Global Supply Chain Disruptions1. Understanding Global Supply Chains
What is a Supply Chain?
A supply chain is the entire network of individuals, organizations, resources, activities, and technologies involved in creating and delivering a product. It includes:
Sourcing raw materials (mining metals, growing crops, drilling oil).
Manufacturing and production (turning raw materials into components or finished products).
Logistics and transportation (shipping goods via sea, air, rail, or road).
Distribution and retail (warehouses, online platforms, supermarkets, etc.).
End consumers (people or businesses buying the final product).
When this network is stretched across borders, it becomes a global supply chain.
Why Globalization Made Supply Chains Complex
From the 1980s onward, globalization and free trade agreements encouraged companies to outsource production to low-cost countries. For example:
Clothing brands shifted manufacturing to Bangladesh, Vietnam, and China.
Electronics companies sourced chips from Taiwan and South Korea.
Automakers relied on a global network of suppliers for engines, batteries, and steel.
This “just-in-time” model reduced costs by minimizing inventory and maximizing efficiency—but it also created fragility. A delay in one part of the world could stall the entire chain.
2. Causes of Global Supply Chain Disruptions
Global supply chains face disruptions from multiple sources. These can be broadly classified into natural, political, economic, technological, and human-related factors.
A. Natural Disasters & Pandemics
COVID-19 Pandemic (2020–2022): Factories in China shut down, shipping routes froze, and workers stayed home. This caused a shortage of everything—from masks and medicines to electronics and automobiles.
2011 Japan Earthquake & Tsunami: Disrupted production of automotive and electronic components, particularly semiconductors.
Hurricane Katrina (2005): Crippled oil production and refined products supply in the U.S.
Nature remains an unpredictable factor that no supply chain can fully eliminate.
B. Geopolitical Tensions & Wars
Russia-Ukraine War (2022–present): Disrupted supplies of wheat, corn, natural gas, and oil. Many countries dependent on Ukraine’s grain faced food shortages.
US-China Trade War (2018–2020): Tariffs and sanctions disrupted technology and manufacturing supply chains, particularly electronics.
Middle East conflicts: Threaten oil shipping routes, especially through chokepoints like the Suez Canal and Strait of Hormuz.
C. Economic Factors
Inflation & Currency Fluctuations: Rising costs of raw materials, fuel, and labor make global shipping expensive.
Labor Strikes: Dock workers, truckers, or airline staff strikes can paralyze logistics.
Global Recession Risks: Lower demand impacts supply chain planning and inventory cycles.
D. Logistical Bottlenecks
Port Congestion: During COVID, ports like Los Angeles and Shanghai saw ships waiting weeks to unload containers.
Shipping Container Shortages: Containers were stuck in the wrong places due to demand imbalances.
Ever Given Incident (2021): A single container ship blocking the Suez Canal for 6 days disrupted global trade worth billions.
E. Technological & Cyber Risks
Cyberattacks: Ransomware on logistics companies or ports can freeze operations. Example: The 2017 NotPetya attack crippled Maersk’s shipping systems.
Digital Dependency: Overreliance on automated systems means even small software glitches can cause major delays.
F. Human-Related Issues
Labor Shortages: Truck drivers in Europe and the U.S. remain in short supply, delaying goods movement.
Policy Changes: Sudden government restrictions, environmental regulations, or export bans (like India’s ban on rice exports in 2023) can shake global markets.
3. Impacts of Global Supply Chain Disruptions
Supply chain disruptions ripple across industries, economies, and societies.
A. Economic Impacts
Inflation: Shortages push prices up. Example: Chip shortages raised car prices worldwide.
GDP Slowdowns: Countries dependent on exports face reduced growth.
Business Losses: Companies lose revenue when they can’t deliver products on time.
B. Industry-Specific Impacts
Automobiles: Car production lines halted due to semiconductor shortages.
Electronics: Smartphone and laptop makers struggled to meet pandemic-driven demand.
Healthcare: Shortages of PPE, medicines, and vaccines during COVID.
Food Industry: Rising costs of grains, fertilizers, and shipping raised food prices globally.
C. Social Impacts
Job Losses: Factory shutdowns affect millions of workers.
Consumer Stress: Empty shelves and higher prices cause frustration.
Inequality: Developing countries face harsher consequences, especially with food and medicine shortages.
D. Strategic Impacts
Shift in Global Trade Alliances: Countries reduce dependency on adversarial nations.
Rise of Protectionism: More countries adopt “self-sufficiency” policies.
Rethinking Efficiency vs. Resilience: Businesses now focus on balancing cost-cutting with security.
4. Real-World Case Studies
Case 1: The Semiconductor Shortage (2020–2023)
Triggered by COVID lockdowns and surging demand for electronics.
Car makers like Ford and Toyota halted production.
Waiting times for laptops, gaming consoles, and phones increased.
Case 2: Suez Canal Blockage (2021)
The Ever Given, a giant container ship, blocked the canal.
12% of global trade was stuck for nearly a week.
Cost global trade $9 billion per day in delays.
Case 3: Russia-Ukraine War (2022)
Ukraine, known as the “breadbasket of Europe,” saw grain exports collapse.
Energy markets destabilized as Europe scrambled for alternatives to Russian gas.
Shipping in the Black Sea faced risks, raising insurance and freight costs.
5. How Companies and Governments are Responding
A. Diversification of Supply Chains
Moving production from China to Vietnam, India, Mexico, and Eastern Europe.
“China + 1” strategy gaining momentum.
B. Reshoring and Nearshoring
Bringing production closer to home to reduce dependency.
Example: U.S. investing in domestic semiconductor manufacturing (CHIPS Act 2022).
C. Technology and Digitalization
AI and big data for better demand forecasting.
Blockchain for transparent tracking of shipments.
Automation in warehouses and ports to reduce labor dependency.
D. Strategic Stockpiling
Governments and companies building reserves of essential goods.
Example: Many countries stockpiling rare earth minerals and semiconductors.
E. Sustainability & Green Supply Chains
Shift toward renewable energy in logistics.
Electric trucks, biofuels, and carbon-neutral shipping.
Recycling and circular supply chains to reduce waste.
Conclusion
Global supply chain disruptions have shown the fragility of a hyperconnected world. While globalization brought efficiency and low costs, it also introduced systemic risks. Pandemics, wars, natural disasters, and political decisions can now paralyze industries thousands of miles away.
The lesson for businesses and governments is clear: resilience is as important as efficiency. The future of supply chains will depend on diversification, digitalization, and sustainability. Those who adapt quickly will thrive, while those who remain over-reliant on fragile links may face constant disruptions.
In essence, global supply chain disruptions are not just logistical problems—they are economic, political, and social challenges that shape the future of globalization itself.
