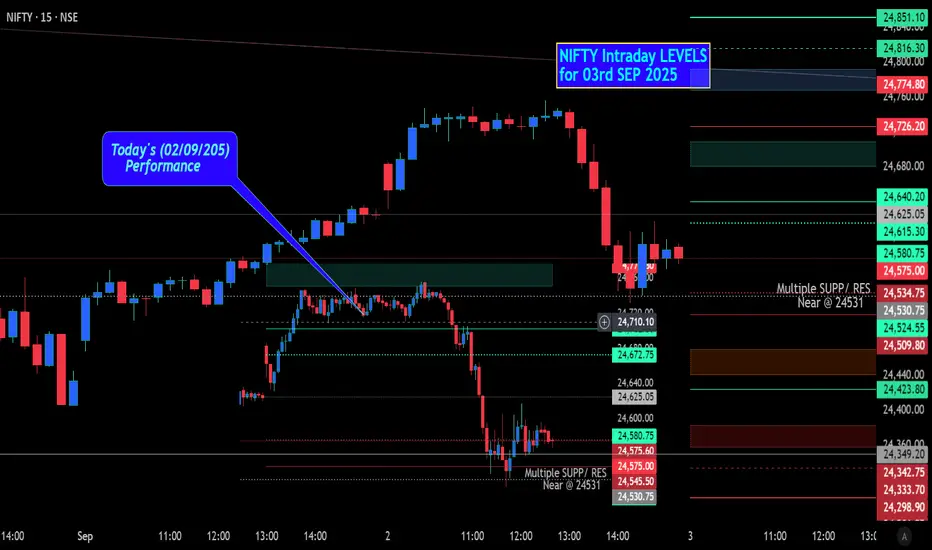
NIFTY Intraday Level for 03rd SEP 2025All Plotted and Mentioned on Chart.
Colour code:
Green =. Positive bias.
Red =. Negative bias.
RED in Between Green means Trend Finder / Momentum Change
/ CYCLE Change and Vice Versa.
Notice One thing: HOW LEVELS are Working.
Use any Momentum Indicator / Oscillator as you "USED to" to Take entry.
Disclaimer: Study Purpose only.
INDIA50CFD trade ideas
Nifty levels - Sep 03, 2025Nifty support and resistance levels are valuable tools for making informed trading decisions, specifically when combined with the analysis of 5-minute timeframe candlesticks and VWAP. By closely monitoring these levels and observing the price movements within this timeframe, traders can enhance the accuracy of their entry and exit points. It is important to bear in mind that support and resistance levels are not fixed, and they can change over time as market conditions evolve.
The dashed lines on the chart indicate the reaction levels, serving as additional points of significance to consider. Furthermore, take note of the response at the levels of the High, Low, and Close values from the day prior.
We hope you find this information beneficial in your trading endeavors.
* If you found the idea appealing, kindly tap the Boost icon located below the chart. We encourage you to share your thoughts and comments regarding it.
Wishing you success in your trading activities!

NIFTY KEY LEVELS FOR 02.09.2025NIFTY KEY LEVELS FOR 02.09.2025
RTF: 3 Minutes
If the candle stays above the pivot point, it is considered a bullish bias; if it remains below, it indicates a bearish bias. Price may reverse near Resistance 1 or Support 1. If it moves further, the next potential reversal zone is near Resistance 2 or Support 2. If these levels are also broken, we can expect the trend.
If the range(R2-S2) is narrow, the market may become volatile or trend strongly. If the range is wide, the market is more likely to remain sideways
📢 Disclaimer
I am not a SEBI-registered financial adviser.
The information, views, and ideas shared here are purely for educational and informational purposes only. They are not intended as investment advice or a recommendation to buy, sell, or hold any financial instruments.
Please consult with your SEBI-registered financial advisor before making any trading or investment decisions.
Trading and investing in the stock market involves risk, and you should do your own research and analysis. You are solely responsible for any decisions made based on this research.

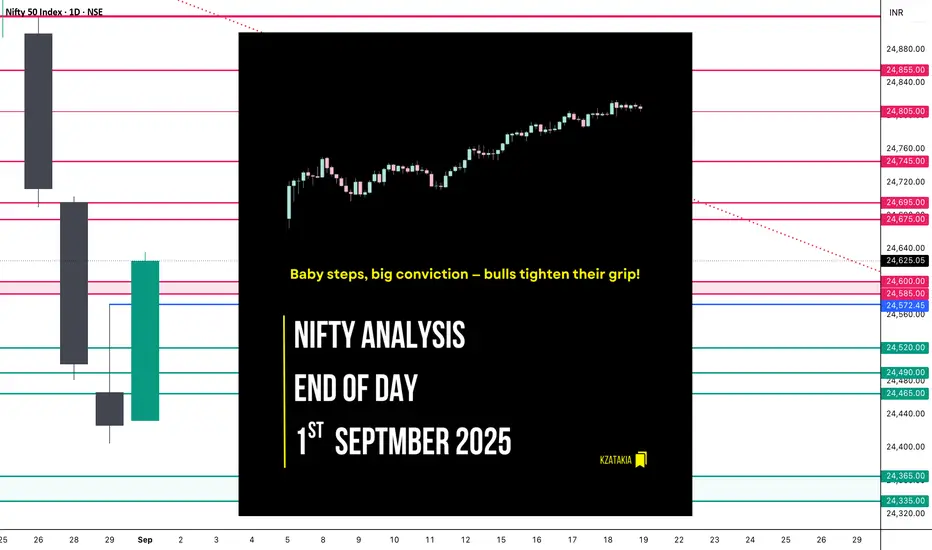
Nifty Analysis EOD - September 1, 2025 - Monday🟢 Nifty Analysis EOD - September 1, 2025 - Monday 🔴
Baby steps, big conviction — bulls tighten their grip!
🗞 Nifty Summary
Nifty opened with a 47-point gap-up, carrying a positive vibe. The index extended gains by nearly 80 points, marking a high of 24,560.85 before slipping back to 24,500. There it found strong support and gradually climbed to break IB High and later breach PDH.
Step by step, bulls showcased steady dominance, ultimately closing at 24,624.15, a solid 190-point gain. The daily timeframe formed a Bullish Marubozu candle, breaking out and closing above the Previous Day High — a decisive statement from buyers.
🛡 5 Min Intraday Chart with Levels
🚶 Intraday Walk
Opened gap-up +47 points.
Climbed ~80 points, touched 24,560.85.
Pulled back to 24,500, took support.
Gradually rose, broke IB High, then PDH.
Closed at 24,624.15, strong bullish grip intact.
📉 Daily Time Frame Chart with Intraday Levels
🕯️ Daily Candle Breakdown
Open: 24,432.70
High: 24,635.60
Low: 24,432.70
Close: 24,625.05
Change: +198.20 (+0.81%)
🏗️ Structure Breakdown
Green candle (Close > Open).
Body: 192.35 points → strong, dominant.
Upper wick: ~10.55 points (negligible).
Lower wick: 0 (open = low).
🕯Candle Type
Bullish Marubozu (near perfect).
📚 Interpretation
Market opened at low, never looked back.
Strong buying all day, closing at peak.
After 3 days of selling (23–25 Aug), this candle marks first solid bullish comeback.
Short-Term View
Support: 24,430 (today’s low & open).
Resistance: 24,635 (today’s high) → breakout may target ~24,800.
Trend Context: After a bearish continuation, today signals a bullish reversal. Needs follow-through buying in the next 1–2 sessions.
🛡 5 Min Intraday Chart
⚔️ Gladiator Strategy Update
ATR: 201.88
IB Range: 93.05 → Medium
Market Structure: Balanced
Trade Highlights
12:25 → Long trade triggered - Trailing SL hit ( R:R = 1 : 1.16 )
📌 Support & Resistance Levels
Resistance Zones
24,675 ~ 24,695
24,745
24,805
24,855
Support Zones
24,575
24,520
24,490 ~ 24,465
🔮 What’s Next? / Bias Direction
Momentum has shifted in favour of bulls, with today’s Marubozu breakout signalling strong conviction. As long as Nifty sustains above 24,500–24,520 zone, buyers remain in control. A clean break above 24,635 opens the gates for 24,800 and beyond.
💭 Final Thoughts
Today’s action reminded us: “Trends don’t announce themselves, they whisper first — and today’s candle was a loud hint.”
✏️ Disclaimer
This is just my personal viewpoint. Always consult your financial advisor before taking any action.
Nifty delicately placed near resistance zones. Today we have seen Good recovery by Nifty on the back of extraordinary GDP numbers of 7.8% in the last Quarter. Now Nifty is delicately placed with chances of V shaped recovery if it can surpass 4 major hurdles,
The resistances are at Mid RSI channel resistance near 24640, Mother line resistance at 24690 (hourly chart), Trend line resistance near 24766 and Father line resistance near 24800 (hourly chart). If we get a closing above 24800 then the doors for 24927, 25015 and 25160 will open. Supports for Nifty currently are at 24504 and 24399. We have a very interesting week ahead with possibility of lot of volatility.
Disclaimer: The above information is provided for educational purpose, analysis and paper trading only. Please don't treat this as a buy or sell recommendation for the stock or index. The Techno-Funda analysis is based on data that is more than 3 months old. Supports and Resistances are determined by historic past peaks and Valley in the chart. Many other indicators and patterns like EMA, RSI, MACD, Volumes, Fibonacci, parallel channel etc. use historic data which is 3 months or older cyclical points. There is no guarantee they will work in future as markets are highly volatile and swings in prices are also due to macro and micro factors based on actions taken by the company as well as region and global events. Equity investment is subject to risks. I or my clients or family members might have positions in the stocks that we mention in our educational posts. We will not be responsible for any Profit or loss that may occur due to any financial decision taken based on any data provided in this message. Do consult your investment advisor before taking any financial decisions. Stop losses should be an important part of any investment in equity.

Market breadth plus Long buildup in NiftySo as we planned, market opened above Pivot and gave a bounce, that too with long buildup in NSEIX:NIFTY1! .
That’s a strong positive sign.
One more good thing is volume. Today’s buyers’ volume was 29M, which is higher than Friday’s sellers’ volume of 24M.
This clearly shows bulls are taking charge. However my view will remain cautious until we close above at least 24850 on weekly basis.
So we have 3 positives now for the week ahead:
• Long buildup in futures
• Market breadth positive
• Buyers’ volume higher
With all this, Nifty’s Pivot has now shifted to 24564 and PP is at 0.25.
So, if tomorrow NSE:NIFTY opens above Pivot and stays there, then we can expect a sharp move towards 24750. Support will be 24575.
NSE:BANKNIFTY is showing early signs of accumulation. Support 53600. Options traders can aim for 55500 this month.
On the sector side, Auto, Finance, Chemical and Defence have joined the momentum. Keep a close watch on defence leaders.
My today's intraday performers:
1. NSE:OLAELEC +15.60%
2. NSE:STALLION +9.95%
3. NSE:STYLEBAAZA +4.14%
That’s it for today. Take care and have a profitable tomorrow.
Nifty 50: Shows reversal before hitting the support of 24300
Nifty 50: Shows reversal before hitting the support of 24300
( Not a Buy / Sell Recommendation
Do your own due diligence ,Market is subject to risks, This is my own view and for learning only .)

NIFTY50....Wave iv complete?Hello Traders,
the NIFTY50 has probably complete a wave iii of lower degree.
It closed the day @ 24625. In contrast of a wave ii, that has lasted for one day also, this wave could be complete.
In this case, the next move should occurr to the downside and complete a wave v! Targets are still valid and have been published yesterday!
If this move instead was all of the correction, it should start a new advance and create possibly new high's above 25153 on August 21th.
While the move for now looks like a "three-down" I await another wave to the downside to accomplishe a "five-down"!
So friends, that's it for a quick note today.
Have a great week.....
Ruebennase
Please ask or comment as appropriate.
Trade on this analysis at your own risk.

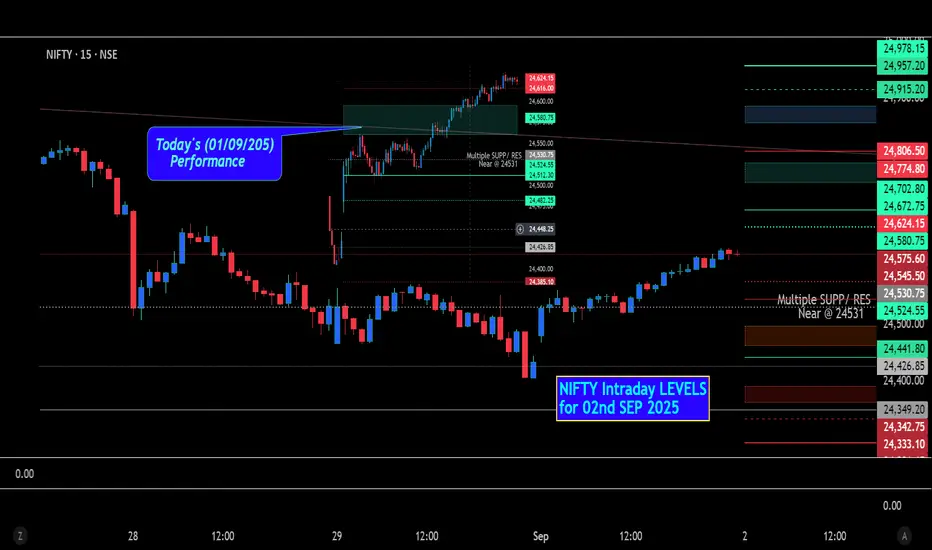
NIFTY Intraday Level for 02nd SEP 2025All Plotted and Mentioned on Chart.
Colour code:
Green =. Positive bias.
Red =. Negative bias.
RED in Between Green means T rend Finder / Momentum Change
/ CYCLE Change and Vice Versa.
Notice One thing: HOW LEVELS are Working.
Use any Momentum Indicator / Oscillator as USED to to Take entry.
Disclaimer: Study Purpose only.
Nifty levels - Sep 02, 2025Nifty support and resistance levels are valuable tools for making informed trading decisions, specifically when combined with the analysis of 5-minute timeframe candlesticks and VWAP. By closely monitoring these levels and observing the price movements within this timeframe, traders can enhance the accuracy of their entry and exit points. It is important to bear in mind that support and resistance levels are not fixed, and they can change over time as market conditions evolve.
The dashed lines on the chart indicate the reaction levels, serving as additional points of significance to consider. Furthermore, take note of the response at the levels of the High, Low, and Close values from the day prior.
We hope you find this information beneficial in your trading endeavors.
* If you found the idea appealing, kindly tap the Boost icon located below the chart. We encourage you to share your thoughts and comments regarding it.
Wishing you success in your trading activities!

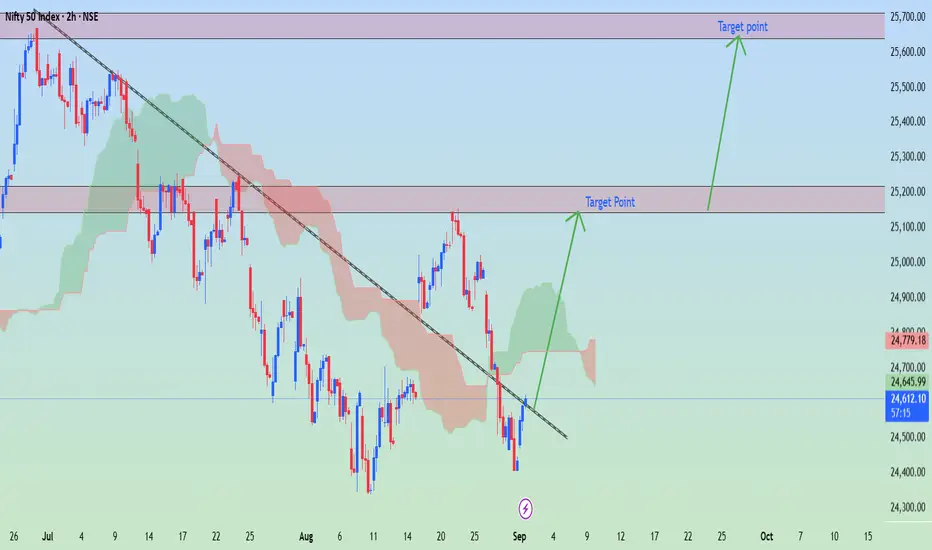
NIFTY 50 Index (2H timeframe) ..NIFTY 50 Index (2H timeframe)
---
Current Market Context
Instrument: NIFTY 50 Index (NSE)
Current Price: ~24,709
Trend: Recently bounced from a support zone after a downtrend.
Indicators: Price is trying to recover above the Ichimoku cloud and has broken a short-term descending trendline.
---
Targets Marked on my Chart
1. First Target Zone: 25,150 – 25,200
This is the immediate resistance / supply zone.
Likely to be tested first on bullish continuation.
2. Second Target Zone: 25,550 – 25,600
This is the extended bullish target.
It aligns with the next major resistance zone marked in your chart.
---
Trade Idea
Entry Zone: Around 24,700 – 24,750 (current levels).
Take Profit 1: ~25,150 – 25,200.
Take Profit 2: ~25,550 – 25,600.
Stop Loss: Below recent swing low (~24,500).
---
⚠ Note: NIFTY moves strongly with global cues and India’s market data. If bulls fail to hold above 24,500, bearish pressure could resume.
Market trendThis is my practice chart for Smart Money Concepts (SMC).
📌 Key focus areas:
- Market Structure (HH, HL, LH, LL)
- CHoCH (Change of Character) and BoS (Break of Structure)
- Liquidity pools (equal highs/lows zones)
- Order Blocks (OB) and Fair Value Gaps (FVG)
- Supply & Demand Zones
- Premium / Discount levels
I am publishing this chart to analyze trend bias and to learn how institutional concepts apply in real-time on the Nifty 50 (5 minute timeframe).
Disclaimer: Educational purpose only, not financial advice.

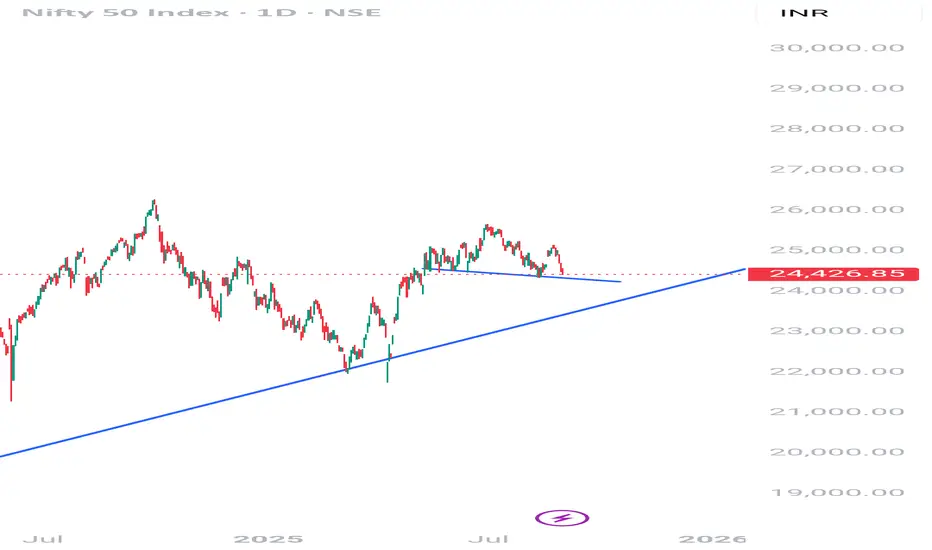
Nifty Weekly chart - in Making of Inverted Head and Shoulder Disclaimer : Do your own research before investing. This is just a chart analysis. No recommendation to buy and sell.
Nifty is in making of Inverted head and Shoulder pattern on Weekly Chart.
CMP is Rs. 24560/- On the upper side it can go upto Rs.26000/- and lower side can go upto Rs. 23000.

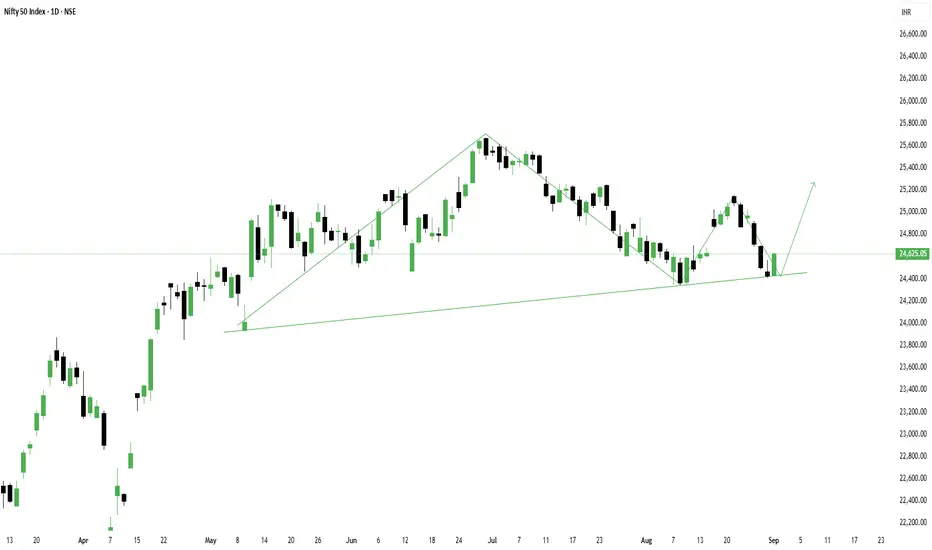
Nifty Maintains Bullish Trend, Eyes Higher TargetsNifty Maintains Bullish Trend, Eyes Higher Targets
The Nifty index continues to trade within a strong bullish market structure, characterized by higher highs and higher lows, indicating sustained upward momentum. The index is currently hovering near a crucial support level, which has historically acted as a springboard for further rallies. As long as this support holds, the overall trend remains firmly bullish, with expectations of another upward push in the coming sessions.
On the higher side, the next key target for the Nifty is 25,600, a level that could attract profit-taking if reached but may also act as a psychological resistance. A decisive breakout above this zone could open the doors for even higher levels, reinforcing the bullish dominance. Traders should watch for follow-through buying momentum to confirm the continuation of the uptrend.
On the downside, 24,500 is a critical support level that must hold to maintain the bullish structure. A dip towards this zone could present a buying opportunity, as long as the price does not close below it. A breach of this support, however, could signal a short-term correction or consolidation phase before the next directional move.
Given the current technical setup, the bias remains in favor of the bulls, with dip-buying strategies likely to prevail. Traders should monitor price action around the key levels mentioned, as they will determine whether the uptrend extends or faces a temporary pause. Overall, the Nifty's bullish trend remains intact, with 25,600 as the next major target and 24,500 serving as a crucial support to watch.

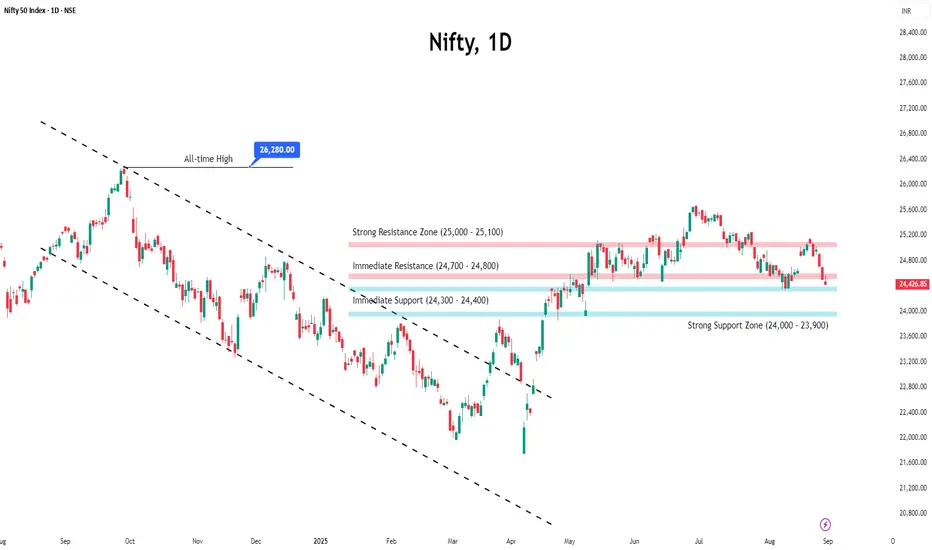
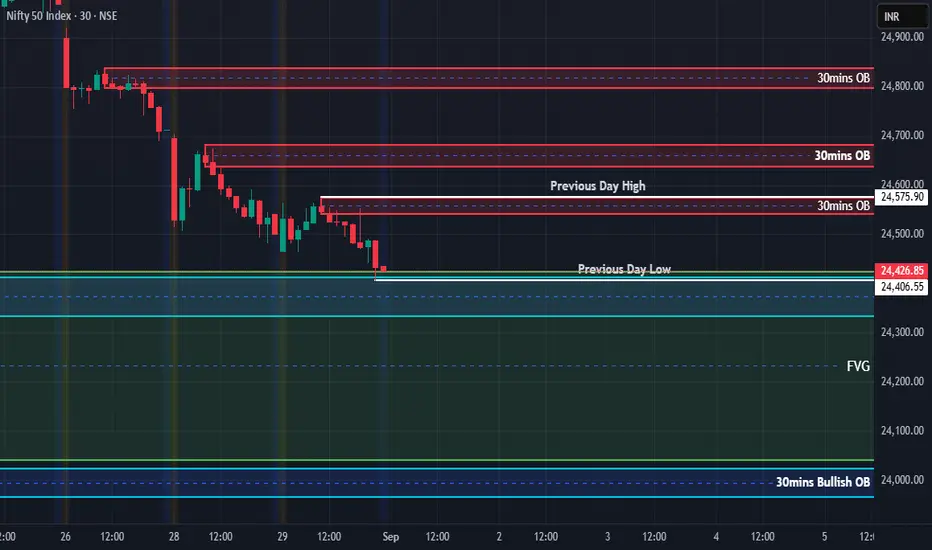
Nifty Analysis for 01-09-2025Chart Breakdown: Current Price: ~24,426.85 (just below Previous Day Low).
Key Levels:
Immediate Resistance Zones (30-min OBs):
24,575 (PDH zone)
24,700–24,800 (stronger OB).
Support Zones:
Previous Day Low (PDL): 24,426
Discount Zone / FVG: 24,300 → 24,200
Major 30-min Bullish OB: ~24,000
Market Structure:
Multiple BOS (Break of Structure) down moves → bearish structure confirmed.
Price is trading below PDH & PDL, showing weakness.
Next liquidity magnet = FVG 24,300–24,200.
Interpretation
Price is in a bearish order flow, creating lower highs and breaking lows.
PDL already tested → weak support, risk of continuation down.
FVG (24,300–24,200) is the natural downside target in the short term.
24,000 OB remains the most important demand zone for reversal.
Scenarios
Bearish Continuation (Most Likely Near Term):
If 24,426 (PDL) breaks clean → quick slide into 24,300–24,200 FVG.
If selling accelerates → test of 24,000 OB.
Bullish Reversal Case:
If 24,426 holds & market reclaims PDH (~24,575) → could trigger short covering.
Targets: 24,700 → 24,800 OB.
Only strong close above 24,800 negates bearish structure.
Neutral/Range Case:
If stuck between 24,426–24,575 → chop zone, liquidity building before big move.
My Perspective
Bias: Bearish to sideways, unless 24,575 is reclaimed.
Expect FVG fill to 24,200 in the short run.
24,000 OB will decide whether bulls regain control or if deeper correction (23,600–23,200 gap) opens up.
Suggested Trading Approach:
Short-term shorts below 24,426 → target 24,300–24,200.
Aggressive longs only from 24,000 OB with confirmation (candle reversal / demand reaction).
Avoid longs in the middle zone (24,400–24,500) since structure favors sellers.
NIFTY KEY LEVELS FOR 01.09.2025NIFTY KEY LEVELS FOR 01.09.2025
RTF: 3 Minutes
If the candle stays above the pivot point, it is considered a bullish bias; if it remains below, it indicates a bearish bias. Price may reverse near Resistance 1 or Support 1. If it moves further, the next potential reversal zone is near Resistance 2 or Support 2. If these levels are also broken, we can expect the trend.
If the range(R2-S2) is narrow, the market may become volatile or trend strongly. If the range is wide, the market is more likely to remain sideways
📢 Disclaimer
I am not a SEBI-registered financial adviser.
The information, views, and ideas shared here are purely for educational and informational purposes only. They are not intended as investment advice or a recommendation to buy, sell, or hold any financial instruments.
Please consult with your SEBI-registered financial advisor before making any trading or investment decisions.
Trading and investing in the stock market involves risk, and you should do your own research and analysis. You are solely responsible for any decisions made based on this research.

Pattern in NiftyNifty 50 showing bearish signals, it may reverse from here or else if it breaks the head and shoulder pattern a nice selling may come, this is a no trade zone for me , it is also following global trade wars.
NIFTY50..... No news to report!Hello Traders,
the NIFTY50 has closed the week with a loss of 443.25 points, or 1.78%!
It dropped back into the sky blue rectangle I have drew at chart. Please note that I have left the forecast arrow unchanged.
Chart analysis:
In my view, is a drop into the retracements to favor. If the low of 24317.55 will be undercut, the door would be open to ~24K area!
Short term, a drop to around 24260 range would be possible, before a wave iv could start. But this is not for sure!
My personal argument is following. Before a "sell-off" hasn't occurred, the downtrend is valid. It needs a gap-down or a dramatic
"sell-off" in the coming days/weeks to end this correction. As I told before: The longer a correction takes to happen, the more severe it will be. That is exactly what we are experiencing now!
While it takes an advance move above the 24991 area to start a new impulsive structure, this is not something that I would wait for.
Seasonally the time is "textbook-like" for a corrective phase off the year and this is what I speculate on!
Ok, the Investors who only trade n a "daily-close" basis should sell their stocks/option on Monday! After they did, a countertrend move to the upside could be possible. After, a decline again is in the cards. This is the "game" big money is playing right now!
So, be prepared for the unexpected and wait for clear structures and the chance to fill the Christmas money box!
That's it for the weekend.
There probably will be no forecast at the coming weekend, 'cause of a short trip for some days. I am offline!
Have a great week.....
Ruebennase
Please ask or comment as appropriate.
Trade on this analysis at your own risk.

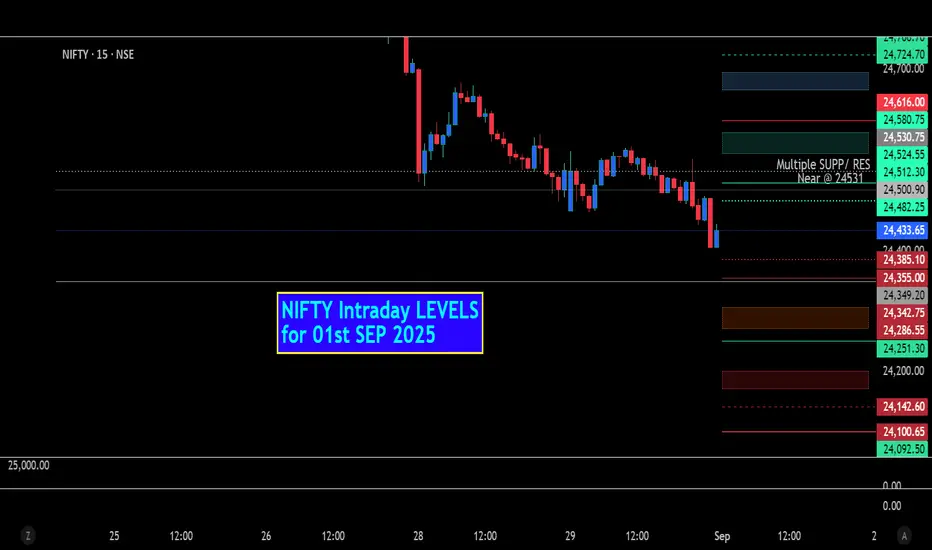
NIFTY Intraday Level for 01st SEP 2025All Plotted and Mentioned on Chart.
Colour code:
Green =. Positive bias.
Red =. Negative bias.
RED in Between Green means Trend Finder / Momentum Change
/ CYCLE Change and Vice Versa.
Notice one thing: HOW LEVELS are Working.
Disclaimer: Study Purpose only.
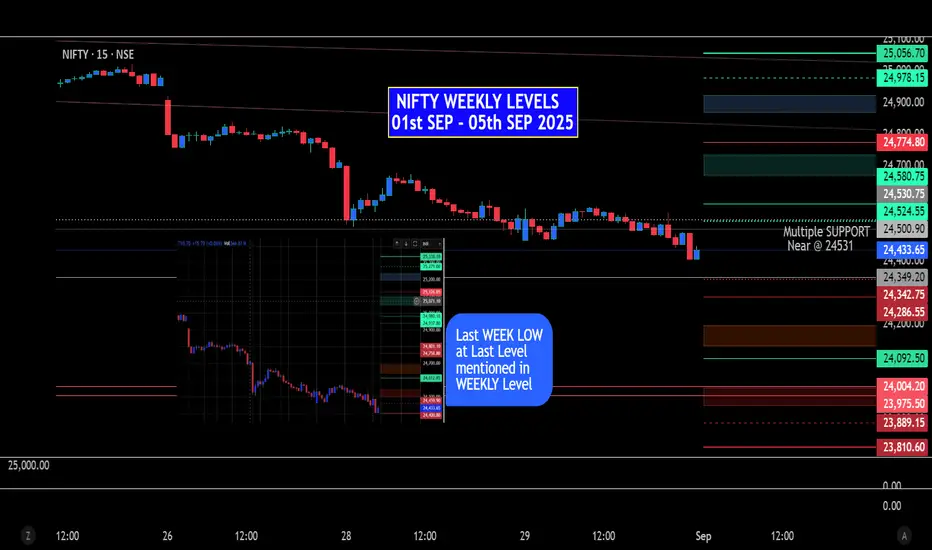
NIFTY WEEKLY Levels from 01st - 05th SEP 025All Plotted and Mentioned on Chart.
Colour code:
Green =. Positive bias.
Red =. Negative bias.
RED in Between Green means Trend Finder / Momentum Change
/ CYCLE Change and Vice Versa.
Notice one thing: HOW LEVELS are Working.
Disclaimer: Study Purpose only.
Nifty September 1st Week AnalysisNifty this week will be crucial , no clear trend on charts right now , important base on the downside is placed between 24072-24000 . While upside momentum to sustain only if nifty crosses and sustains above 24600. This weak move will decide the trend .
All levels are marked in the chart posted.

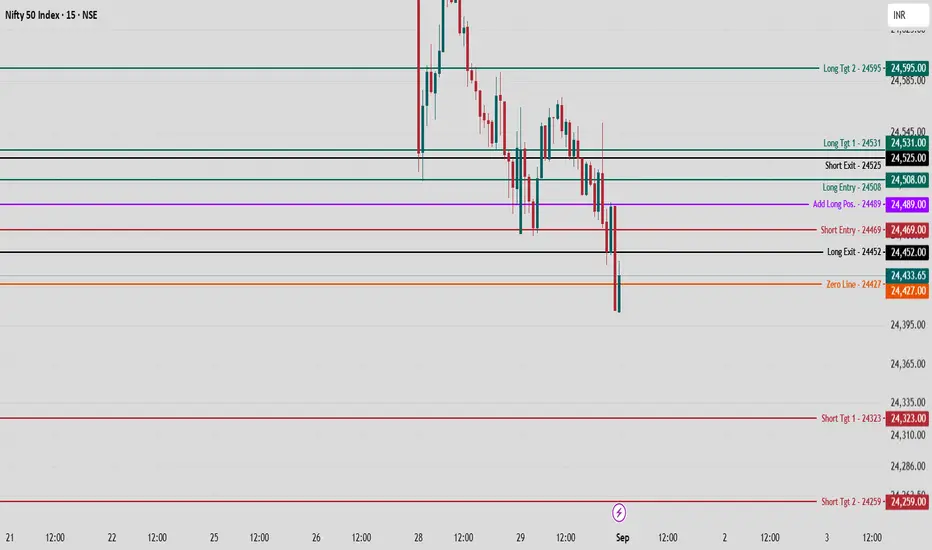
Nifty 50 Intraday Strategy 1 Sept., 2025 — Key Levels to WatchNSE:NIFTY The Nifty 50 Index has shown a narrow recovery after testing support levels, and several key levels are providing actionable insights for intraday traders based on the chart.
Nifty 50 Intraday Strategy — Key Levels to Watch
Nifty 50 is currently resisting downside momentum and holding above the Zero Line at 24,427. Bulls should closely monitor the following critical levels for directional bias and trade setup:
Bullish Scenario
Long Entry Zone: Watch for strength above 24,508—this is a key breakout level for upward momentum.
Add Longs: Momentum confirmation can come above 24,489. If Nifty sustains above here, look for targets at 24,531 (Long Tgt 1) and 24,595 (Long Tgt 2).
Long Exit Level: Book profits or trail stops at 24,452 to lock in gains if the move loses steam.
Bearish Scenario
Short Entry Zone: Breakdown below 24,469 signals weakness. Aggressive traders can consider shorts here with targets at 24,323 (Short Tgt 1) and further down to 24,259 (Short Tgt 2).
Short Exit: A reversal above 24,525 should be a stop for short trades.
Neutral/Balanced Zone
The zone between 24,427 (Zero Line) and 24,452 is a no-trade/consolidation area—wait for a clear breakout or breakdown before taking a position.
Trade with discipline: Always use proper position sizing and respect stop levels as marked. Today’s price actions around these levels can offer both intraday breakout and reversal opportunities for active traders.
Nifty Ends August in Pain: Can September Spark a Turnaround?Nifty slipped nearly 1.8% in the last week of August as global headwinds and US-India tariff concerns weighed on sentiment.
Selling was broad-based, with Banking and Financials dragging the index down the most.
The index currently trades just above 24,400, a crucial support level. Open interest data indicates that the 24,400–24,300 zone may provide short-term support, while the 25,500–25,600 zone remains significant resistance due to heavy call writing. A decisive break below 24,300 could quickly push the index toward 24,000.
Amid the weakness, a silver lining emerges — India’s strong 7.8% GDP growth, the highest in five quarters and well above expectations, may help cushion further downside.
Looking ahead, Monday’s open will set the tone for September—a gap-up above 25,500 could spark a rebound, while staying below may keep Nifty under pressure.