#Nifty - Levels for Aug 2025 Date: 09-08-2025
Nifty Current Price: 24363.3
Pivot Point: 24746 Support: 24412 Resistance: 25081
Upside Targets:
| Target | Price |
| ----------- | ---------|
| 🎯 Target 1 | ₹25335 |
| 🎯 Target 2 | ₹25589 |
| 🎯 Target 3 | ₹25905 |
| 🎯 Target 4 | ₹26221 |
Downside Targets:
| Target | Price |
| ----------- | ---------|
| 🎯 Target 1 | ₹24158 |
| 🎯 Target 2 | ₹23903 |
| 🎯 Target 3 | ₹23587 |
| 🎯 Target 4 | ₹23271 |
#TradingView #Nifty #BankNifty #DJI #NDQ #SENSEX #DAX #USOIL #GOLD #SILVER
#BHEL #HUDCO #LT #LTF #ABB #DIXON #SIEMENS #BALKRISIND #MRF #DIVISLAB
#MARUTI #HAL #SHREECEM #JSWSTEEL #MPHASIS #NATIONALUM #BALRAMCHIN #TRIVENI
#USDINR #EURUSD #USDJPY #NIFTY_MID_SELECT #CNXFINANCE
#SOLANA #ETHEREUM #BTCUSD #MATICUSDT #XRPUSDT
#Crypto #Bitcoin #BTC #CryptoTA #TradingView #PivotPoints #SupportResistance
Trade ideas
Nifty 50 Intraday Trade Plan — 17th September 2025Nifty 50 continues to show strong bullish momentum on the 15-minute chart, trading above the critical Zero Line at 25239. The price action has triggered a breakout, with current levels at 25254.45 suggesting further upside potential if bullish sentiment holds.
Key Intraday Levels
Long Entry: 25188
Targets: 25357 (Tgt 1), 25430 (Tgt 2)
Short Entry: 25143
Targets: 25121 (Tgt 1), 25048 (Tgt 2)
Zero Line (Crucial Pivot): 25239
Trade View
Nifty pushing and sustaining above the Zero Line strengthens the bullish case for long trades toward the mentioned targets.
A break below 25239 or a reversal from above could activate short opportunities; however, favor the long side till the trend structure remains intact.
Intraday traders can monitor 25188 for fresh long positions or 25166 for adding long exposure on dips. Maintain defined stops as per your risk plan.
Trading Strategy:
Bias: Bullish above 25239
Risk Management: Respect all levels and adjust positions near key pivots.
Keep tracking momentum and volume for confirmation. Trade with discipline—let the levels guide your entries and exits!
Follow Chart Pathik for more such updates!

Nifty Analysis EOD – September 16, 2025 – Tuesday🟢 Nifty Analysis EOD – September 16, 2025 – Tuesday 🔴
Powerful Breakout to New Highs – Bulls Taking Control
🗞 Nifty Summary
Nifty began the day with a 15-point gap up, then climbed steadily and strongly upward from the first tick. Every key level respected the price movement, with pauses followed by decisive breakthroughs:
Crossed 25115 (PDH), 25140, and 25160 levels smoothly.
Marked a day high of 25181.85 within just 45 minutes.
After a ~2-hour consolidation in a narrow ~25-point range, Nifty broke the Current Day High (CDH) and marked a new high at 25,203. Though crossing 25200 was tough for a while, 25150 support came to the rescue. From there, a fresh rally pushed the index to our expected target level of 25,240.
As noted earlier, 25240 acted as strong resistance, visible in multiple 5-minute candle shadows. The day ended near the high, signaling strong bullish conviction.
📊 The total range today was 190 points, compared to the 172-point average range of the Gladiator Indicator → indicating expansion after recent contraction.
✅ Today’s close is the highest closing since July 11, 2025, and above the previous swing high (July 23, 2025 close).
👉 For tomorrow:
If Nifty gaps up above the 25240 ~ 25260 resistance zone and sustains, it could aim for 25300 ~ 25340 and 25385.
If it opens within today’s range, expect a possible retest of 25165 ~ 25140, with 25115 as strong support — a possible zone for long reversal trades.
Initial Balance (IB) will be key to plan trades and view tomorrow.
🛡 5 Min Intraday Chart with Levels
📉 Daily Time Frame Chart with Intraday Levels
🕯 Daily Candle Breakdown
Open: 25,073.60
High: 25,261.40
Low: 25,070.45
Close: 25,239.10
Change: +169.90 (+0.68%)
🏗️ Structure Breakdown
Green candle (Close > Open)
Body: ~165.50 points (strong, wide body)
Upper wick: ~22.30 points
Lower wick: ~3.15 points (almost no tail)
Strong close near day high → clear sign of intraday momentum.
📚 Interpretation
Buyers fully controlled the session from the start, defending 25,070.
Broke above 25,140 resistance (last week’s ceiling) with confidence.
Closing near the high shows high conviction buying and likely short-covering.
🕯Candle Type
Bullish Marubozu type → Signals decisive breakout with strong buying pressure.
📉📈 Short-Term View – September 17, 2025
Support: 25,140–25,150 (key floor now)
Resistance: 25,260–25,290 (today’s high zone)
👉 Key Insight:
The multi-day sideways consolidation (24,940–25,140) has ended.
Today’s strong green Marubozu confirms bullish breakout.
Bulls are now clearly in charge, aiming next for 25,340–25,385, provided they sustain above 25,140.
🛡 5 Min Intraday Chart
⚔️ Gladiator Strategy Update
ATR: 172.09
IB Range: 87.4 → Medium
Market Structure: Balanced
Trade Highlights:
9:20 AM – Long Trigger → Target Hit (R:R - 1:2.68)
📌 Support & Resistance Levels
Resistance Zones:
25240
25290 ~ 25307
25340 ~ 25385
Support Zones:
25165 ~ 25140
25115
25085 ~ 25070
💡 Final Thoughts
Today’s textbook inside bar breakout shows that bulls have the upper hand now. The next few sessions will decide if momentum will carry toward 25,300+ or if profit-taking sets in.
📖 “Momentum favors the brave. Keep an eye on the key levels and trade with discipline.”
✏️ Disclaimer
This is just my personal viewpoint. Always consult your financial advisor before taking any action.

Nifty looks bullish Nifty's looking pretty bullish, smashing through all those resistance levels with a solid bullish candle.

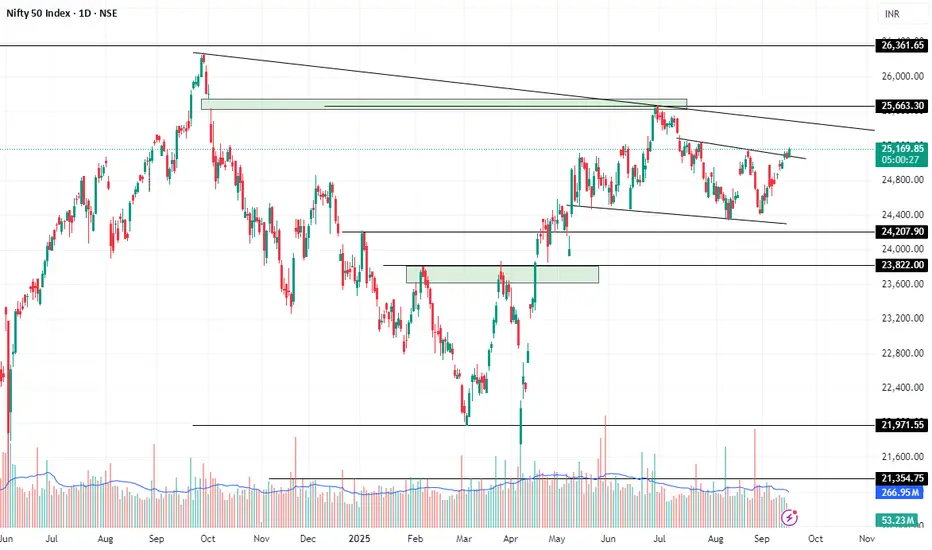
Nifty Medium term trend - BearishFrom Elliott Wave Perspective Nifty 50 is Identified as FLAT or Complex WXY Pattern is in progress
in either patterns next wave could be towards down side price move,
price could retrace to price target of 21365 in a time period of one to three months

Nifty levels - Sep 17, 2025Nifty support and resistance levels are valuable tools for making informed trading decisions, specifically when combined with the analysis of 5-minute timeframe candlesticks and VWAP. By closely monitoring these levels and observing the price movements within this timeframe, traders can enhance the accuracy of their entry and exit points. It is important to bear in mind that support and resistance levels are not fixed, and they can change over time as market conditions evolve.
The dashed lines on the chart indicate the reaction levels, serving as additional points of significance to consider. Furthermore, take note of the response at the levels of the High, Low, and Close values from the day prior.
We hope you find this information beneficial in your trading endeavors.
* If you found the idea appealing, kindly tap the Boost icon located below the chart. We encourage you to share your thoughts and comments regarding it.
Wishing you success in your trading activities!

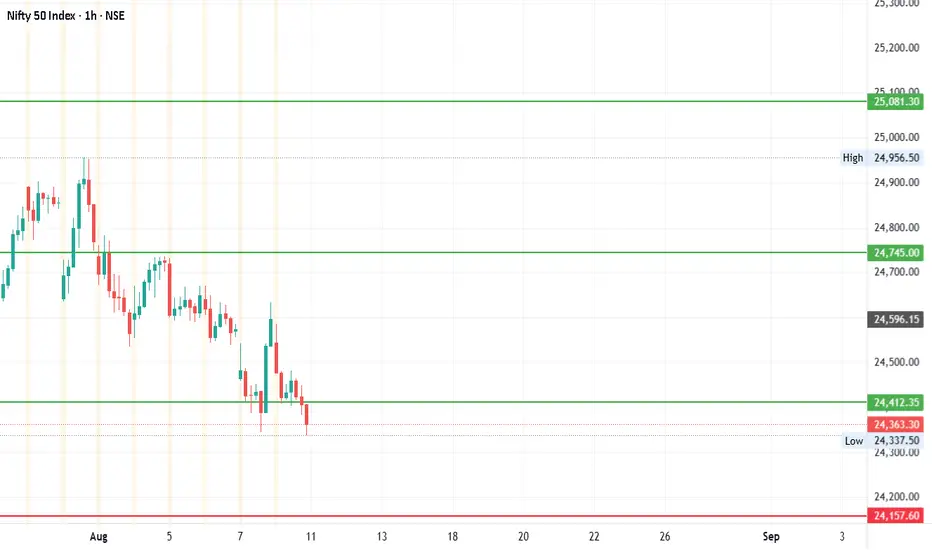
Nifty May Fall From this Given Resistance rangeThis is Nifty Hourly chart and from 24337 WXY Correction is going on and now it entered in given resistance range and from there Nifty may decline sharply as wave 3 of wave C(Explained on Daily chart if you are following me regularly.)
Disclaimer: This Idea is for Educational purpose only and Not Trading Recommendation. I am Not SEBI Registered Research Analyst.

PERFECT CUP & HANDLE IN NIFTYNifty is making one of the strongest bullish pattern that is cup & handle .
major breakout level @ 25,700
internal breakout occurs @ 25,200
one can go long after confirmation of breakout from 25,700
also one can go long with less risk @ breakout of 25,200
Arbitrage Opportunities Across World Exchanges1. Historical Background of Arbitrage
The roots of arbitrage stretch back centuries. Merchants in ancient times often exploited price discrepancies between different regions. For example:
Medieval trade routes: A trader could buy spices in India at low cost and sell them in Venice for a much higher price. This was a form of geographical arbitrage.
Gold Standard Era (19th century): Traders moved gold between cities like London and New York when exchange rate differences emerged.
Early stock markets: With the rise of exchanges in Amsterdam (1600s), London (1700s), and New York (1800s), traders began noticing price gaps between dual-listed stocks.
These historical examples were limited by communication and transport delays. But with the telegraph, telephone, and later the internet, arbitrage evolved into a high-speed, technology-driven strategy.
2. Understanding Arbitrage in Modern Exchanges
Today, arbitrage opportunities arise because no two markets are perfectly efficient. Prices may differ due to:
Time zone gaps – Tokyo, London, and New York operate in different hours.
Liquidity differences – A stock may have deeper trading in one exchange than another.
Regulatory restrictions – Taxes, transaction costs, or capital controls create distortions.
Information asymmetry – News may reach one market before another.
Currency fluctuations – Cross-border trades involve foreign exchange risks and opportunities.
In principle, arbitrage is about buying an asset cheaper in one place and selling it more expensively elsewhere—instantly or within a very short timeframe.
3. Types of Arbitrage Across World Exchanges
A. Spatial Arbitrage (Geographic Arbitrage)
This is the most classic form, where the same asset trades at different prices in two locations.
Example: A company’s shares are listed both in Hong Kong and New York. If the stock trades at $100 in New York and the equivalent of $102 in Hong Kong, traders can buy in New York and sell in Hong Kong.
B. Cross-Currency Arbitrage
Involves exploiting discrepancies in exchange rates.
Example: If EUR/USD, USD/JPY, and EUR/JPY are not aligned, a trader can loop through these conversions to lock in profit.
C. Triangular Arbitrage
More specific to forex markets. Traders exploit inconsistencies between three currency pairs simultaneously.
D. Statistical Arbitrage
Uses algorithms and quantitative models to detect pricing anomalies across exchanges.
Example: Pairs trading where two correlated stocks diverge temporarily in price.
E. Commodity Arbitrage
Prices of commodities like gold, oil, or wheat may vary across exchanges such as NYMEX (New York) and MCX (India). Arbitrageurs buy low in one and sell high in another.
F. Futures-Spot Arbitrage
Exploiting price differences between futures contracts in Chicago (CME) and the spot market in Shanghai or London.
G. Regulatory Arbitrage
Here, differences in rules create opportunities. For example, one exchange may allow certain derivatives trading while another bans it, creating parallel markets.
4. Role of Technology in Arbitrage
Modern arbitrage would be impossible without technology.
High-Frequency Trading (HFT): Ultra-fast algorithms execute trades in microseconds to capture fleeting arbitrage gaps.
Co-location services: Exchanges allow traders to place servers next to their data centers, reducing latency.
Blockchain & Crypto Arbitrage: With decentralized exchanges and global crypto markets, arbitrage between platforms like Binance, Coinbase, and Korean exchanges has become popular.
AI & Machine Learning: Algorithms analyze huge volumes of data to identify patterns humans may miss.
Technology doesn’t just create opportunities—it also reduces them quickly because once an arbitrage is spotted, it disappears as traders exploit it.
5. Real-World Examples of Global Arbitrage
A. Dual-Listed Stocks
Companies like Alibaba (listed in both NYSE and Hong Kong) or Royal Dutch Shell (listed in London and Amsterdam) often show slight price variations across exchanges. Professional arbitrageurs track these.
B. Gold Market
Gold trades in London (LBMA), New York (COMEX), and Shanghai. Price differences sometimes arise due to local demand, currency issues, or government policies. Arbitrageurs move gold or use paper contracts to profit.
C. Oil Market
The Brent crude benchmark (London) and WTI crude (New York) often trade at different spreads. Traders arbitrage these spreads with futures and physical oil trades.
D. Crypto Arbitrage
Bitcoin prices often differ across countries. For example, in South Korea (the "Kimchi Premium"), Bitcoin has historically traded 5–15% higher than in the U.S. due to capital restrictions.
E. Index Futures
Nifty (India), Nikkei (Japan), and S&P 500 (U.S.) futures trade almost 24/7. Arbitrageurs exploit price differences between futures traded in Singapore, Chicago, and domestic exchanges.
6. Challenges in Arbitrage
While arbitrage sounds like free money, in practice it faces many obstacles:
Transaction Costs: Commissions, spreads, and clearing fees can wipe out profits.
Currency Risks: Exchange rate movements can reverse arbitrage gains.
Capital Controls: Many countries restrict cross-border money flow.
Latency: Delays of even milliseconds can cause missed opportunities.
Liquidity Risks: Prices may differ, but executing large trades may not be possible.
Regulatory Risks: Authorities may restrict arbitrage trading to protect domestic markets.
Market Volatility: Sudden price swings can turn an arbitrage into a loss.
Arbitrage and Global Market Integration
Arbitrage plays a vital role in making global markets more efficient. By exploiting discrepancies, arbitrageurs push prices back into alignment. For example:
If gold trades at $1,800 in London and $1,820 in New York, arbitrage will push both toward equilibrium.
In FX, triangular arbitrage ensures that currency pairs remain mathematically consistent.
Thus, arbitrage acts as a self-correcting mechanism in global finance, reducing inefficiencies.
The Future of Global Arbitrage
Looking ahead, arbitrage opportunities will evolve:
Artificial Intelligence: Smarter algorithms will find hidden inefficiencies.
24/7 Markets: With crypto leading the way, global markets may never sleep, creating new overlaps.
CBDCs (Central Bank Digital Currencies): Will reduce settlement risks but may also create new arbitrage across jurisdictions.
Environmental & Carbon Markets: Carbon credits may become arbitrageable commodities across countries.
Geopolitical Shifts: Sanctions, wars, or policy changes can create huge temporary arbitrage gaps.
Conclusion
Arbitrage across world exchanges represents one of the most intriguing aspects of global finance. It thrives on inefficiencies, time zone differences, currency movements, and regulatory mismatches. Far from being just a trick for quick profits, arbitrage serves a deeper function: it connects and integrates global markets, ensuring that prices reflect a unified reality rather than fragmented local conditions.
From the spice traders of the Silk Road to today’s AI-driven high-frequency traders, the pursuit of risk-free profit has remained constant. What has changed is the scale, speed, and sophistication of arbitrage across world exchanges. In the future, as technology reshapes markets and globalization deepens, arbitrage will continue to be both a challenge and an opportunity for traders, institutions, and regulators worldwide.
DIAMOND TOP - NIFTY 50NIFTY 50 is forming similar to Diamond top pattern.
( pattern drawn in blue line )
which is rarest and strongest bearish pattern
break below 24,350 will confirm down trend

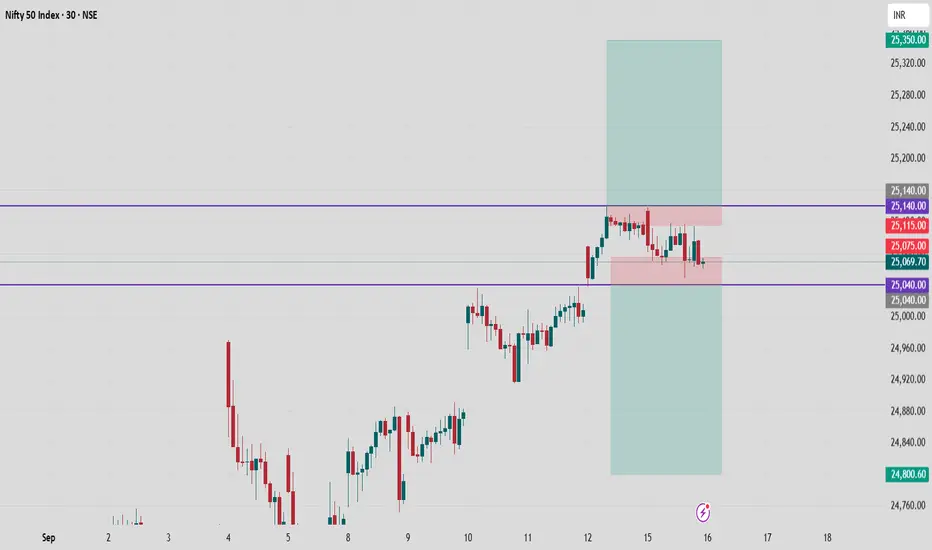
Nifty 50 Intraday Chart Analysis for 16th Sept., 2025Nifty 50 Index is currently trading in a defined range, showing clear support and resistance on the 15-minute chart. Price action is consolidating between 25,040 and 25,140, indicating a sideways market phase perfect for range-based strategies.
Key Levels and Range
Resistance Zone: 25,140
Support Zone: 25,040
Current Price: 25,069.70
Observe rejection and congestion near these levels; strong movement is likely only on a breakout beyond this band.
Trading Setup
Bullish Scenario:
Go long on a breakout above 25,140.
Targets: 25,350.
Stop-Loss: Below 25,100.
Bearish Scenario:
Go short on a breakdown below 25,040.
Targets: 24,800.
Stop-Loss: Above 25,075.
Guidance
Aided by the highlighted red range, Nifty is accumulating energy for the next move.
Use strict risk management — trade only on valid breakout/breakdown candle closes for best results.
Stay alert for volume confirmation at breakout levels.
Trade with discipline — let price tell its story before reacting.
Follow for more such updates!
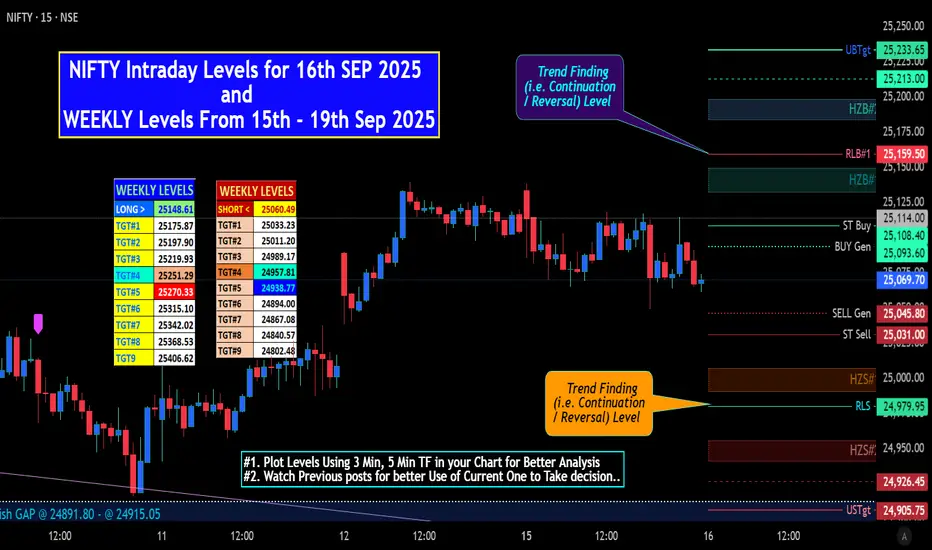
NIFTY Intraday Levels for 16th SEP 2025 NIFTY Intraday Levels for 16th SEP 2025 &
WEEKLY Levels From 15th - 19th Sep 2025.
MARKET Short View: At the time of this post GIFT NIFTY +> Flat to -Ve.
Due to Weekly Exp. Volatility may increase.
As mentioned in Last post Market Closed in RED.
# "WEEKLY Levels" mentioned in BOX format.
^^^^^^^ Plot Levels Using 3 Min, 5 Min Time frame in your Chart for Better Analysis ^^^^^^^
L#1: If the candle crossed & stays above the “Buy Gen”, it is treated / considered as Bullish bias.
L#2: Possibility / Probability of REVERSAL near RLB#1 & UBTgt
L#3: If the candle stays above “Sell Gen” but below “Buy Gen”, it is treated / considered as Sidewise. Aggressive Traders can take Long position near “Sell Gen” either retesting or crossed from Below & vice-versa i.e. can take Short position near “Buy Gen” either retesting or crossed downward from Above.
L#4: If the candle crossed & stays below the “Sell Gen”, it is treated / considered a Bearish bias.
L#5: Possibility / Probability of REVERSAL near RLS#1 & USTgt
HZB (Buy side) & HZS (Sell side) => Hurdle Zone,
*** Specialty of “HZB#1, HZB#2 HZS#1 & HZS#2” is Sidewise (behaviour in Nature)
Rest Plotted and Mentioned on Chart
Color code Used:
Green =. Positive bias.
Red =. Negative bias.
RED in Between Green means Trend Finder / Momentum Change
/ CYCLE Change and Vice Versa.
Notice One thing: HOW LEVELS are Working.
Use any Momentum Indicator / Oscillator or as you "USED to" to Take entry.
📢 Disclaimer
I am not a SEBI-registered financial adviser.
The information, views, and ideas shared here are purely for educational and informational purposes only. They are not intended as investment advice or a recommendation to buy, sell, or hold any financial instruments.
Trading and investing in the stock market involves risk, and you should do your own research and analysis. You are solely responsible for any decisions made based on this research.
"As HARD EARNED MONEY IS YOUR's, So DECISION SHOULD HAVE TO BE YOUR's".
Nifty Analysis EOD – September 15, 2025 – Monday🟢 Nifty Analysis EOD – September 15, 2025 – Monday 🔴
Tight Consolidation Before Weekly Expiry – Key Levels to Watch
🗞 Nifty Summary
Nifty opened with a 30-point gap-up, but the first-minute sell-off dragged the index 44 points down from the high. The Inside Bar (IB) formed at 25,080, and shortly after, the IB Low was breached, though it turned out to be a false breakdown.
The recovery from the low was modest at 54 points, showing gradual and less convinced buying. The 25,115 level acted as a strong hurdle, with multiple failed attempts to cross it. The day ended at the bottom of the session at 25,069.70.
Overall, today’s session remained well inside the previous day’s range, forming an Inside Bar pattern on the daily timeframe.
👉 The total range today was 90 points, but the majority of price action stayed within a narrow 45-point range (25,115 ~ 25,070), indicating a phase of tight consolidation.
With weekly expiry tomorrow, prepare for moves in both directions:
If PDH breaks and sustains above → target 25,240.
If PDL breaks → target 24,975 and 24,910.
🛡 5 Min Intraday Chart with Levels
📉 Daily Time Frame Chart with Intraday Levels
🕯 Daily Candle Breakdown
Open: 25,118.90
High: 25,138.45
Low: 25,048.75
Close: 25,069.20
Change: −44.80 (−0.18%)
🏗️ Structure Breakdown
Red candle (Close < Open)
Body: ~49.70 points (small)
Upper wick: ~19.55 points
Lower wick: ~20.45 points
Balanced structure, but the red body reflects sellers had a slight upper hand.
📚 Interpretation
Market opened strong but couldn’t sustain above 25,130, triggering selling pressure.
Buyers defended the 25,050 level once again, but the close below open shows mild weakness.
Both upper and lower wicks indicate a tug-of-war between bulls and bears, with sellers slightly dominating.
🕯Candle Type
Small bearish candle / Spinning Top leaning bearish → signals hesitation after a few days of upward drift.
📉📈 Short-Term View – September 16, 2025
Support: 25,040–25,050 (key floor).
Resistance: 25,130–25,140 (remains unbroken).
👉 Key Insight:
Market has been boxed between 25,040–25,140 for 2 sessions.
Sellers are defending the top, and buyers are holding the base → energy is building up for a decisive breakout.
A clean breakout in either direction will set the next phase.
🛡 5 Min Intraday Chart
⚔️ Gladiator Strategy Update
ATR: 169.85
IB Range: 57.15 → Medium
Market Structure: Balanced
Trade Highlights:
11:45 AM – Long Trigger → SL Hit
📌 Support & Resistance Levels
Resistance Zones:
25,115
25,140 ~ 25,160
25,240
Support Zones:
25,085
25,035
25,000 ~ 24,975
24,940
💡 Final Thoughts
Today’s indecisive and narrow consolidation hints at energy accumulation for the next big move. Keep an eye on PDH and PDL breakouts tomorrow (weekly expiry) for a clear directional bias.
📖 “Consolidation is the market’s way of gathering strength before the next directional burst.”
✏️ Disclaimer
This is just my personal viewpoint. Always consult your financial advisor before taking any action.

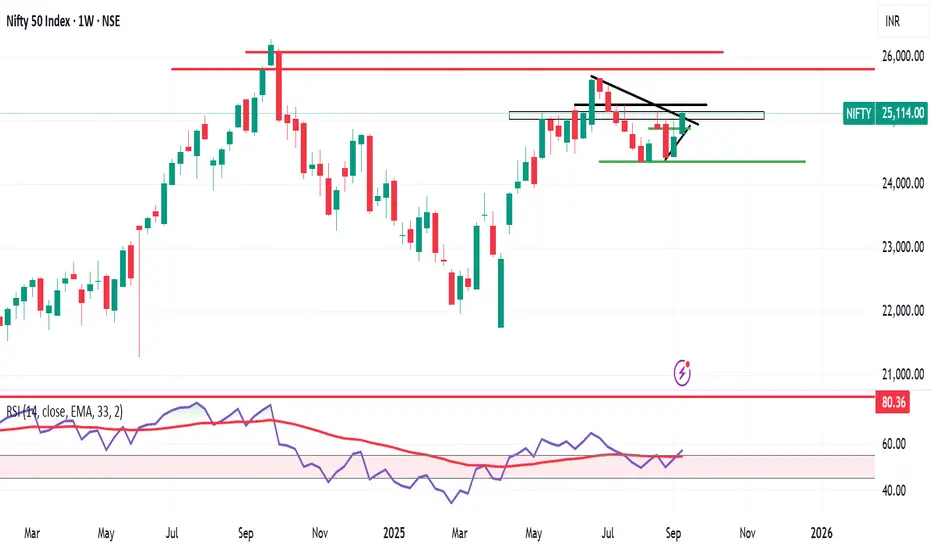
Nifty trying to inch back into Bullish territoryNifty has done a good job so far in the last 2 weeks to inch back towards bullish territory. This was the second week where we saw a fantastic Green candle. We saw Nifty close above an important Fibonacci resistance of 24994 at 25114.
The Next major Fibonacci resistances are at 25152 which is very near and 25378 which might also look relatively nearby. Once we get a closing above these 2 levels the next targets for Nifty will be at 25669, 26044 and 26529. Let us see if Nifty momentum takes us above 25152 or 25378 within next week.
If the resistance stops nifty growth the supports for Nifty will be at Fibonacci levels of 24994, 24804, 24645 (next strong Fibonacci support). Final support for Nifty before it falls back into bearish zone will be at 24337. Mother line support of 50 Weeks EMA is at 24144.
Shadow of the candle looks positive as of now and RSI is also slowly getting into the Bullish zone. Currently the RSI of Weekly chart is 56.99 which is very conducive for further progress.
Disclaimer: The above information is provided for educational purpose, analysis and paper trading only. Please don't treat this as a buy or sell recommendation for the stock or index. The Techno-Funda analysis is based on data that is more than 3 months old. Supports and Resistances are determined by historic past peaks and Valley in the chart. Many other indicators and patterns like EMA, RSI, MACD, Volumes, Fibonacci, parallel channel etc. use historic data which is 3 months or older cyclical points. There is no guarantee they will work in future as markets are highly volatile and swings in prices are also due to macro and micro factors based on actions taken by the company as well as region and global events. Equity investment is subject to risks. I or my clients or family members might have positions in the stocks that we mention in our educational posts. We will not be responsible for any Profit or loss that may occur due to any financial decision taken based on any data provided in this message. Do consult your investment advisor before taking any financial decisions. Stop losses should be an important part of any investment in equity.

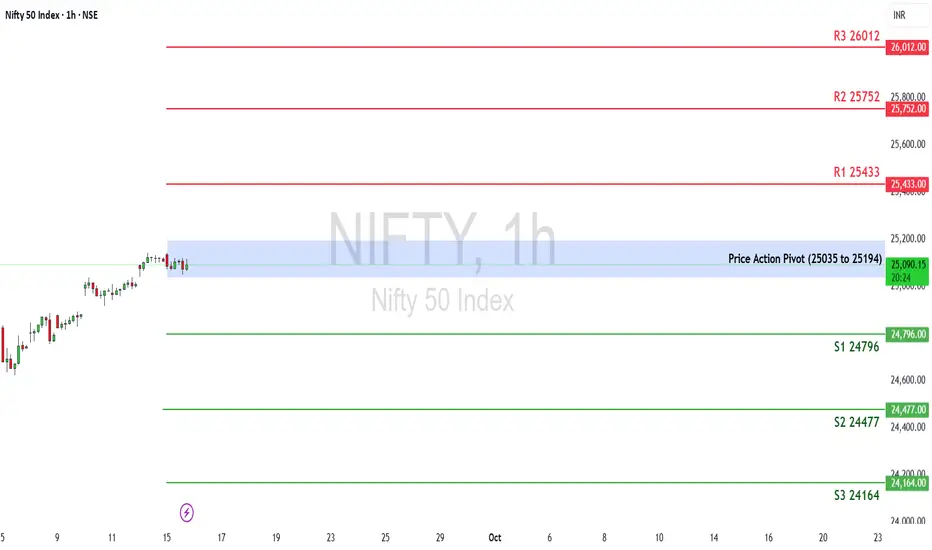
Nifty Weekly OutlookThe Nifty 50 ended the week at 25,114.00, gaining +1.51%.
Key Levels for the Upcoming Week
Price Action Pivot Zone:
25,035 to 25,194—This is the critical zone to watch. A decisive move beyond either side may dictate next week’s trend.
Support Levels
S1: 24,796
S2: 24,477
S3: 24,164
Resistance Levels
R1: 25,433
R2: 25,752
R3: 26,012
Market Outlook
Bullish Scenario:
If Nifty sustains above 25,194, buying momentum could build, aiming for R1 (25,433). A strong breakout above this may push prices towards R2 (25,752) and R3 (26,012).
Bearish Scenario:
If the index breaks below 25,035, selling pressure may return. This could drag Nifty towards S1 (24,796) and further down to S2 (24,477) and S3 (24,164)
Disclaimer: lnkd.in
Nifty levels - Sep 16, 2025Nifty support and resistance levels are valuable tools for making informed trading decisions, specifically when combined with the analysis of 5-minute timeframe candlesticks and VWAP. By closely monitoring these levels and observing the price movements within this timeframe, traders can enhance the accuracy of their entry and exit points. It is important to bear in mind that support and resistance levels are not fixed, and they can change over time as market conditions evolve.
The dashed lines on the chart indicate the reaction levels, serving as additional points of significance to consider. Furthermore, take note of the response at the levels of the High, Low, and Close values from the day prior.
We hope you find this information beneficial in your trading endeavors.
* If you found the idea appealing, kindly tap the Boost icon located below the chart. We encourage you to share your thoughts and comments regarding it.
Wishing you success in your trading activities!

Nifty 50 Trendline This chart shows Nifty 50 price action with a clearly drawn ascending trendline acting as dynamic support. Let me elaborate step by step:
1. Trendline Support
The black diagonal line marks higher lows in the market.
Each time price dips, it respects this trendline and bounces upward.
This indicates buyers are stepping in at progressively higher levels.
2. Current Market Zone
Price is around 25,111.
Immediate resistance is visible near 25,185–25,190, the recent swing high.
As long as Nifty holds above this rising trendline (around 25,050–25,070 zone), momentum remains bullish.
3. Scenarios to Watch
Bullish case: If Nifty stays above the trendline and breaks 25,190, it can target 25,250–25,300 levels.
Bearish case: A breakdown below the trendline (close below 25,050) may trigger profit booking, pulling price towards 24,950–24,900.
4. Trading Implication
Trendline is working as a psychological demand zone.
Market participants should watch for either a bounce continuation or a trendline breakdown for direction.
👉 In short:
Nifty is consolidating but still respecting trendline support. Bulls remain in control until that line is broken or fake out !!

April Cycle correction could have endedNSE:NIFTY Suggest the April cycle correction could have already ended. And as far as 24300 levels stays intact we could see more rally inching higer, selling is a big no. ANY PANIC IS A BUY

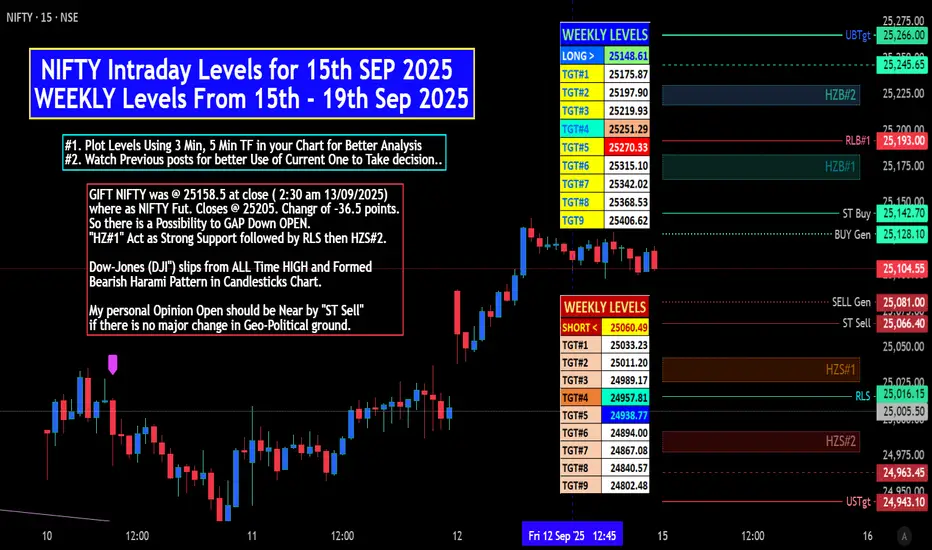
NIFTY Intraday Levels for 15/09/2025 WEEKLY Levels 15-19 Sep 25MARKET VIEW:
GIFT NIFTY was @ 25158.5 at close ( 2:30 am 13/09/2025)
where as NIFTY Fut. Closes @ 25205 . Change of -36.5 points .
So there is a Possibility to GAP Down OPEN.
"HZ#1" Act as Strong Support followed by RLS then HZS#2.
Some indicator & also Oscillators Shows Limited steam is LEFT.
Dow-Jones (DJI") slips from ALL Time HIGH and Formed
Bearish Harami Pattern in Candlesticks Chart.
My personal Opinion Open should be Near by "ST Sell"
if there is no major change in Geo-Political ground.
NIFTY Intraday Levels for 15th SEP 2025
WEEKLY Levels From 15th - 19th Sep 2025
# "WEEKLY Levels" mentioned in BOX format.
^^^^^^^ Plot Levels Using 3 Min, 5 Min Time frame in your Chart for Better Analysis ^^^^^^^
L#1: If the candle crossed & stays above the “Buy Gen”, it is treated / considered as Bullish bias.
L#4: Possibility / Probability of REVERSAL near RLB#1 & UBTgt
L#2: If the candle stays above “Sell Gen” but below “Buy Gen”, it is treated / considered as Sidewise. Aggressive Traders can take Long position near “Sell Gen” either retesting or crossed from Below & vice-versa i.e. can take Short position near “Buy Gen” either retesting or crossed downward from Above.
L#3: If the candle crossed & stays below the “Sell Gen”, it is treated / considered a Bearish bias.
L#4: Possibility / Probability of REVERSAL near RLS#1 & USTgt
HZB (Buy side) & HZS (Sell side) => Hurdle Zone,
*** Specialty of “HZB#1, HZB#2 HZS#1 & HZS#2” is Sidewise (behaviour in Nature)
Rest Plotted and Mentioned on Chart
Color code Used:
Green =. Positive bias.
Red =. Negative bias.
RED in Between Green means Trend Finder / Momentum Change
/ CYCLE Change and Vice Versa.
Notice One thing: HOW LEVELS are Working.
Use any Momentum Indicator / Oscillator or as you "USED to" to Take entry.
📢 Disclaimer
I am not a SEBI-registered financial adviser.
The information, views, and ideas shared here are purely for educational and informational purposes only. They are not intended as investment advice or a recommendation to buy, sell, or hold any financial instruments.
Trading and investing in the stock market involves risk, and you should do your own research and analysis. You are solely responsible for any decisions made based on this research.
"As HARD EARNED MONEY IS YOUR's, So DECISION SHOULD HAVE TO BE YOUR's".
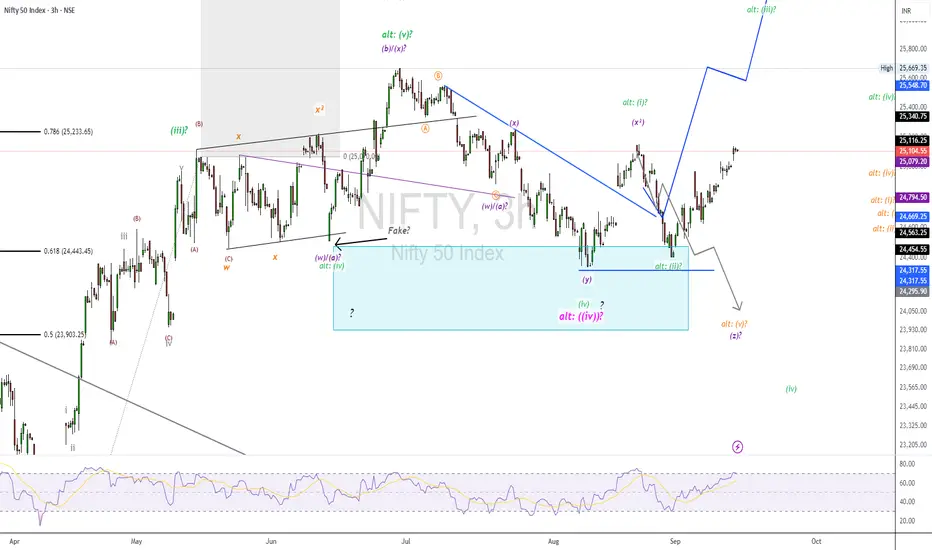
NIFTY50.....Boring times!Hello Traders,
nothing new to report! The structure of the waves are not clear and remain in contrast impulse vs correction!
We see overlapping structures at the waves, what makes it
difficult to interpret.
Chart analysis:
As labeled at the chart, we have the alternate view between a waves (i) and (ii), green as an impulsive move, or the corrective move within a waves a-b-c→z-wave! Note the similarity between the waves x and x².
A continuation of the advance comes only into play above 25378.35 on a closing basis.
Anything below this level, makes it more unlikely that a new impulse is underway.
'Cause of the non-event this week, that's it for today. Probably an update will be written if something important occurs!
Have a great week.....
Ruebennase
Please ask or comment as appropriate.
Trade on this analysis at your own risk.
Nifty Weekly Market Outlook – Bulls on the ChargeNifty closed the week at 25,114 (+373 points 📈),
with a high of 25,139 and low of 24,751.
As I mentioned last week, Nifty once again played perfectly within my range of 25,100 – 24,300.
Now, we are standing at a critical resistance zone of 25,200 – 25,300 – exactly where the market started its downward journey after 21st Aug 2025.
🔑 Key Levels to Watch for Next Week
✅ Bullish Scenario:
If Nifty sustains above 25,250, we may see a strong move towards 25,500 / 25,600.
❌ Bearish Scenario:
A break below Friday’s low of 25,038 could invite bears back and take Nifty down to 24,700 or even lower.
💡 Pro Tip for Investors
Those waiting for a dip to invest might get a chance around 18th / 19th September.
But remember – waiting too long often means missing the rally!
✅ Action Plan:
📋 Keep a list of fundamentally strong stocks ready.
📉 If Nifty corrects towards 24,200 / 24,000, start buying in SIP mode – don’t wait for the “perfect bottom.”
🌎 S&P 500 Update
S&P 500 closed at 6,584 (+100 points), finally touching the crucial Fib level of 6,568.
📈 Above 6,568: Rally towards 6,959 could start.
🔒 Trailing SL: Move your stop-loss to 6,430 to lock profits and protect gains.
Nifty Holds Above 25K, Market Drivers Signal More UpsideNifty’s winning streak hit eight sessions, closing above psychological 25,000 mark as global optimism and strong domestic cues kept the rally alive.
Technical View
● The index has registered a fresh breakout above the trendline resistance, pointing toward renewed bullish momentum.
Key Levels to Watch
● Immediate resistance is seen around 25,200–25,300, while a stronger hurdle lies at 25,500–25,600.
● Support has shifted higher to 25,000–24,900, keeping the short-term outlook positive.
Market Drivers
● Global cues: Hopes of a US Fed rate cut and progress on the India–US trade deal have lifted market sentiment.
● Domestic macros: India’s economy looks strong with solid financial stability, steady GDP growth, and easing inflation.
● Consumer demand: Spending is expected to rise sharply after September 22, especially in automobiles and consumer durables, which could boost markets in the near term.
● Policy & earnings: Market mood is supported by GST reforms, easier monetary policy, and positive earnings expectations for the second half of FY26.
Strategic View
● The overall market trend is expected to stay positive. Traders should follow a buy-on-dips strategy with strict stop-losses. As long as Nifty holds above support, it can gradually move higher in the coming sessions.

Nifty September 3rd Week AnalysisNifty is looking neutral. Nifty is positioned above 25000, giving hope for further upside momentum, but momentum will grip further after Nifty crosses and sustains above 25250-25300. And momentum can further continue until the next resistance of 25460-520.
On the downside, if Nifty breaches the support range of 25050-24930, then we can expect a downside of up to 24650.
