Nifty Weekly Market Outlook – Bulls on the ChargeNifty closed the week at 25,114 (+373 points 📈),
with a high of 25,139 and low of 24,751.
As I mentioned last week, Nifty once again played perfectly within my range of 25,100 – 24,300.
Now, we are standing at a critical resistance zone of 25,200 – 25,300 – exactly where the market started its downward journey after 21st Aug 2025.
🔑 Key Levels to Watch for Next Week
✅ Bullish Scenario:
If Nifty sustains above 25,250, we may see a strong move towards 25,500 / 25,600.
❌ Bearish Scenario:
A break below Friday’s low of 25,038 could invite bears back and take Nifty down to 24,700 or even lower.
💡 Pro Tip for Investors
Those waiting for a dip to invest might get a chance around 18th / 19th September.
But remember – waiting too long often means missing the rally!
✅ Action Plan:
📋 Keep a list of fundamentally strong stocks ready.
📉 If Nifty corrects towards 24,200 / 24,000, start buying in SIP mode – don’t wait for the “perfect bottom.”
🌎 S&P 500 Update
S&P 500 closed at 6,584 (+100 points), finally touching the crucial Fib level of 6,568.
📈 Above 6,568: Rally towards 6,959 could start.
🔒 Trailing SL: Move your stop-loss to 6,430 to lock profits and protect gains.
Trade ideas
Nifty Holds Above 25K, Market Drivers Signal More UpsideNifty’s winning streak hit eight sessions, closing above psychological 25,000 mark as global optimism and strong domestic cues kept the rally alive.
Technical View
● The index has registered a fresh breakout above the trendline resistance, pointing toward renewed bullish momentum.
Key Levels to Watch
● Immediate resistance is seen around 25,200–25,300, while a stronger hurdle lies at 25,500–25,600.
● Support has shifted higher to 25,000–24,900, keeping the short-term outlook positive.
Market Drivers
● Global cues: Hopes of a US Fed rate cut and progress on the India–US trade deal have lifted market sentiment.
● Domestic macros: India’s economy looks strong with solid financial stability, steady GDP growth, and easing inflation.
● Consumer demand: Spending is expected to rise sharply after September 22, especially in automobiles and consumer durables, which could boost markets in the near term.
● Policy & earnings: Market mood is supported by GST reforms, easier monetary policy, and positive earnings expectations for the second half of FY26.
Strategic View
● The overall market trend is expected to stay positive. Traders should follow a buy-on-dips strategy with strict stop-losses. As long as Nifty holds above support, it can gradually move higher in the coming sessions.

Nifty September 3rd Week AnalysisNifty is looking neutral. Nifty is positioned above 25000, giving hope for further upside momentum, but momentum will grip further after Nifty crosses and sustains above 25250-25300. And momentum can further continue until the next resistance of 25460-520.
On the downside, if Nifty breaches the support range of 25050-24930, then we can expect a downside of up to 24650.

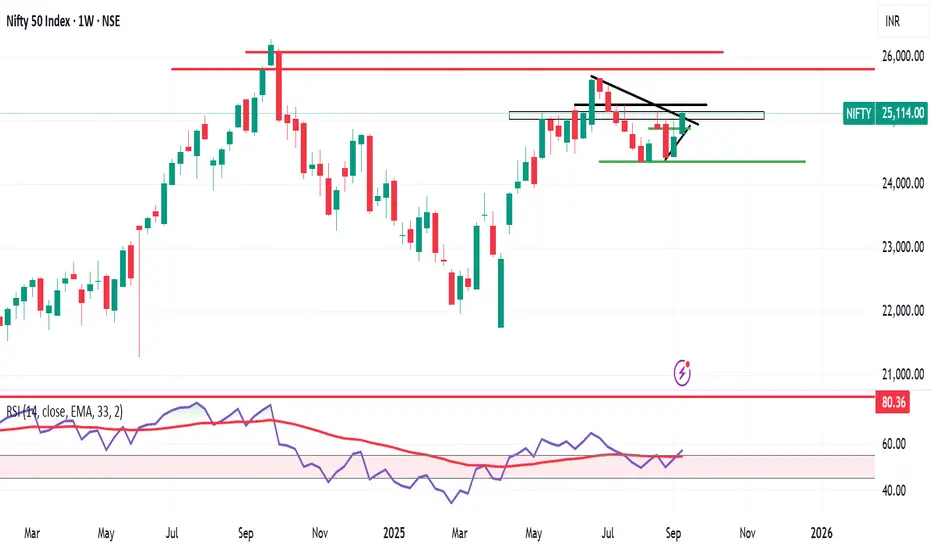
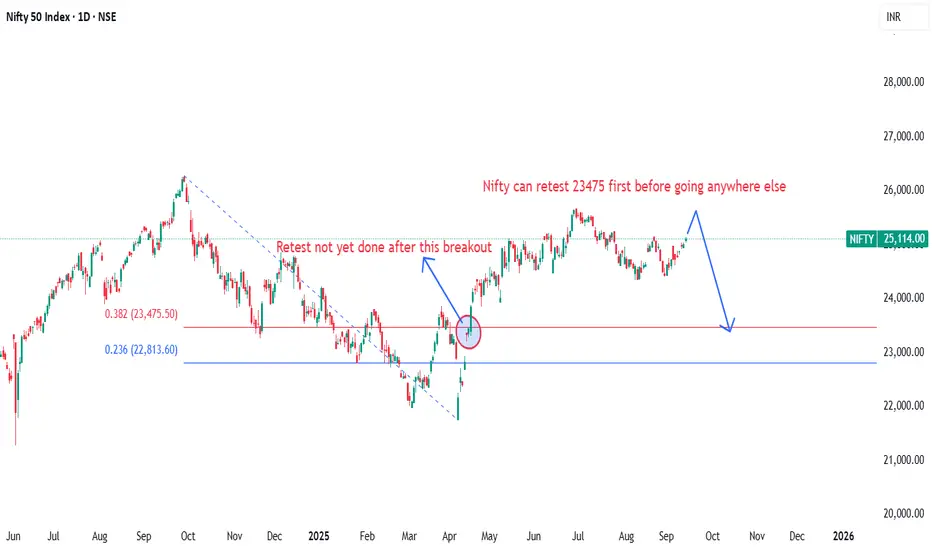
Nifty may retest this zone before going anywhere elseNifty has still not touched the 38% after breaking out which in most cases it should. so waiting for a confirmation to sell.
Nifty 50 price is consolidating in narrow zoneNifty 50 price is consolidating in narrow zone. Fundamentals are now US Tarrif hope driven with new diplomatic developments.

Nifty Analysis EOD – September 11, 2025 – ThursdayDelayed Note : Missed to Post on TV
🟢 Nifty Analysis EOD – September 11, 2025 – Thursday 🔴
Consolidation Continues – Bulls Holding Ground Near 25K
🗞 Nifty Summary
Nifty started flat and within minutes marked a low of 24,940 and high of 25,008. Most of the day was spent within this narrow IB Zone, with multiple fakeouts of IB High that made life tough for intraday traders.
After 2:30 PM, candles spiked 2–3x average range, signaling bulls trying to breach the previous day’s high and hold above 25K, while bears dragged it back from the upper zone. Such tug-of-war periods made it tricky, and traders likely faced tough moments.
However, by the end of the day, Nifty managed to close above 25,000 at 25,008.10.
This session was largely a consolidation day, similar to yesterday, with the entire movement contained within the previous day’s range, forming an Inside Bar structure.
Yesterday’s range: 120.65 points
Today’s range: 97.15 points
Gladiator Indicator shows average range: 183.74 → indicates upcoming potential expansion.
Hold tight, seat tight.
🛡 5 Min Intraday Chart with Levels
📉 Daily Time Frame Chart with Intraday Levels
🕯 Daily Candle Breakdown
Open: 24,945.50
High: 25,037.30
Low: 24,940.15
Close: 25,005.50
Change: +32.40 (+0.13%)
🏗️ Structure Breakdown
Green candle (Close > Open).
Body: 60.00 points → moderate.
Upper wick: 31.80 points.
Lower wick: 5.35 points → almost no tail.
Market closed near day’s high, showing bullish bias.
📚 Interpretation
Market remained in a narrow range (approx. 97 points).
Buyers controlled the session — open near low, close near high.
Very small lower wick → minimal selling pressure.
Upper wick reflects resistance near 25,037.
🕯Candle Type
Small Bullish Candle / Near Marubozu type → suggests steady but controlled buying.
📉📈 Short-Term View – September 11, 2025
Support: 24,940–24,945 (today’s defended zone).
Resistance: 25,030–25,040 (where price paused again).
👉 Key Insight:
Bulls are gradually pressing higher, yet stuck below 25,030–25,050 resistance band.
Context over the last two days:
Market is consolidating tightly between 24,900–25,035.
Every session reflects indecision but with a bullish undertone → buyers holding ground, sellers blocking at the top.
A clear breakout is brewing.
🛡 5 Min Intraday Chart
⚔️ Gladiator Strategy Update
ATR: 183.74
IB Range: 68.8 → Medium
Market Structure: Balanced
Trade Highlights:
12:10 AM – Long Trigger → Target Hit (R:R 1:1.5)
13:45 PM – Long Trigger → SL Hit
📌 Support & Resistance Levels
Resistance Zones:
24,975 ~ 25,004
25,035 ~ 25,140
25,160
Support Zones:
24,915 ~ 24,895
24,845 ~ 24,835
24,785
💡 Final Thoughts
Today’s session adds to the consolidation narrative, with bulls defending near 25,000 and gradual attempt to break higher resistance. A breakout above 25,040 could finally trigger fresh momentum. Until then, expect choppy action with tight ranges.
📖 “Strength grows in moments of resistance – patience pays in the end.”
✏️ Disclaimer
This is just my personal viewpoint. Always consult your financial advisor before taking any action.

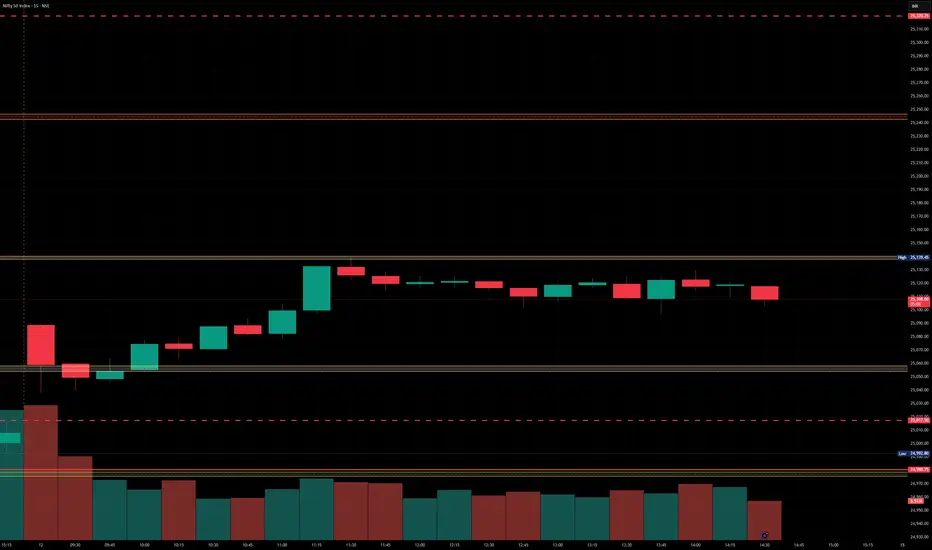
Nifty Analysis EOD – September 12, 2025 – Friday 🟢 Nifty Analysis EOD – September 12, 2025 – Friday 🔴
Momentum Building – Eyes Set on 25,240 Next
🗞 Nifty Summary
Nifty began the session with a strong 80-point gap-up, right at our first target level. A sudden retracement of 50 points found support at the previous two days' high (25,038), which became the day’s low.
From there, the index climbed gradually yet confidently toward the resistance zone of 25,085 ~ 25,095, where it paused briefly. After the breakout, a sharp move pushed the index to our second target of 25,140, marking the day’s high at 25,139.45 — just 16 points shy of the Inside Bar Pattern target.
Following this intraday expansion, the index cooled off and retraced toward the 25,085 ~ 25,095 zone, settling into a small consolidation range between 25,100 ~ 25,125. The day ended at 25,104.55 on a very positive note.
Overall, today’s session fulfilled our expectations.
👉 Tomorrow, a sustained breakout above 25,140 ~ 25,160 may open the door toward the powerful supply and resistance zone of 25,240.
🛡 5 Min Intraday Chart with Levels
📉 Daily Time Frame Chart with Intraday Levels
🕯 Daily Candle Breakdown
Open: 25,074.45
High: 25,139.45
Low: 25,038.05
Close: 25,114.00
Change: +108.50 (+0.43%)
🏗️ Structure Breakdown
Green candle (Close > Open).
Body: ~39.55 points → moderate.
Upper wick: ~25.45 points.
Lower wick: ~36.40 points.
Balanced intraday action with attempts from both bulls and bears, but closed firmly higher.
📚 Interpretation
Buyers defended 25,038–25,040 support zone consistently.
Price moved above 25,100, though sellers capped near 25,140.
The candle reflects controlled bullishness with gradual accumulation, not a runaway rally.
🕯Candle Type
Balanced bullish candle / small-bodied bullish bar → shows steady buying interest.
📉📈 Short-Term View – September 12, 2025
Support: 25,040 (defended strongly for the 4th session).
Resistance: 25,140 (fresh rejection zone).
👉 Key Insight:
The market is forming a tight upward channel with bulls gradually pushing, but sellers remain active near resistance.
Sustaining above 25,140 will be crucial to target 25,240.
📊 Context over last 3 sessions (September 4–8):
Market is holding 24,940–25,040 as a strong floor.
Each session shows a higher close → steady buying pressure accumulating.
🛡 5 Min Intraday Chart
⚔️ Gladiator Strategy Update
ATR: 178.76
IB Range: 51.7 → Medium
Market Structure: ImBalanced
Trade Highlights:
10:00 AM – Long Trigger → Target Hit (R:R - 1:2.5)
📌 Support & Resistance Levels
Resistance Zones:
25,140 ~ 25,160
25,240
Support Zones:
25,085
25,035
25,000 ~ 24,975
24,940
💡 Final Thoughts
Today’s action reflects a healthy consolidation phase with bullish undertones. Bulls are preparing for a potential breakout, while sellers defend the upper band. The next session’s ability to sustain above 25,140–25,160 will be a clear momentum trigger.
📖 “Patience in accumulation today builds strength for tomorrow’s breakout.”
✏️ Disclaimer
This is just my personal viewpoint. Always consult your financial advisor before taking any action.

Nifty 50 : Buy Triggered Nifty 50 : Buy Triggered
Important resistance levels : 25300 /25700
( Not a Buy / Sell Recommendation
Do your own due diligence ,Market is subject to risks, This is my own view and for learning only .)

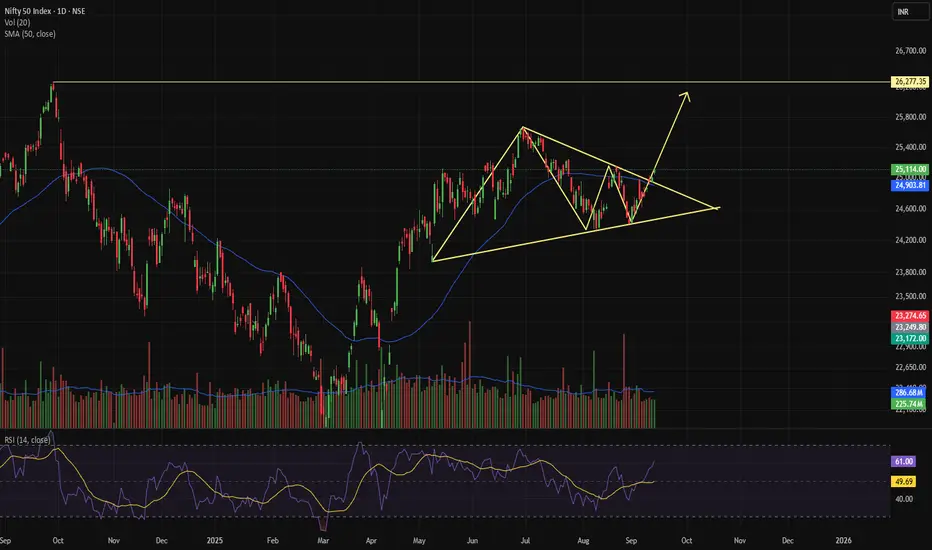
NIFTY- READY FOR UP MOVE CONFIRMATION OF TRIANGLE PATTERNThe daily candle closed above the triangle pattern, indicating a potential upward move, and the RSI index is currently at a value of 61. The first target may be the 25,650 level, while the second target could be the 26,250 level. The market is also finding support at the 50 DSMA, which reinforces the triangle pattern.
Nifty levels - Sep 15, 2025Nifty support and resistance levels are valuable tools for making informed trading decisions, specifically when combined with the analysis of 5-minute timeframe candlesticks and VWAP. By closely monitoring these levels and observing the price movements within this timeframe, traders can enhance the accuracy of their entry and exit points. It is important to bear in mind that support and resistance levels are not fixed, and they can change over time as market conditions evolve.
The dashed lines on the chart indicate the reaction levels, serving as additional points of significance to consider. Furthermore, take note of the response at the levels of the High, Low, and Close values from the day prior.
We hope you find this information beneficial in your trading endeavors.
* If you found the idea appealing, kindly tap the Boost icon located below the chart. We encourage you to share your thoughts and comments regarding it.
Wishing you success in your trading activities!
Globalization vs. Deglobalization Debate in the World MarketUnderstanding Globalization
Globalization can be defined as the process of increasing interdependence and interconnectedness among countries in economic, political, cultural, and technological dimensions. In markets, it primarily manifests as:
Free Trade Expansion – Removal of tariffs, quotas, and trade restrictions.
Global Supply Chains – Companies outsourcing production to countries with cost advantages.
Cross-Border Investments – Growth of foreign direct investment (FDI) and multinational corporations (MNCs).
Financial Integration – Capital moving across borders through stock markets, banks, and investment funds.
Technology & Communication – Internet and digitalization connecting producers, consumers, and investors worldwide.
Globalization surged after the Cold War (1990s onward), when liberalization and deregulation policies spread across emerging markets. Institutions like the World Trade Organization (WTO), International Monetary Fund (IMF), and World Bank promoted cross-border economic integration. The rise of China as the world’s factory, India’s IT revolution, and global consumer brands like Apple, Toyota, and Samsung are products of globalization.
Understanding Deglobalization
Deglobalization refers to the deliberate reduction of interdependence between nations in trade, investment, and financial flows. Instead of expanding global linkages, countries adopt policies that bring economic activities closer to home. It manifests as:
Trade Protectionism – Tariffs, quotas, and restrictions on imports.
National Industrial Policies – Encouraging domestic manufacturing (e.g., “Make in India,” “America First”).
Supply Chain Re-shoring – Companies moving production back to home countries or nearby regions.
Geopolitical Rivalries – Economic sanctions, tech wars, and restricted access to markets.
Financial Decoupling – Limiting cross-border capital exposure to reduce vulnerability.
Deglobalization does not imply complete isolation but rather a recalibration of global connections. It gained momentum post-2008 financial crisis, accelerated during COVID-19 when countries realized the risks of overdependence on global supply chains, and strengthened further with geopolitical conflicts like the Russia-Ukraine war.
Historical Evolution of Globalization & Deglobalization
The globalization-deglobalization cycle is not entirely new.
First Wave of Globalization (1870–1914): Fueled by industrial revolution, railroads, shipping, and colonialism. Trade flourished until World War I disrupted global markets.
First Wave of Deglobalization (1914–1945): Wars, the Great Depression, and protectionist policies (e.g., Smoot-Hawley Tariff in the US) restricted global trade.
Second Wave of Globalization (1945–1980s): Post-WWII reconstruction, Bretton Woods system, and the spread of liberal economic policies.
Third Wave of Globalization (1990–2008): Collapse of the Soviet Union, rise of China, internet boom, global outsourcing, and trade liberalization.
Second Wave of Deglobalization (2008–Present): Financial crises, populism, technological nationalism, environmental concerns, and supply chain reconfiguration.
Thus, globalization and deglobalization are not absolute opposites but phases of world economic history.
Globalization: Benefits and Challenges
Benefits:
Economic Growth: Expanding markets allow countries to specialize and scale production.
Lower Costs: Outsourcing and supply chains reduce production costs for consumers.
Innovation & Technology Transfer: Global collaboration accelerates knowledge sharing.
Access to Capital: Emerging economies benefit from FDI and portfolio investments.
Cultural Exchange: Travel, media, and education foster cross-cultural connections.
Challenges:
Job Displacement: Outsourcing leads to unemployment in high-cost economies.
Income Inequality: Benefits unevenly distributed between nations and social groups.
Environmental Damage: Global supply chains increase carbon emissions.
Financial Vulnerability: Global crises spread rapidly (2008, 2020).
Cultural Homogenization: Local cultures risk being overshadowed by global brands.
Deglobalization: Benefits and Challenges
Benefits:
Domestic Industry Protection: Safeguards jobs and industries from global shocks.
Supply Chain Resilience: Reduces vulnerability to disruptions.
National Security: Greater control over critical industries (food, energy, defense).
Environmental Gains: Local production may cut transport-related emissions.
Balanced Global Order: Prevents excessive dependence on a few countries (e.g., China).
Challenges:
Higher Costs: Localized production increases consumer prices.
Reduced Innovation: Less collaboration slows technological progress.
Market Fragmentation: Trade restrictions reduce efficiency of global systems.
Risk of Retaliation: Trade wars harm exporters and global supply chains.
Slower Global Growth: Reduced trade and capital flows hinder overall prosperity.
Impact on World Markets
Trade Volumes: WTO data shows slowing global trade growth since 2015.
Stock Markets: Globalization increases correlation across markets; deglobalization creates divergence.
Commodities: Oil, gas, and food supplies disrupted by geopolitical tensions.
Currencies: Dollar dominance challenged by yuan, euro, and alternative payment systems (de-dollarization debates).
Corporate Strategies: Multinationals now adopt “China+1” strategy to diversify manufacturing bases.
Future Outlook: Convergence or Divergence?
Not the End of Globalization: Rather than collapse, globalization is restructuring.
Selective Deglobalization: Nations are decoupling in strategic sectors (defense, tech, energy) while still integrating in consumer goods and services.
Regionalization: Global supply chains are evolving into regional blocs (USMCA, EU, RCEP).
Digital Globalization: Data, AI, and digital finance will shape future trade flows.
Sustainable Globalization: Green energy, climate agreements, and ESG investments may form a new framework.
Conclusion
The globalization vs. deglobalization debate is not about one force replacing the other but about how the balance shifts over time. Globalization brought unprecedented prosperity, technological progress, and interconnectedness, but it also exposed vulnerabilities such as inequality, overdependence, and fragility of global systems. Deglobalization responds to these weaknesses, yet it risks reversing gains made over decades.
In reality, the world is likely moving toward a hybrid model—“re-globalization” or “regional globalization”—where countries remain interconnected but with greater safeguards, diversification, and focus on self-reliance. The future world market will not be flat, as Thomas Friedman once wrote, but rather fragmented yet interconnected, shaped by geopolitics, technology, and sustainability imperatives.

NIFTY BREACHED TRIANGLE PATTERNDaily candle of nifty successfully breached the triangle pattern. 15-minute candle is trading between 24915 to 25035 level since last two days and closed above a trend line with support of VWAP and RSI is also showing strength. A sustainable closing above 25035 level will give buy for intraday position as well as for Positional trade.

NIFTY: Intraday & SWING Levels (NIFTY50 Spot) for 12th SEP 2025As of Now GIFT NIFTY. DJI, NASDAQ,are in +ve Bias
So there is a Possibility to GAP up OPEN.
"RL#1" Act as Strong Resistance followed by "HZ#2".
My personal Opinion Open should be Near "RL#1"
if there is no major change in Geo-Political ground.
Though as per rule i have to mention either "Long" Or "Short" and another one is "Neutral"
But I think tomorrow MKT will be Long to Short basis with big Range.
NIFTY: Intraday & SWING Levels (NIFTY50 Spot ) for 12th SEP 2025
^^^^^^^ Plot Levels Using 3 Min, 5 Min Time frame in your Chart for Better Analysis ^^^^^^^
L#1: If the candle crossed & stays above the “Buy Gen”, it is treated / considered as Bullish bias.
L#2: If the candle stays above “Sell Gen” but below “Buy Gen”, it is treated / considered as Sidewise. Aggressive Traders can take Long position near “Sell Gen” either retesting or crossed from Below & vice-versa i.e. can take Short position near “Buy Gen” either retesting or crossed downward from Above.
L#3: If the candle crossed & stays below the “Sell Gen”, it is treated / considered a Bearish bias.
L#4: Possibility / Probability of REVERSAL near RL#1 & UTgt
HZ => Hurdle Zone, Specialty of “HZ#1 & HZ#2” is Sidewise (behaviour in Nature)
Rest Plotted and Mentioned on Chart
Color code Used:
Green =. Positive bias.
Red =. Negative bias.
RED in Between Green means Trend Finder / Momentum Change
/ CYCLE Change and Vice Versa.
Notice One thing: HOW LEVELS are Working.
Use any Momentum Indicator / Oscillator or as you "USED to" to Take entry.
📢 Disclaimer
I am not a SEBI-registered financial adviser.
The information, views, and ideas shared here are purely for educational and informational purposes only. They are not intended as investment advice or a recommendation to buy, sell, or hold any financial instruments.
Please consult with your financial advisor before making any trading or investment decisions
Trading and investing in the stock market involves risk, and you should do your own research and analysis. You are solely responsible for any decisions made based on this research.
Nifty levels - Sep 12, 2025Nifty support and resistance levels are valuable tools for making informed trading decisions, specifically when combined with the analysis of 5-minute timeframe candlesticks and VWAP. By closely monitoring these levels and observing the price movements within this timeframe, traders can enhance the accuracy of their entry and exit points. It is important to bear in mind that support and resistance levels are not fixed, and they can change over time as market conditions evolve.
The dashed lines on the chart indicate the reaction levels, serving as additional points of significance to consider. Furthermore, take note of the response at the levels of the High, Low, and Close values from the day prior.
We hope you find this information beneficial in your trading endeavors.
* If you found the idea appealing, kindly tap the Boost icon located below the chart. We encourage you to share your thoughts and comments regarding it.
Wishing you success in your trading activities!

Trading Instruments in global market 1. Equities (Stocks)
Definition
Equities, also called stocks or shares, represent ownership in a company. By buying a share, an investor becomes a partial owner of that company and is entitled to a portion of profits (dividends) and potential capital appreciation.
Key Characteristics
Ownership: A share means holding equity in a company.
Voting rights: Common stockholders can vote in company decisions.
Returns: Gains come from dividends and share price appreciation.
Liquidity: Highly liquid, especially in large stock exchanges like NYSE, NASDAQ, NSE, and LSE.
Types of Equities
Common Stock – Offers voting rights and dividends.
Preferred Stock – Fixed dividends but limited/no voting rights.
Blue-Chip Stocks – Shares of large, stable companies.
Growth Stocks – Companies with high potential for expansion.
Penny Stocks – Low-priced, high-risk speculative shares.
Global Relevance
Equities are among the most popular instruments globally because they allow both short-term trading and long-term wealth creation. For example:
The US stock market is worth over $50 trillion.
Emerging markets like India, Brazil, and China are attracting growing investor interest due to rapid economic growth.
2. Fixed-Income Securities (Bonds)
Definition
A bond is essentially a loan made by an investor to a borrower (government, corporation, or institution). The borrower promises to pay interest (coupon) and return the principal on maturity.
Key Characteristics
Low risk (relative to stocks), especially in government bonds.
Predictable returns in the form of interest.
Variety of maturities (short, medium, and long-term).
Types of Bonds
Government Bonds (Treasuries, Gilts, Sovereign Bonds) – Issued by national governments.
Corporate Bonds – Issued by companies to raise capital.
Municipal Bonds – Issued by cities or states.
High-Yield (Junk) Bonds – Riskier but offer higher returns.
Inflation-Indexed Bonds – Adjust payouts with inflation rates.
Global Relevance
The US Treasury market is the largest bond market in the world and a global benchmark for interest rates.
Countries issue bonds to finance deficits, making them a cornerstone of international trade and finance.
3. Currencies (Foreign Exchange or Forex)
Definition
Currencies are the most liquid instruments globally, traded in the foreign exchange (forex) market, which has a daily turnover of over $7.5 trillion (2025 est.).
Key Characteristics
24-hour trading (Monday–Friday).
High leverage availability for traders.
Paired trading (e.g., USD/INR, EUR/USD, GBP/JPY).
Heavily influenced by macroeconomic policies, central banks, and geopolitics.
Major Currency Pairs
Major Pairs: EUR/USD, GBP/USD, USD/JPY, USD/CHF.
Minor Pairs: EUR/GBP, AUD/JPY.
Exotic Pairs: USD/INR, USD/TRY.
Uses
Businesses hedge against currency fluctuations.
Central banks maintain stability.
Traders speculate on price movements.
4. Commodities
Definition
Commodities are physical goods that are traded on exchanges, often used as raw materials in production.
Types of Commodities
Metals – Gold, Silver, Copper, Platinum.
Energy – Crude Oil, Natural Gas, Coal.
Agricultural Products – Wheat, Coffee, Cotton, Soybeans.
Livestock – Cattle, Hogs.
Key Characteristics
Hedging tool against inflation (gold, oil).
Geopolitical sensitivity (oil prices surge in wars/conflicts).
Global trade-driven demand and supply.
Global Relevance
Oil is the most traded commodity, central to global energy.
Gold acts as a safe-haven asset during economic uncertainty.
Agricultural commodities impact food security and global trade.
5. Derivatives
Definition
Derivatives are contracts whose value is derived from an underlying asset (stocks, bonds, currencies, or commodities).
Types of Derivatives
Futures – Agreements to buy/sell at a future date at a set price.
Options – Rights (not obligations) to buy/sell at a specific price.
Swaps – Contracts to exchange cash flows (e.g., interest rate swaps).
Forwards – Customized contracts between two parties.
Key Characteristics
Used for hedging risk (e.g., airlines hedge fuel prices).
Allow speculation on future price movements.
Offer leverage, amplifying gains/losses.
Global Relevance
The derivatives market is massive—worth quadrillions in notional value.
Exchanges like CME, ICE, and NSE are major global hubs.
6. Exchange-Traded Funds (ETFs) & Mutual Funds
ETFs
Traded like stocks on exchanges.
Track indexes, sectors, or commodities (e.g., SPDR S&P 500 ETF).
Offer diversification at low cost.
Mutual Funds
Actively managed investment vehicles.
Pool money from investors to buy diversified securities.
Suitable for long-term investors.
Global Relevance
ETFs have become highly popular among retail investors.
India and Asia are seeing a surge in passive investing via ETFs.
7. Real Estate Investment Trusts (REITs)
Definition
REITs are companies that own, operate, or finance income-generating real estate (offices, malls, warehouses).
Benefits
Provide exposure to real estate without direct ownership.
Offer dividends from rental income.
Highly liquid compared to physical property.
Global Relevance
REITs are major in the US, Singapore, and Australia, while India has introduced them in recent years for commercial real estate.
8. Hedge Funds & Private Equity Instruments
Hedge Funds
Pool money from wealthy investors to take aggressive positions.
Use derivatives, leverage, and short-selling.
Private Equity (PE)
Invests directly in private companies or buyouts.
Long-term, illiquid, but high potential returns.
Global Relevance
Hedge funds influence markets with speculative bets.
PE drives business growth, restructuring, and IPOs.
9. Cryptocurrencies & Digital Assets
Definition
Cryptocurrencies are decentralized digital currencies using blockchain technology.
Examples
Bitcoin (BTC) – The most popular crypto.
Ethereum (ETH) – Smart contracts and decentralized apps.
Stablecoins (USDT, USDC) – Pegged to fiat currencies.
Central Bank Digital Currencies (CBDCs) – Being developed by governments.
Characteristics
Volatile and speculative.
24/7 global trading.
Used for payments, remittances, and decentralized finance (DeFi).
Global Relevance
Cryptos are gaining institutional acceptance.
Some countries (El Salvador) have adopted Bitcoin as legal tender.
CBDCs could reshape global payment systems.
10. Alternative Trading Instruments
Carbon Credits – Traded to offset emissions.
Weather Derivatives – Used by agriculture/energy companies to hedge risks.
Art & Collectibles – NFTs and physical art as investment assets.
VIX Futures – Trading volatility index as a fear gauge.
Conclusion
The global market is a vast ocean of trading instruments, each serving a distinct purpose. From the stability of bonds to the high-risk-high-reward world of derivatives and cryptocurrencies, these instruments cater to every kind of investor—risk-averse savers, speculative traders, hedging corporates, and long-term wealth builders.
Understanding these instruments is crucial because the modern financial world is deeply interconnected. A shift in interest rates affects bonds, currencies, equities, and commodities simultaneously. Similarly, geopolitical events ripple across forex, oil, and stock markets.
For traders and investors, the key lies in:
Selecting the right mix of instruments.
Managing risks using diversification and hedging.
Staying updated on global economic and geopolitical trends.
In essence, trading instruments are not just tools of profit—they are the lifeblood of the global financial system. Mastering them is mastering the art of navigating global markets.

NIFTY - BULLISH Nifty is forming Bullish pattern on Daily chart with rising MACD bullish crossover and W pattern looks active now...
Stoploss 24700 Closing Basis
Target: 25700 26100
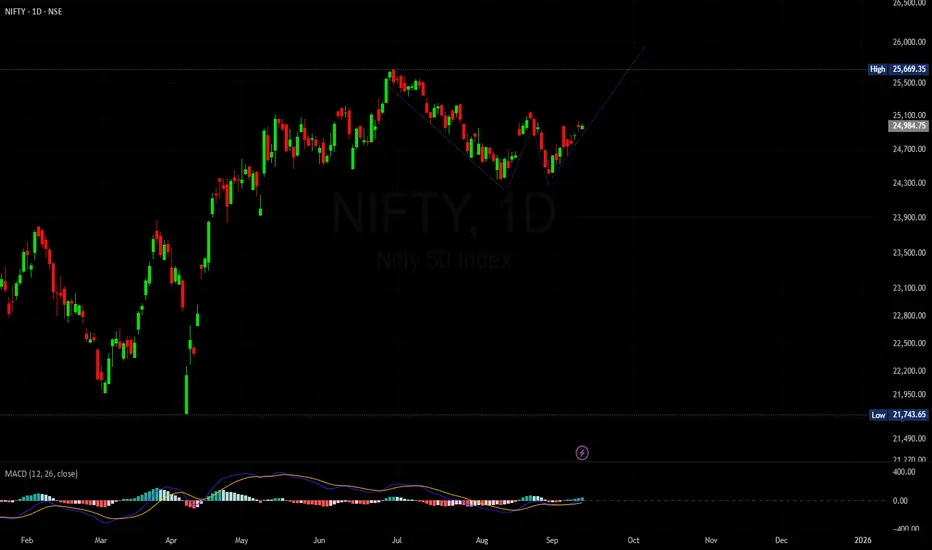
Nifty -- Ready to take off, or still a bait for buyers?Based on my analysis of the price action and RSI, W pattern formation is about to completed which may take the prices back to ATH.
RSI is moving swiftly and ready to move ahead the previous pivot. Also, price is above key EMA's.
Little support from BNF should kickstart the rally.
I will keep updating the chart with further analysis.
Nifty series #1.

Nifty Analysis EOD – September 10, 2025 – Wednesday🟢 Nifty Analysis EOD – September 10, 2025 – Wednesday 🔴
📌 Doji at Resistance – Market in Consolidation Grip
🗞 Nifty Summary
Nifty opened with a 114-point gap-up, well above the previous day’s high and right in the middle of the strong resistance zone of 24,975 ~ 25,004. Initially, the index attempted to stabilize and hold above 25,000, but couldn’t sustain the level. It gradually lost ground, broke the VWAP and day’s low, marking a low of 24,915.
A recovery of 75 points from the low brought Nifty back to 24,977.5 at close, resulting in a Doji candle formed near the middle of the resistance zone.
Such large gap-ups or gap-downs are not favorable for intraday players, and positional BTST option buyers were left vulnerable, as the first-minute slip wiped out initial gains.
🛡 5 Min Intraday Chart with Levels
📉 Daily Time Frame Chart with Intraday Levels
🕯 Daily Candle Breakdown
Open: 24,991.00
High: 25,035.70
Low: 24,915.05
Close: 24,973.10
Change: +104.50 (+0.42%)
🏗️ Structure Breakdown
Red candle (Close < Open).
Body: 17.90 points → small.
Upper wick: 44.70 points.
Lower wick: 58.05 points.
This forms a Spinning Top-type candle with long shadows on both sides → indicative of intraday tug-of-war.
📚 Interpretation
Market opened near 25,000, briefly touched 25,035, but sellers rejected higher levels.
Buyers defended 24,915, as seen from the long lower wick.
Closing slightly below open signals mild bearish pressure despite overall gains compared to the previous close.
This is a classic indecision candle, with bulls managing to hold ground but failing to assert dominance.
🕯Candle Type
Spinning Top / Indecision Candle with balanced pressure leaning slightly bearish (due to red close).
📉📈 Short-Term View – September 11, 2025
Support: 24,910 – 24,915 (defended today).
Resistance: 25,030 – 25,050 (strong supply zone with multiple rejections).
👉 Key Insight:
Bulls are trying to protect 24,900 but facing strong resistance near 25,030–25,050.
Market is consolidating and coiling tighter between 24,900–25,050.
A breakout above 25,050 may trigger fresh momentum towards 25,160, while a dip below 24,900 opens risk toward 24,750.
🛡 5 Min Intraday Chart
⚔️ Gladiator Strategy Update
ATR: 193.36
IB Range: 59.3 → Small
Market Structure: Balanced
Trade Highlights:
10:30 AM – Long Trigger → SL Hit
13:20 PM – Short Trigger → SL Hit
📌 Support & Resistance Levels
Resistance Zones:
24,975 ~ 25,004
25,035 ~ 25,140
25,160
Support Zones:
24,915 ~ 24,895
24,845 ~ 24,835
24,785
💡 Final Thoughts
Today’s indecisive spinning top reflects a market stuck in consolidation, caught between supply and demand. Until a decisive breakout occurs, avoid large positional bets and remain focused on intraday tactical trades.
📖 “Patience in consolidation builds the strongest trends later.”
✏️ Disclaimer
This is just my personal viewpoint. Always consult your financial advisor before taking any action.

Nifty 50: Struggling to close above 25k Mark
Nifty 50: Struggling to close above 25k Mark
Almost sitting at the Buy Signal .
( Not a Buy / Sell Recommendation
Do your own due diligence ,Market is subject to risks, This is my own view and for learning only .)

Nifty analysis for 11.September.2025Market forming Triangle pattern and made a Spinning top at resistance level. If the market closes above the marked resistance level then we can see a big move in future. Otherwise market will fall into the triangle pattern still support line of the pattern.

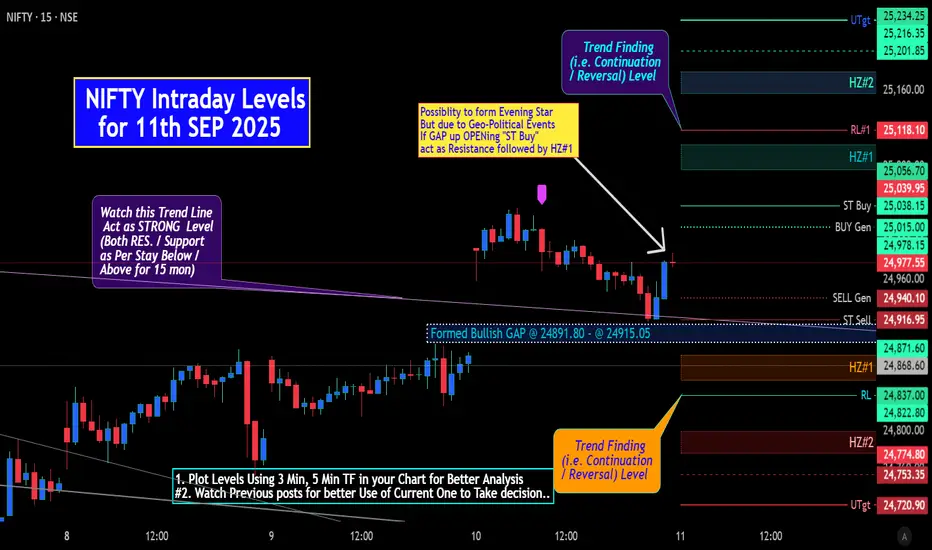
NIFTY: Intraday Levels for 08th SEP 2025 (NIFTY50 Spot)NIFTY: Intraday Levels for 08th SEP 2025 (NIFTY50 Spot)
Possibility to form Evening Star. But due to Geo-Political Events If OPEN with GAP up "ST Buy" act as Resistance followed by HZ#1
^^^^^^^ Plot Levels Using 3 Min, 5 Min Time frame in your Chart for Better Analysis ^^^^^^^
L#1: If the candle crossed & stays above the “Buy Gen”, it is treated / considered as Bullish bias.
L#2: If the candle stays above “Sell Gen” but below “Buy Gen”, it is treated / considered as Sidewise. Aggressive Traders can take Long position near “Sell Gen” either retesting or crossed from Below & vice-versa i.e. can take Short position near “Buy Gen” either retesting or crossed downward from Above.
L#3: If the candle crossed & stays below the “Sell Gen”, it is treated / considered a Bearish bias.
L#4: Possibility / Probability of REVERSAL near RL#1 & UTgt
HZ => Hurdle Zone, Specialty of “HZ#1 & HZ#2” is Sidewise (behaviour in Nature)
Rest Plotted and Mentioned on Chart
Color code Used:
Green =. Positive bias.
Red =. Negative bias.
RED in Between Green means Trend Finder / Momentum Change
/ CYCLE Change and Vice Versa.
Notice One thing: HOW LEVELS are Working.
Use any Momentum Indicator / Oscillator or as you "USED to" to Take entry.
📢 Disclaimer
I am not a SEBI-registered financial adviser.
The information, views, and ideas shared here are purely for educational and informational purposes only. They are not intended as investment advice or a recommendation to buy, sell, or hold any financial instruments.
Please consult with your financial advisor before making any trading or investment decisions
Trading and investing in the stock market involves risk, and you should do your own research and analysis. You are solely responsible for any decisions made based on this research.
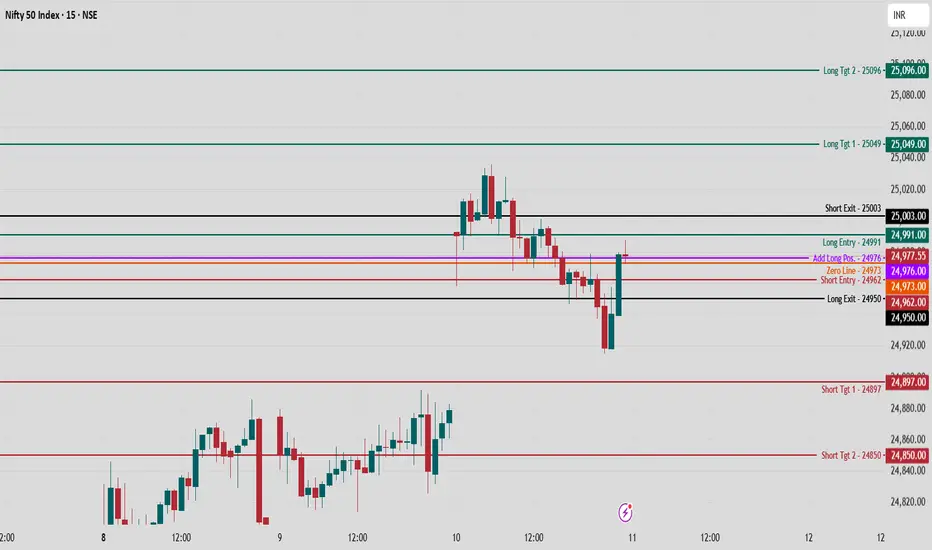
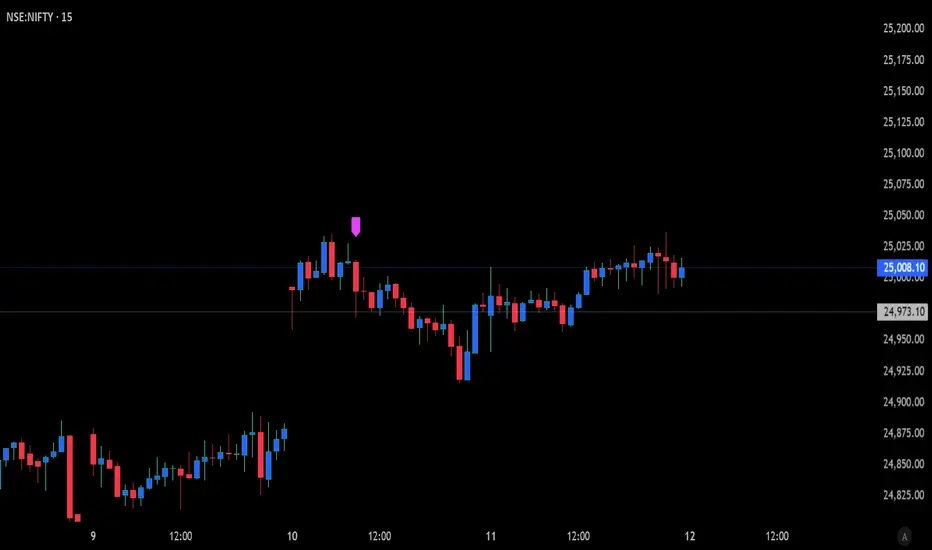
Nifty 50 Intraday Technical Chart Analysis for 11 Sept., 2025Nifty 50 Index on the 15-minute chart is showing key inflection levels with potential trade opportunities around the 24,973–24,991 zone.
Market Context and Bias
The Index has exhibited strong volatility with an initial downtrend, followed by a sharp bullish reversal candle near intraday lows.
The price is currently testing the “Zero Line” at 24,973 and hovering just below Long Entry at 24,991, suggesting this area is a key battleground between bulls and bears.
Key Levels and Trade Triggers
Long Bias: If sustained above 24,991 (Long Entry), potential targets are 25,049 (Long Tgt 1) and 25,096 (Long Tgt 2). A stop-loss can be managed below 24,962 (Long Exit).
Short Bias: Breakdown below 24,962 (Long Exit) can lead toward 24,897 (Short Tgt 1) and 24,850 (Short Tgt 2), with stops above 24,991.
Neutral/Wait for Confirmation: Zero Line at 24,973 acts as a pivot. Wait for a decisive close above/below for trend confirmation.
Trade Management and Sentiment
Conservative traders can initiate positions above 24,977–24,991 after pullback confirmation, targeting higher resistance, while aggressive short trades are suitable on break and retest below 24,962.
Price action within these triggers reflects a high-stakes zone; avoid over-leverage and maintain discipline at decision points.
Nifty at critical decision zone — watch for sustained move above 24,991 for bullish action, or breakdown below 24,962 for sellers to dominate.
Follow for more such updates!