Nifty is trying to break the cage to fly upwards. As you can see Nifty staged a recovery today and crossed the first hurdle that is the Mother line (50 Hours EMA) and closed about it. Not the 2 important hurdles staring at it are the trend line resistance at 24740 and Father line (200 Hours EMA) at 24780.
Bulls will be comfortable after we get a closing above these 2 hurdles. Once these hurdles are crossed we will find some resistances near 24917, 25029 and finally 25148.
The support zones for Nifty currently are at 24674 (Mother line support of 50 hours EMA), 24527 and finally 24339. Bears will control the market if we get a closing below 24339.
Disclaimer: The above information is provided for educational purpose, analysis and paper trading only. Please don't treat this as a buy or sell recommendation for the stock or index. The Techno-Funda analysis is based on data that is more than 3 months old. Supports and Resistances are determined by historic past peaks and Valley in the chart. Many other indicators and patterns like EMA, RSI, MACD, Volumes, Fibonacci, parallel channel etc. use historic data which is 3 months or older cyclical points. There is no guarantee they will work in future as markets are highly volatile and swings in prices are also due to macro and micro factors based on actions taken by the company as well as region and global events. Equity investment is subject to risks. I or my clients or family members might have positions in the stocks that we mention in our educational posts. We will not be responsible for any Profit or loss that may occur due to any financial decision taken based on any data provided in this message. Do consult your investment advisor before taking any financial decisions. Stop losses should be an important part of any investment in equity.
Trade ideas

NIFTY Intraday Level for 04th SEP 2025Though I mentioned LONG, but it may be a MIX of UP and DOWN.
Watch Levels with your choice indicator or Indicator Oscillator setup .
All Plotted and Mentioned on Chart.
Color code:
Green =. Positive bias.
Red =. Negative bias.
RED in Between Green means Trend Finder / Momentum Change
/ CYCLE Change and Vice Versa.
Notice One thing: HOW LEVELS are Working.
Use any Momentum Indicator / Oscillator or as you "USED to" to Take entry.
Disclaimer: Study Purpose only.
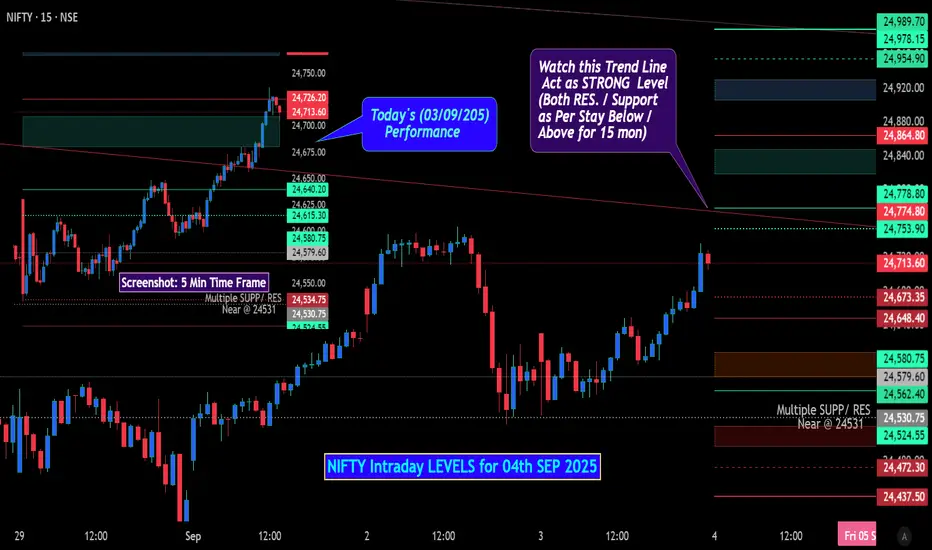
Nifty levels - Sep 04, 2025Nifty support and resistance levels are valuable tools for making informed trading decisions, specifically when combined with the analysis of 5-minute timeframe candlesticks and VWAP. By closely monitoring these levels and observing the price movements within this timeframe, traders can enhance the accuracy of their entry and exit points. It is important to bear in mind that support and resistance levels are not fixed, and they can change over time as market conditions evolve.
The dashed lines on the chart indicate the reaction levels, serving as additional points of significance to consider. Furthermore, take note of the response at the levels of the High, Low, and Close values from the day prior.
We hope you find this information beneficial in your trading endeavors.
* If you found the idea appealing, kindly tap the Boost icon located below the chart. We encourage you to share your thoughts and comments regarding it.
Wishing you success in your trading activities!

Impact of Trade Wars on Global CommoditiesUnderstanding Trade Wars
Definition
A trade war occurs when countries engage in escalating retaliatory trade barriers, such as tariffs (taxes on imports), export bans, or quotas. Unlike routine trade disputes resolved through institutions like the World Trade Organization (WTO), trade wars are prolonged confrontations that can severely disrupt global supply chains.
Causes of Trade Wars
Protection of domestic industries – Governments impose tariffs to shield local producers from cheaper foreign imports.
Geopolitical tensions – Strategic rivalry between powers (e.g., U.S.–China).
Perceived unfair trade practices – Accusations of currency manipulation, dumping, or intellectual property theft.
Political populism – Leaders appeal to domestic audiences by promising to revive manufacturing or agriculture.
Mechanisms of Impact
Trade wars affect commodities through:
Tariffs: Increasing the cost of imports reduces demand.
Supply chain disruptions: Restrictions create shortages or gluts in certain markets.
Currency fluctuations: Retaliatory measures often cause volatility in exchange rates.
Investor sentiment: Commodities markets react to uncertainty with price swings.
Historical Trade Wars and Commodities Impact
The U.S.–China Trade War (2018–2020)
The most notable recent example is the U.S.–China trade war, where both nations imposed tariffs on billions of dollars’ worth of goods. Its impact on commodities was profound:
Agricultural Products: China, a major buyer of U.S. soybeans, shifted its purchases to Brazil and Argentina. U.S. farmers faced significant losses, while South American exporters gained.
Metals: U.S. tariffs on Chinese steel and aluminum disrupted global metals supply, increasing costs for downstream industries.
Oil and Gas: China reduced imports of U.S. crude oil, turning to Russia and the Middle East instead.
1970s Oil Crisis and Resource Nationalism
While not a conventional “trade war,” the OPEC oil embargo of 1973 illustrates how commodity trade restrictions can destabilize global markets. By restricting oil exports, OPEC caused a dramatic rise in crude oil prices, triggering global inflation and recessions.
Japan–U.S. Trade Disputes (1980s–1990s)
The U.S. imposed restrictions on Japanese automobiles, semiconductors, and steel. While not as aggressive as the China case, it influenced global steel and automotive commodity supply chains.
Impact on Different Commodities
1. Agricultural Commodities
Trade wars hit agriculture hardest because food products are politically sensitive and heavily traded.
Soybeans: In the U.S.–China conflict, soybean exports from the U.S. plummeted by over 50% in 2018. Brazil emerged as the biggest beneficiary.
Wheat and Corn: Farmers faced surplus production when markets closed, leading to lower farm incomes.
Meat and Dairy: Tariffs on pork and beef reduced demand, leading to oversupply and lower domestic prices.
Key Point: Agricultural producers in exporting countries often lose, while rival exporters in neutral countries gain market share.
2. Energy Commodities
Energy is both a strategic and economic commodity. Trade wars disrupt supply chains and create uncertainty.
Crude Oil: During the U.S.–China dispute, China reduced U.S. crude imports. Instead, it boosted imports from Russia, reshaping global oil flows.
Liquefied Natural Gas (LNG): China, a top LNG importer, reduced its contracts with U.S. suppliers, affecting American energy exports.
Coal: Tariffs on coal imports can shift demand toward domestic suppliers, though with environmental consequences.
Result: Trade wars encourage diversification of energy suppliers, altering global energy geopolitics.
3. Metals and Minerals
Metals are essential inputs for manufacturing and construction. Tariffs in this sector ripple across industries.
Steel and Aluminum: U.S. tariffs in 2018 raised global prices temporarily, hurting consumers (e.g., automakers) but boosting U.S. domestic producers.
Copper: As a key industrial metal, copper prices fell due to weaker global demand expectations from trade wars.
Rare Earth Elements: China, controlling over 80% of rare earth supply, threatened export restrictions during tensions—causing panic in tech and defense industries.
Observation: Strategic metals become bargaining chips in geopolitical disputes.
4. Precious Metals
Gold, silver, and platinum group metals behave differently in trade wars:
Gold: Seen as a “safe haven,” gold prices typically rise during trade war uncertainty. Example: Gold surged during U.S.–China tensions.
Silver and Platinum: Both industrial and investment commodities, they experience mixed effects—falling demand from industries but rising investor interest.
Economic Consequences of Commodity Disruptions
For Producers
Loss of export markets (e.g., U.S. soybean farmers).
Price crashes in domestic markets due to oversupply.
Increased costs if reliant on imported raw materials.
For Consumers
Higher prices for finished goods (e.g., cars with more expensive steel).
Reduced availability of certain products.
Inflationary pressures in commodity-importing nations.
For Global Markets
Increased volatility in commodity exchanges (CME, LME).
Shifts in global trade flows, creating winners and losers.
Distortion of investment decisions in commodities futures markets.
Case Studies
Case Study 1: U.S. Soybean Farmers
When China imposed tariffs on U.S. soybeans, American farmers saw exports fall from $12 billion in 2017 to $3 billion in 2018. Despite government subsidies, many small farmers struggled. Brazil, however, expanded its exports to China, reshaping global agricultural trade.
Case Study 2: Steel Tariffs and the U.S. Auto Industry
The Trump administration’s tariffs on steel and aluminum in 2018 increased input costs for U.S. automakers. While domestic steel producers benefited, car manufacturers faced rising costs, reducing their global competitiveness.
Case Study 3: Rare Earths and Tech Industry
China’s threat to restrict rare earth exports during trade tensions with the U.S. in 2019 raised concerns for tech manufacturers, as rare earths are critical for smartphones, batteries, and defense equipment. Prices surged globally, forcing nations to seek alternative suppliers.
Long-Term Structural Shifts
Trade wars don’t just have short-term impacts; they reshape global commodity systems.
Diversification of Supply Chains
Importers diversify sources to reduce dependence on hostile nations. Example: China diversifying soybean imports beyond the U.S.
Rise of Regional Trade Blocs
Countries form regional agreements (e.g., RCEP, USMCA) to secure commodity flows.
Strategic Stockpiling
Nations build reserves of critical commodities (oil, rare earths, grains) to withstand disruptions.
Technological Substitution
Trade wars accelerate R&D in substitutes (e.g., battery technologies reducing dependence on cobalt).
Shift in Investment Flows
Investors prefer politically stable commodity suppliers, leading to long-term realignments.
Winners and Losers
Winners
Neutral exporting countries that capture lost market share (e.g., Brazil in soybeans).
Domestic producers shielded by tariffs (e.g., U.S. steel).
Investors in safe-haven commodities like gold.
Losers
Farmers and exporters in targeted nations.
Consumers facing higher prices.
Global growth, as uncertainty reduces trade volumes and investment.
Future Outlook
Increasing Commodities Nationalism
Countries may increasingly weaponize commodities as tools of leverage in geopolitical disputes.
Technology and Substitutes
Trade wars may accelerate innovation, such as renewable energy reducing reliance on imported fossil fuels.
Institutional Reforms
The WTO and other institutions may need reforms to mediate commodity-related disputes more effectively.
Climate Change Factor
As climate change reshapes commodity production (e.g., agriculture, water, energy), trade wars could worsen resource scarcity and volatility.
Conclusion
The impact of trade wars on global commodities is multi-dimensional and far-reaching. From agriculture to energy, metals to precious resources, trade disputes disrupt flows, distort prices, and realign global supply chains. While some nations or industries benefit temporarily, the broader effect is one of uncertainty, inefficiency, and economic loss.
In the long run, trade wars reshape the architecture of commodity markets—encouraging diversification, regionalism, and innovation. However, they also raise questions about the sustainability of globalization and the ability of international institutions to maintain stability in a fracturing world.
Ultimately, commodities—being the backbone of human survival and industrial growth—remain at the heart of trade wars. Understanding their dynamics is crucial not only for policymakers and businesses but also for ordinary citizens whose livelihoods are directly or indirectly tied to global trade.
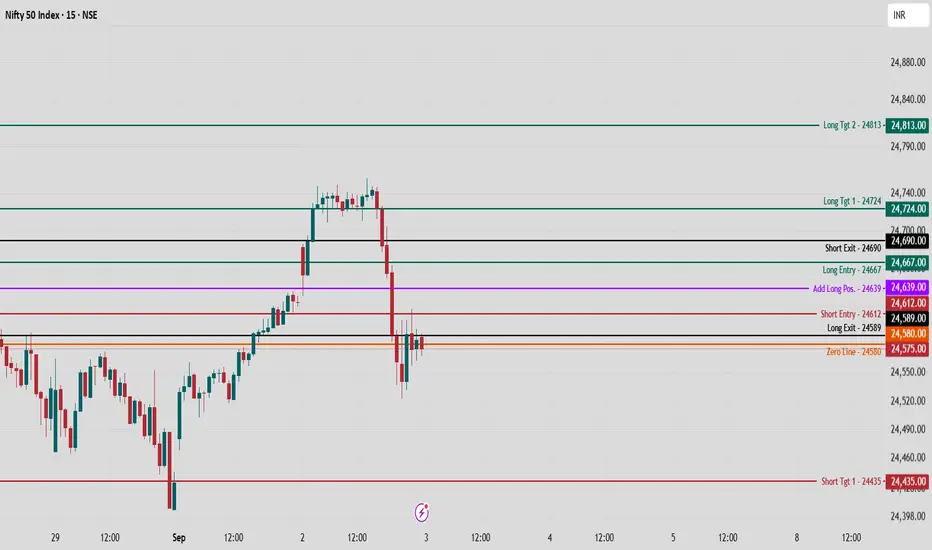
Intraday Analysis - Nifty 50 Index - September 3, 2025Welcome! Here is the intraday analysis for the Nifty 50 Index on September 3, 2025, blending key technical perspectives and practical trade strategy for the day.
Trade Bias
Nifty 50 closed in red, indicating continued bearish momentum and a follow-up of the prior higher pullback. The overall intraday bias is neutral-to-bearish unless the index decisively reclaims key resistance.
Trade Logic
Short Setup:
Ideal short entries emerge if Nifty sustains below the 24,580 Zero Line or shows rejection around 24,690 (Short Exit).
Look for a clear bearish candle structure as confirmation before entering shorts.
Momentum below 24,580 can drive the move toward 24,435 (Short Tgt 1) and 24,346 (Short Tgt 2).
Long Setup:
Potential long entries can be considered on a close and sustained move above 24,589 (Long Exit level), as this allows entries near a tight stoploss and open opportunity toward higher resistance.
Watch for a convincing breakout above 24,639 (Add Long Pos.) and 24,667 (Long Entry), targeting 24,724 (Long Tgt 1) and 24,813 (Long Tgt 2).
Sideways Possibility:
If price consolidates between 24,612 and 24,667, it is best to remain on the sidelines until a clear breakout or breakdown is confirmed with volume and price action.
Trade Opportunities
Aggressive Shorts:
Go short on a close below 24,580 with downside targets at 24,435 and 24,346, using 24,589 or 24,612 as stoploss or risk levels.
Alternatively, look for rejection trades around 24,690 if bearish structure persists.
Aggressive Longs:
Go long if price sustains above 24,589 with tight stops and immediate targets at 24,639 and 24,667. If momentum continues, aim for higher levels 24,724 and 24,813.
Disclaimer
This analysis is for educational purposes only and does not constitute financial advice. Intraday trading is risky—always use strict stoploss, practice risk management, and consult a certified financial adviser before making trading decisions.
Reciprocate Your Love!
If this analysis adds value to your trading day, please follow Chart Pathik for more actionable Nifty 50 and index setups. Share thoughts and questions in the comments for more tailored strategies!
Trade safe, stay disciplined, and happy trading!
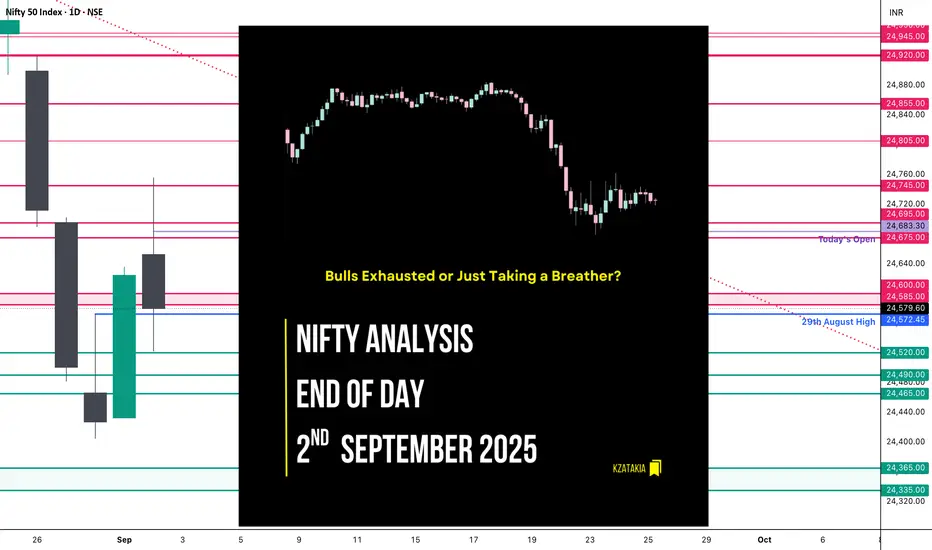
Nifty Analysis EOD – September 2, 2025 – Tuesday🟢 Nifty Analysis EOD – September 2, 2025 – Tuesday 🔴
Bulls Exhausted or Just Taking a Breather?
🗞 Nifty Summary
Nifty opened with a 62-point gap-up above the previous day’s high, but the excitement didn’t last long. The index quickly rushed to fill the gap, pulled back, and initially tried to extend the bullish sentiment from yesterday. However, the 24,750 hurdle proved too strong.
After multiple failed attempts to break above it, Nifty slipped below key supports — mean, CDL, PDH, PDC, and the 24,600–24,585 support zone — finally taking a pause around 24,520.
The big question: Was this just a weekly expiry adjustment or early signs of bullish momentum exhaustion?
For the upcoming sessions, the critical range is 24,750 ~ 24,500.
🛡 5 Min Intraday Chart with Levels
📉 Daily Time Frame Chart with Intraday Levels
🕯️ Daily Candle Breakdown
Open: 24,653.00
High: 24,756.10
Low: 24,522.35
Close: 24,579.60
Change: −45.45 (−0.18%)
🏗️ Structure Breakdown
Red candle (Close < Open).
Body: 73.40 points → moderate.
Upper wick: 103.10 points (strong rejection near high).
Lower wick: 57.25 points (buyers attempted defense).
This created a long upper wick → intraday bullish attempt got rejected.
🕯Candle Type
Shooting Star–like red candle → reflects bullish exhaustion and supply pressure.
📚 Interpretation
Gap-up open above previous close (24,625 → 24,653).
Bulls attempted to break 24,750, but failed multiple times.
Sellers dominated late, dragging the index red.
Strong rejection shows supply pressure near 24,750.
📉 Short-Term View
Resistance: 24,750 (rejection zone).
Support: 24,520 (today’s low).
Context: Yesterday’s bullish Marubozu was negated by today’s failure.
👉 If bulls reclaim 24,750+, momentum revives.
👉 If 24,520 breaks, sellers may gain the upper hand.
In short: Market is in a tug-of-war zone between 24,750 and 24,520.
🛡 5 Min Intraday Chart
⚔️ Gladiator Strategy Update
ATR: 205.07
IB Range: 98.85 → Medium
Market Structure: Balanced
Trade Highlight:
13:50 Short Trigger → Target Hit (R:R = 1:1.5)
📌 Support & Resistance Levels
Resistance Zones:
24,675 ~ 24,695
24,745
24,805
24,855
Support Zones:
24,575
24,520
24,490 ~ 24,465
💭 Final Thoughts
The index showed signs of exhaustion near 24,750. Whether this is just expiry-related or a genuine pause in momentum, tomorrow’s action will confirm.
"Markets don’t lie, they whisper. Today’s rejection was one such whisper — respect it."
✏️ Disclaimer
This is just my personal viewpoint. Always consult your financial advisor before taking any action.
Nifty unable to cross Important Resistances today. Nifty failed to capitalise a good start today and fell sharply from highs of the day to close in the negative. Nifty today made a high of 24756 but closed 177 points below this level at 24759. This was due to a Trend line resistance near the day's high. It is a complex chart giving mixed signals but for further growth of Nifty it has to close above 3 important resistances which are at 24682 Mother line resistance of hourly chart, 24756 trend line resistance and finally 24790 which is the father line of hourly chart. If we get a closing above 24790 we can see further resistance at 24927 before Nifty is able to touch 25K again. Support for Nifty currently are at 24522, 24410 and 24336. If the support at 24336 is broken we will see further down side in Nifty.
Disclaimer: The above information is provided for educational purpose, analysis and paper trading only. Please don't treat this as a buy or sell recommendation for the stock or index. The Techno-Funda analysis is based on data that is more than 3 months old. Supports and Resistances are determined by historic past peaks and Valley in the chart. Many other indicators and patterns like EMA, RSI, MACD, Volumes, Fibonacci, parallel channel etc. use historic data which is 3 months or older cyclical points. There is no guarantee they will work in future as markets are highly volatile and swings in prices are also due to macro and micro factors based on actions taken by the company as well as region and global events. Equity investment is subject to risks. I or my clients or family members might have positions in the stocks that we mention in our educational posts. We will not be responsible for any Profit or loss that may occur due to any financial decision taken based on any data provided in this message. Do consult your investment advisor before taking any financial decisions. Stop losses should be an important part of any investment in equity.

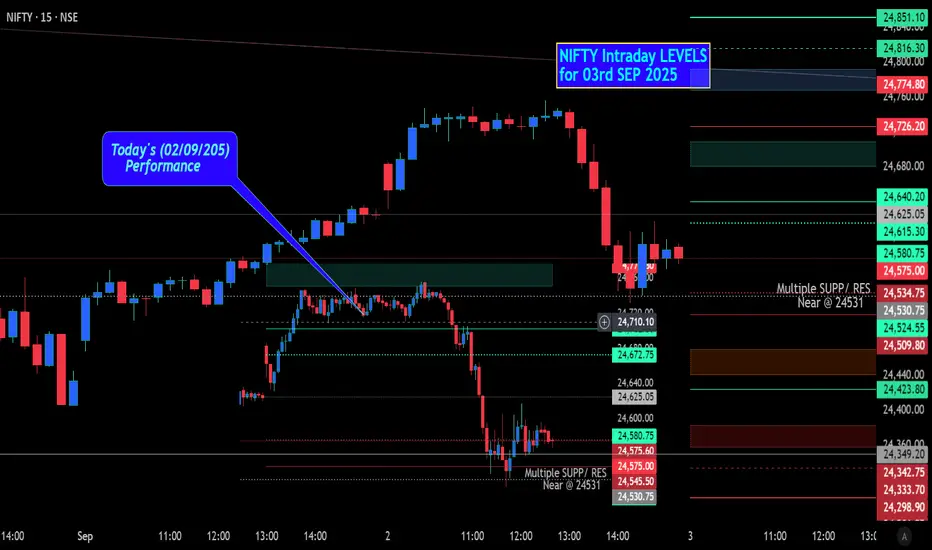
NIFTY Intraday Level for 03rd SEP 2025All Plotted and Mentioned on Chart.
Colour code:
Green =. Positive bias.
Red =. Negative bias.
RED in Between Green means Trend Finder / Momentum Change
/ CYCLE Change and Vice Versa.
Notice One thing: HOW LEVELS are Working.
Use any Momentum Indicator / Oscillator as you "USED to" to Take entry.
Disclaimer: Study Purpose only.
Nifty levels - Sep 03, 2025Nifty support and resistance levels are valuable tools for making informed trading decisions, specifically when combined with the analysis of 5-minute timeframe candlesticks and VWAP. By closely monitoring these levels and observing the price movements within this timeframe, traders can enhance the accuracy of their entry and exit points. It is important to bear in mind that support and resistance levels are not fixed, and they can change over time as market conditions evolve.
The dashed lines on the chart indicate the reaction levels, serving as additional points of significance to consider. Furthermore, take note of the response at the levels of the High, Low, and Close values from the day prior.
We hope you find this information beneficial in your trading endeavors.
* If you found the idea appealing, kindly tap the Boost icon located below the chart. We encourage you to share your thoughts and comments regarding it.
Wishing you success in your trading activities!

NIFTY KEY LEVELS FOR 02.09.2025NIFTY KEY LEVELS FOR 02.09.2025
RTF: 3 Minutes
If the candle stays above the pivot point, it is considered a bullish bias; if it remains below, it indicates a bearish bias. Price may reverse near Resistance 1 or Support 1. If it moves further, the next potential reversal zone is near Resistance 2 or Support 2. If these levels are also broken, we can expect the trend.
If the range(R2-S2) is narrow, the market may become volatile or trend strongly. If the range is wide, the market is more likely to remain sideways
📢 Disclaimer
I am not a SEBI-registered financial adviser.
The information, views, and ideas shared here are purely for educational and informational purposes only. They are not intended as investment advice or a recommendation to buy, sell, or hold any financial instruments.
Please consult with your SEBI-registered financial advisor before making any trading or investment decisions.
Trading and investing in the stock market involves risk, and you should do your own research and analysis. You are solely responsible for any decisions made based on this research.

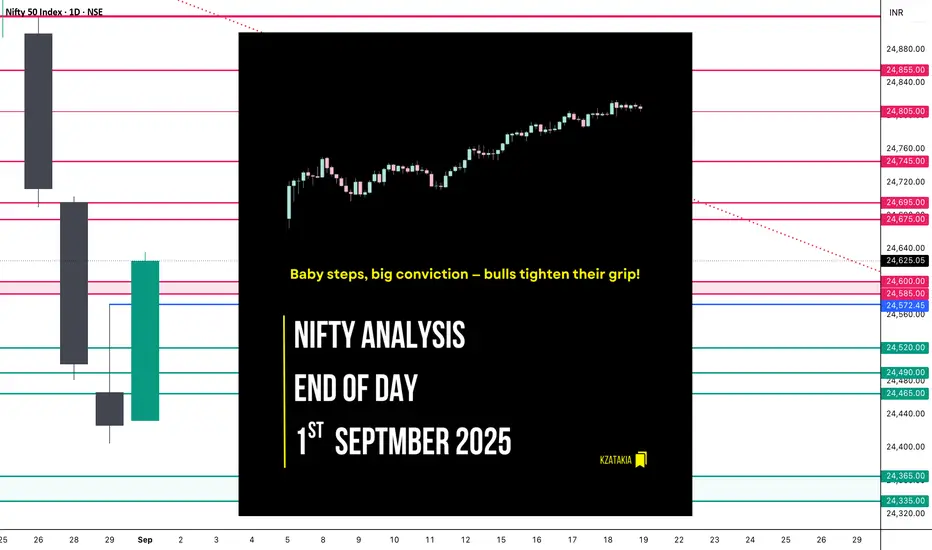
Nifty Analysis EOD - September 1, 2025 - Monday🟢 Nifty Analysis EOD - September 1, 2025 - Monday 🔴
Baby steps, big conviction — bulls tighten their grip!
🗞 Nifty Summary
Nifty opened with a 47-point gap-up, carrying a positive vibe. The index extended gains by nearly 80 points, marking a high of 24,560.85 before slipping back to 24,500. There it found strong support and gradually climbed to break IB High and later breach PDH.
Step by step, bulls showcased steady dominance, ultimately closing at 24,624.15, a solid 190-point gain. The daily timeframe formed a Bullish Marubozu candle, breaking out and closing above the Previous Day High — a decisive statement from buyers.
🛡 5 Min Intraday Chart with Levels
🚶 Intraday Walk
Opened gap-up +47 points.
Climbed ~80 points, touched 24,560.85.
Pulled back to 24,500, took support.
Gradually rose, broke IB High, then PDH.
Closed at 24,624.15, strong bullish grip intact.
📉 Daily Time Frame Chart with Intraday Levels
🕯️ Daily Candle Breakdown
Open: 24,432.70
High: 24,635.60
Low: 24,432.70
Close: 24,625.05
Change: +198.20 (+0.81%)
🏗️ Structure Breakdown
Green candle (Close > Open).
Body: 192.35 points → strong, dominant.
Upper wick: ~10.55 points (negligible).
Lower wick: 0 (open = low).
🕯Candle Type
Bullish Marubozu (near perfect).
📚 Interpretation
Market opened at low, never looked back.
Strong buying all day, closing at peak.
After 3 days of selling (23–25 Aug), this candle marks first solid bullish comeback.
Short-Term View
Support: 24,430 (today’s low & open).
Resistance: 24,635 (today’s high) → breakout may target ~24,800.
Trend Context: After a bearish continuation, today signals a bullish reversal. Needs follow-through buying in the next 1–2 sessions.
🛡 5 Min Intraday Chart
⚔️ Gladiator Strategy Update
ATR: 201.88
IB Range: 93.05 → Medium
Market Structure: Balanced
Trade Highlights
12:25 → Long trade triggered - Trailing SL hit ( R:R = 1 : 1.16 )
📌 Support & Resistance Levels
Resistance Zones
24,675 ~ 24,695
24,745
24,805
24,855
Support Zones
24,575
24,520
24,490 ~ 24,465
🔮 What’s Next? / Bias Direction
Momentum has shifted in favour of bulls, with today’s Marubozu breakout signalling strong conviction. As long as Nifty sustains above 24,500–24,520 zone, buyers remain in control. A clean break above 24,635 opens the gates for 24,800 and beyond.
💭 Final Thoughts
Today’s action reminded us: “Trends don’t announce themselves, they whisper first — and today’s candle was a loud hint.”
✏️ Disclaimer
This is just my personal viewpoint. Always consult your financial advisor before taking any action.
Nifty delicately placed near resistance zones. Today we have seen Good recovery by Nifty on the back of extraordinary GDP numbers of 7.8% in the last Quarter. Now Nifty is delicately placed with chances of V shaped recovery if it can surpass 4 major hurdles,
The resistances are at Mid RSI channel resistance near 24640, Mother line resistance at 24690 (hourly chart), Trend line resistance near 24766 and Father line resistance near 24800 (hourly chart). If we get a closing above 24800 then the doors for 24927, 25015 and 25160 will open. Supports for Nifty currently are at 24504 and 24399. We have a very interesting week ahead with possibility of lot of volatility.
Disclaimer: The above information is provided for educational purpose, analysis and paper trading only. Please don't treat this as a buy or sell recommendation for the stock or index. The Techno-Funda analysis is based on data that is more than 3 months old. Supports and Resistances are determined by historic past peaks and Valley in the chart. Many other indicators and patterns like EMA, RSI, MACD, Volumes, Fibonacci, parallel channel etc. use historic data which is 3 months or older cyclical points. There is no guarantee they will work in future as markets are highly volatile and swings in prices are also due to macro and micro factors based on actions taken by the company as well as region and global events. Equity investment is subject to risks. I or my clients or family members might have positions in the stocks that we mention in our educational posts. We will not be responsible for any Profit or loss that may occur due to any financial decision taken based on any data provided in this message. Do consult your investment advisor before taking any financial decisions. Stop losses should be an important part of any investment in equity.

Market breadth plus Long buildup in NiftySo as we planned, market opened above Pivot and gave a bounce, that too with long buildup in NSEIX:NIFTY1! .
That’s a strong positive sign.
One more good thing is volume. Today’s buyers’ volume was 29M, which is higher than Friday’s sellers’ volume of 24M.
This clearly shows bulls are taking charge. However my view will remain cautious until we close above at least 24850 on weekly basis.
So we have 3 positives now for the week ahead:
• Long buildup in futures
• Market breadth positive
• Buyers’ volume higher
With all this, Nifty’s Pivot has now shifted to 24564 and PP is at 0.25.
So, if tomorrow NSE:NIFTY opens above Pivot and stays there, then we can expect a sharp move towards 24750. Support will be 24575.
NSE:BANKNIFTY is showing early signs of accumulation. Support 53600. Options traders can aim for 55500 this month.
On the sector side, Auto, Finance, Chemical and Defence have joined the momentum. Keep a close watch on defence leaders.
My today's intraday performers:
1. NSE:OLAELEC +15.60%
2. NSE:STALLION +9.95%
3. NSE:STYLEBAAZA +4.14%
That’s it for today. Take care and have a profitable tomorrow.
Nifty 50: Shows reversal before hitting the support of 24300
Nifty 50: Shows reversal before hitting the support of 24300
( Not a Buy / Sell Recommendation
Do your own due diligence ,Market is subject to risks, This is my own view and for learning only .)

NIFTY50....Wave iv complete?Hello Traders,
the NIFTY50 has probably complete a wave iii of lower degree.
It closed the day @ 24625. In contrast of a wave ii, that has lasted for one day also, this wave could be complete.
In this case, the next move should occurr to the downside and complete a wave v! Targets are still valid and have been published yesterday!
If this move instead was all of the correction, it should start a new advance and create possibly new high's above 25153 on August 21th.
While the move for now looks like a "three-down" I await another wave to the downside to accomplishe a "five-down"!
So friends, that's it for a quick note today.
Have a great week.....
Ruebennase
Please ask or comment as appropriate.
Trade on this analysis at your own risk.

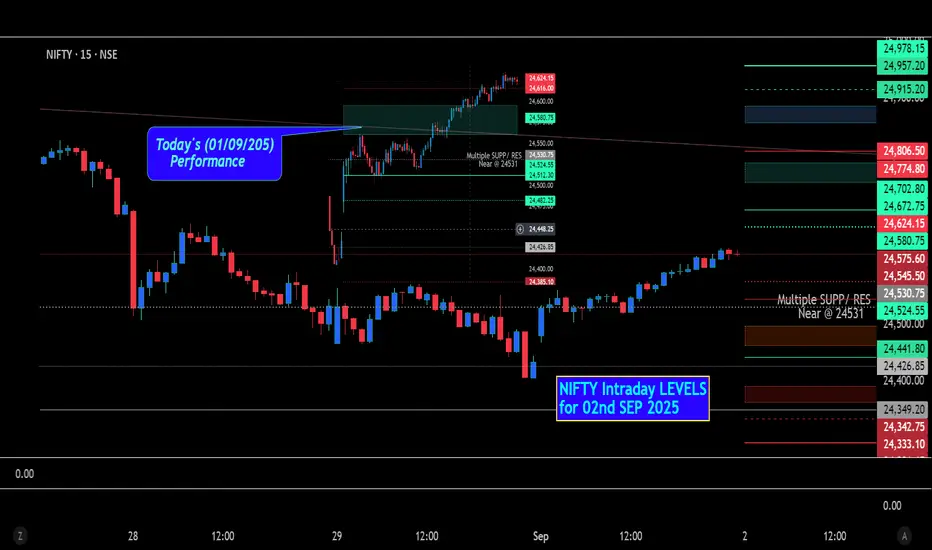
NIFTY Intraday Level for 02nd SEP 2025All Plotted and Mentioned on Chart.
Colour code:
Green =. Positive bias.
Red =. Negative bias.
RED in Between Green means T rend Finder / Momentum Change
/ CYCLE Change and Vice Versa.
Notice One thing: HOW LEVELS are Working.
Use any Momentum Indicator / Oscillator as USED to to Take entry.
Disclaimer: Study Purpose only.
Nifty levels - Sep 02, 2025Nifty support and resistance levels are valuable tools for making informed trading decisions, specifically when combined with the analysis of 5-minute timeframe candlesticks and VWAP. By closely monitoring these levels and observing the price movements within this timeframe, traders can enhance the accuracy of their entry and exit points. It is important to bear in mind that support and resistance levels are not fixed, and they can change over time as market conditions evolve.
The dashed lines on the chart indicate the reaction levels, serving as additional points of significance to consider. Furthermore, take note of the response at the levels of the High, Low, and Close values from the day prior.
We hope you find this information beneficial in your trading endeavors.
* If you found the idea appealing, kindly tap the Boost icon located below the chart. We encourage you to share your thoughts and comments regarding it.
Wishing you success in your trading activities!

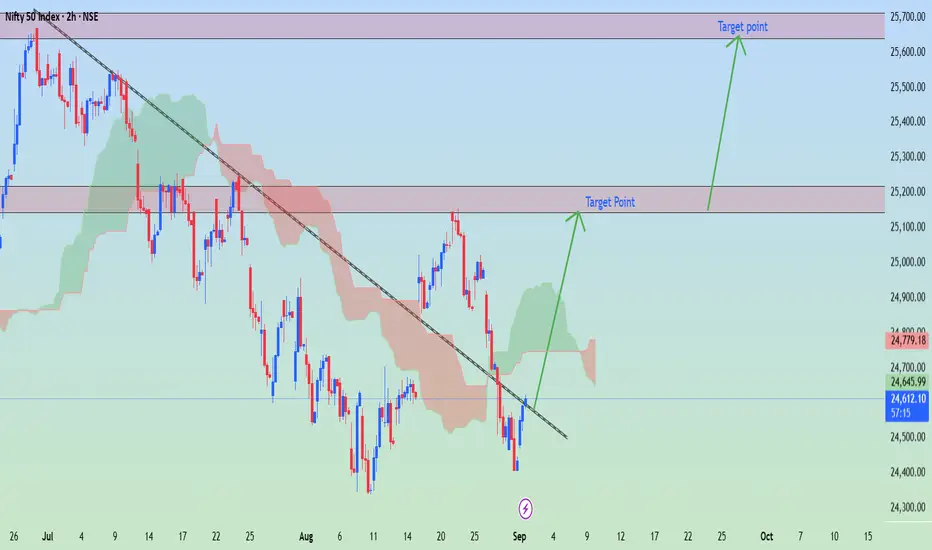
NIFTY 50 Index (2H timeframe) ..NIFTY 50 Index (2H timeframe)
---
Current Market Context
Instrument: NIFTY 50 Index (NSE)
Current Price: ~24,709
Trend: Recently bounced from a support zone after a downtrend.
Indicators: Price is trying to recover above the Ichimoku cloud and has broken a short-term descending trendline.
---
Targets Marked on my Chart
1. First Target Zone: 25,150 – 25,200
This is the immediate resistance / supply zone.
Likely to be tested first on bullish continuation.
2. Second Target Zone: 25,550 – 25,600
This is the extended bullish target.
It aligns with the next major resistance zone marked in your chart.
---
Trade Idea
Entry Zone: Around 24,700 – 24,750 (current levels).
Take Profit 1: ~25,150 – 25,200.
Take Profit 2: ~25,550 – 25,600.
Stop Loss: Below recent swing low (~24,500).
---
⚠ Note: NIFTY moves strongly with global cues and India’s market data. If bulls fail to hold above 24,500, bearish pressure could resume.
Market trendThis is my practice chart for Smart Money Concepts (SMC).
📌 Key focus areas:
- Market Structure (HH, HL, LH, LL)
- CHoCH (Change of Character) and BoS (Break of Structure)
- Liquidity pools (equal highs/lows zones)
- Order Blocks (OB) and Fair Value Gaps (FVG)
- Supply & Demand Zones
- Premium / Discount levels
I am publishing this chart to analyze trend bias and to learn how institutional concepts apply in real-time on the Nifty 50 (5 minute timeframe).
Disclaimer: Educational purpose only, not financial advice.

Nifty Weekly chart - in Making of Inverted Head and Shoulder Disclaimer : Do your own research before investing. This is just a chart analysis. No recommendation to buy and sell.
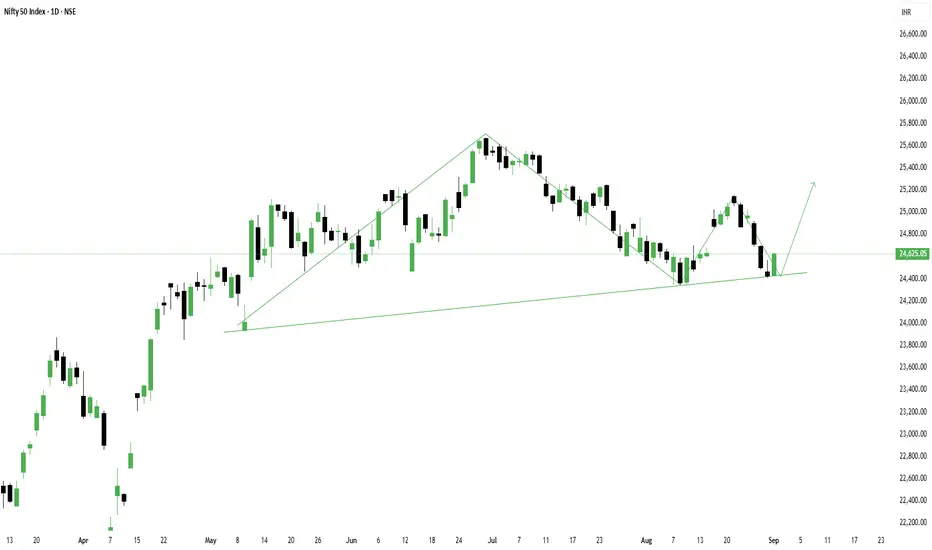
Nifty is in making of Inverted head and Shoulder pattern on Weekly Chart.
CMP is Rs. 24560/- On the upper side it can go upto Rs.26000/- and lower side can go upto Rs. 23000.

Nifty Maintains Bullish Trend, Eyes Higher TargetsNifty Maintains Bullish Trend, Eyes Higher Targets
The Nifty index continues to trade within a strong bullish market structure, characterized by higher highs and higher lows, indicating sustained upward momentum. The index is currently hovering near a crucial support level, which has historically acted as a springboard for further rallies. As long as this support holds, the overall trend remains firmly bullish, with expectations of another upward push in the coming sessions.
On the higher side, the next key target for the Nifty is 25,600, a level that could attract profit-taking if reached but may also act as a psychological resistance. A decisive breakout above this zone could open the doors for even higher levels, reinforcing the bullish dominance. Traders should watch for follow-through buying momentum to confirm the continuation of the uptrend.
On the downside, 24,500 is a critical support level that must hold to maintain the bullish structure. A dip towards this zone could present a buying opportunity, as long as the price does not close below it. A breach of this support, however, could signal a short-term correction or consolidation phase before the next directional move.
Given the current technical setup, the bias remains in favor of the bulls, with dip-buying strategies likely to prevail. Traders should monitor price action around the key levels mentioned, as they will determine whether the uptrend extends or faces a temporary pause. Overall, the Nifty's bullish trend remains intact, with 25,600 as the next major target and 24,500 serving as a crucial support to watch.

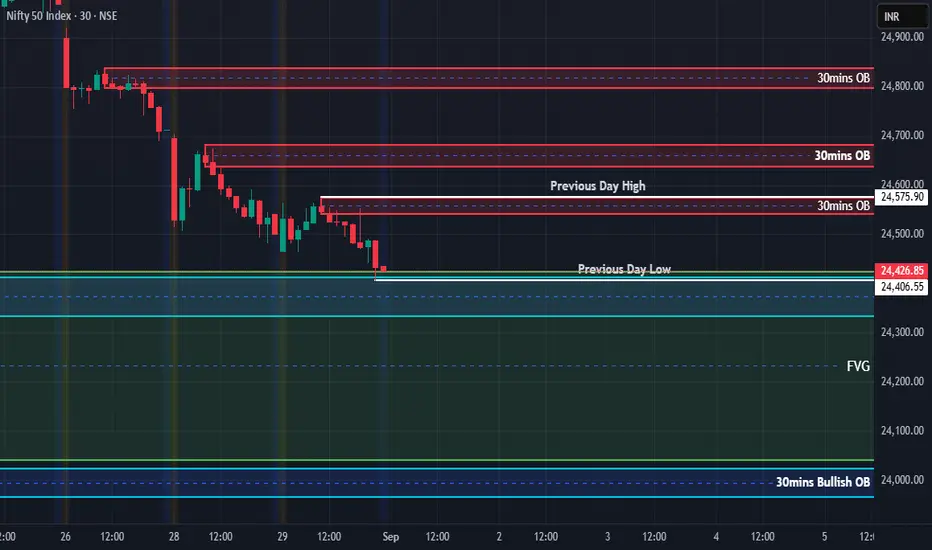
Nifty Analysis for 01-09-2025Chart Breakdown: Current Price: ~24,426.85 (just below Previous Day Low).
Key Levels:
Immediate Resistance Zones (30-min OBs):
24,575 (PDH zone)
24,700–24,800 (stronger OB).
Support Zones:
Previous Day Low (PDL): 24,426
Discount Zone / FVG: 24,300 → 24,200
Major 30-min Bullish OB: ~24,000
Market Structure:
Multiple BOS (Break of Structure) down moves → bearish structure confirmed.
Price is trading below PDH & PDL, showing weakness.
Next liquidity magnet = FVG 24,300–24,200.
Interpretation
Price is in a bearish order flow, creating lower highs and breaking lows.
PDL already tested → weak support, risk of continuation down.
FVG (24,300–24,200) is the natural downside target in the short term.
24,000 OB remains the most important demand zone for reversal.
Scenarios
Bearish Continuation (Most Likely Near Term):
If 24,426 (PDL) breaks clean → quick slide into 24,300–24,200 FVG.
If selling accelerates → test of 24,000 OB.
Bullish Reversal Case:
If 24,426 holds & market reclaims PDH (~24,575) → could trigger short covering.
Targets: 24,700 → 24,800 OB.
Only strong close above 24,800 negates bearish structure.
Neutral/Range Case:
If stuck between 24,426–24,575 → chop zone, liquidity building before big move.
My Perspective
Bias: Bearish to sideways, unless 24,575 is reclaimed.
Expect FVG fill to 24,200 in the short run.
24,000 OB will decide whether bulls regain control or if deeper correction (23,600–23,200 gap) opens up.
Suggested Trading Approach:
Short-term shorts below 24,426 → target 24,300–24,200.
Aggressive longs only from 24,000 OB with confirmation (candle reversal / demand reaction).
Avoid longs in the middle zone (24,400–24,500) since structure favors sellers.
NIFTY KEY LEVELS FOR 01.09.2025NIFTY KEY LEVELS FOR 01.09.2025
RTF: 3 Minutes
If the candle stays above the pivot point, it is considered a bullish bias; if it remains below, it indicates a bearish bias. Price may reverse near Resistance 1 or Support 1. If it moves further, the next potential reversal zone is near Resistance 2 or Support 2. If these levels are also broken, we can expect the trend.
If the range(R2-S2) is narrow, the market may become volatile or trend strongly. If the range is wide, the market is more likely to remain sideways
📢 Disclaimer
I am not a SEBI-registered financial adviser.
The information, views, and ideas shared here are purely for educational and informational purposes only. They are not intended as investment advice or a recommendation to buy, sell, or hold any financial instruments.
Please consult with your SEBI-registered financial advisor before making any trading or investment decisions.
Trading and investing in the stock market involves risk, and you should do your own research and analysis. You are solely responsible for any decisions made based on this research.
