Nifty 50 @ 52 Week high but Could not Break ATH!What is there for Nifty 50 Now?
Nifty 50 went up till 52 week High @ 26104
but Could not Cross the ATH of 26277
missed by 173 points
There is a Hammer Candle formation on weekly charts from Controlling Supply Zone at the top. Which means bears are not interested to turn to bulls right now.
There is a Strong Resistance @ 26250
and if we talk about Support it is @ 25500 & 25000 and if it breaks it then @ 24500
As per my analysis
1. It should test 25500 and then turn bullish and try top break 26200-26250 Strong Resistance and it it breaks it then we will find a new ATH.
2. it cant hold on 25500 then next Support will be 25000. if it takes support from there it can find resistance much more near @ 25500 then and if it breaks it then it can rally again up till 26200 - 26250 strong resistance or otherwise drop till 24500.
3. If Nifty 50 cant hold on to 25500 & 25000 then it can settle @ 24500 then. It will be a strong Support as then it will be @ Controlling Demand Zone of Monthly. it will take some time then to reach this level monthly EMA 20 will also be near then and it should take Support from it and Start a new Bullish Journey
if it reaches 24500 then it will be a very good opportunity for investors to invest in major shares as they also be at very good level to buy then.
Trade ideas

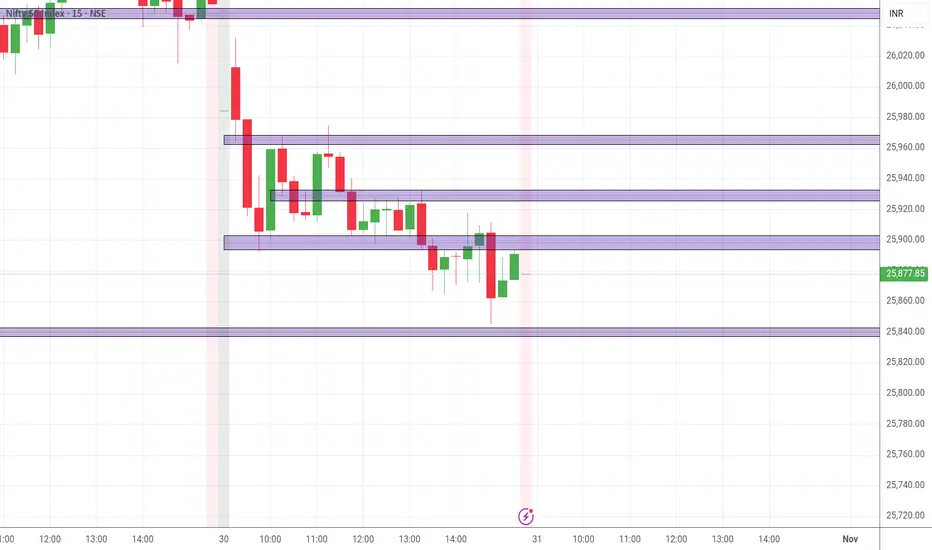
Key levels for nifty 31.10.2025Marked zones may act as reversal or breakout areas for nifty. These zones are drawn using 15 minute time-frame. Take entry in 5 minutes or 3 minutes time frame.
Nifty may fall,but if opened positive it may rise to new levelNifty seems little retracement level at certain level it may rise again to new height banknifty as taken support tomorrow if it opens positive I am looking for long else will buy for lesser quantity put or wait to take nifty support and rise up to new level...... Banknifty seems to me other 800-1000 points to tomorrow or within 2 days before expiry
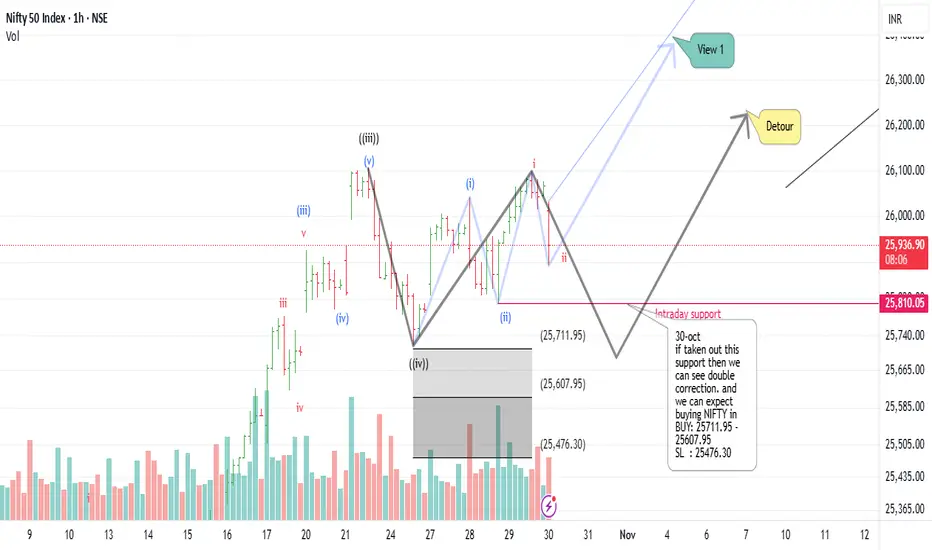
Nifty Intraday DetourIncase Nifty doesn't hold 25810 then will have to tweak the wave count and expect Nifty to correct upto 25712-25476. If that happens then we will plan to buy in Range of 25712-25608 and keep stop loss for 25476
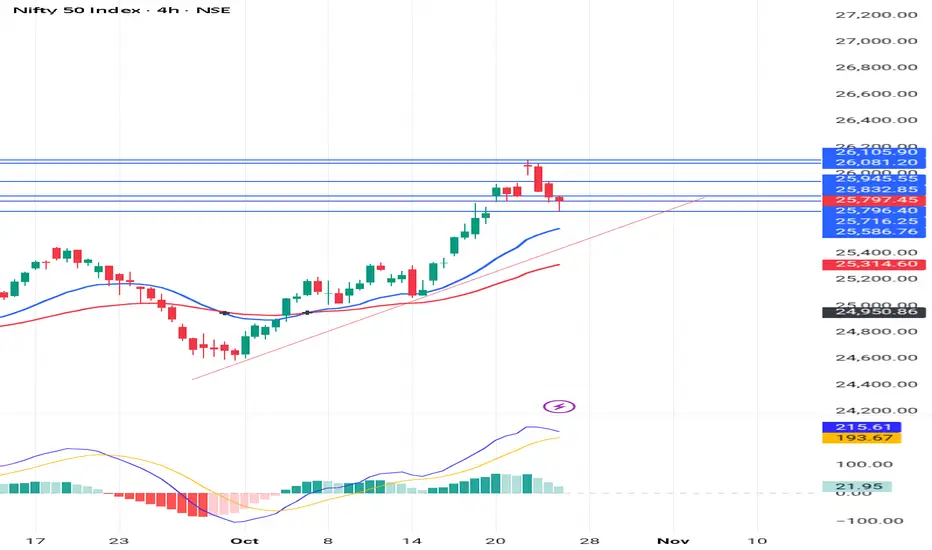
Weekly Market Outlook | Nifty, BankNifty & S&P 500 AnalysisNifty closed the week at 25,795, up 86 points from last week’s close — marking another week of resilience within my projected range of 26,200–25,250.
This week’s candle looks weak and indecisive, forming near the all-time high zone — a potential signal of short-term fatigue. A break below 25,718 could trigger selling pressure toward support zones at 25,450 / 25,350 / 25,300.
However, as long as 25,300 holds, the broader structure remains healthy.
On the flip side, if Nifty sustains above 25,900, bulls may once again attempt to test the all-time high resistance at 26,277.
👉 Expected range for next week: 26,250 – 25,350.
BankNifty Update:
BankNifty delivered a record-breaking all-time high close at 57,699!
If it slips below 57,482, it could correct toward 57,000 / 56,750, which may also drag Nifty slightly lower.
But a sustained move above 57,900 could fuel another rally toward 58,577 (ATH), providing crucial support for Nifty’s next breakout attempt.
S&P 500 (US Markets):
The S&P 500 once again posted a new all-time high weekly close at 6,791, perfectly following last week’s outlook where it cleared 6,715 and achieved both upside targets 6,760 / 6,780.
Next key levels to watch:
Above 6,780 → potential move to 6,930 / 6,959 (important Fibonacci zone)
Below 6,750 → watch for pullback toward 6,689 / 6,666 / 6,650
Investors in US equities can now trail their stop-loss near 6,580 and keep adjusting to protect profits as the trend extends.
🎯 Summary:
Nifty range: 26,250–25,350
BankNifty: All-time high close, watch 57,900 breakout
S&P 500: Bullish momentum intact, eyes on 6,930–6,959
Markets are at crucial inflection levels — next week could decide whether we see fresh breakouts or short-term consolidation.

Nifty Tomorrows Reversal areaNifty Tomorrows reversal area for intraday, usually these area/zone act as supply or demand areas, these areas are good only for tomorrow, for the day after new zones will be calculated depending upon the price action of the previous day (tomorrow)

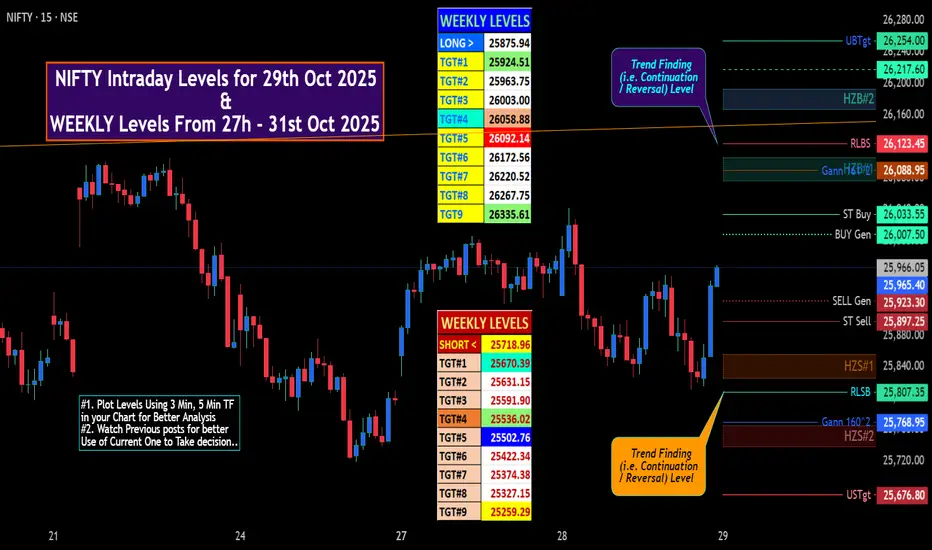
NIFTY IntraSwing Levels for 29th Oct 2025🚀 "WEEKLY Levels" mentioned in BOX format.
🌡️Plot Levels Using 3 Min, 5 Min Time frame in your Chart for Better Analysis
L#1: If the candle crossed & stays above the “Buy Gen”, it is treated / considered as Bullish bias.
L#2: Possibility / Probability of REVERSAL near RLBS & UBTgt
L#3: If the candle stays above “Sell Gen” but below “Buy Gen”, it is treated / considered as Sidewise. Aggressive Traders can take Long position near “Sell Gen” either retesting or crossed from Below & vice-versa i.e. can take Short position near “Buy Gen” either retesting or crossed downward from Above.
L#4: If the candle crossed & stays below the “Sell Gen”, it is treated / considered a Bearish bias.
L#5: Possibility / Probability of REVERSAL near RLSB & USTgt
HZB (Buy side) & HZS (Sell side) => Hurdle Zone,
*** Specialty of “HZB#1, HZB#2 HZS#1 & HZS#2” is Sidewise (behaviour in Nature)
Rest Plotted and Mentioned on Chart
Color code Used:
Green =. Positive bias.
Red =. Negative bias.
RED in Between Green means Trend Finder / Momentum Change
/ CYCLE Change and Vice Versa.
Notice One thing: HOW LEVELS are Working.
Use any Momentum Indicator / Oscillator or as you "USED to" to Take entry.
⚠️ DISCLAIMER:
The information, views, and ideas shared here are purely for educational and informational purposes only. They are not intended as investment advice or a recommendation to buy, sell, or hold any financial instruments. I am not a SEBI-registered financial adviser.
Trading and investing in the stock market involves risk, and you should do your own research and analysis. You are solely responsible for any decisions made based on this research.
"As HARD EARNED MONEY IS YOUR's, So DECISION SHOULD HAVE TO BE YOUR's".
Do comment if Helpful .
In depth Analysis will be added later (If time Permits)
Nifty levels - Nov 03, 2025Nifty support and resistance levels are valuable tools for making informed trading decisions, specifically when combined with the analysis of 5-minute timeframe candlesticks and VWAP. By closely monitoring these levels and observing the price movements within this timeframe, traders can enhance the accuracy of their entry and exit points. It is important to bear in mind that support and resistance levels are not fixed, and they can change over time as market conditions evolve.
The dashed lines on the chart indicate the reaction levels, serving as additional points of significance to consider. Furthermore, take note of the response at the levels of the High, Low, and Close values from the day prior.
We hope you find this information beneficial in your trading endeavors.
* If you found the idea appealing, kindly tap the Boost icon located below the chart. We encourage you to share your thoughts and comments regarding it.
Wishing you success in your trading activities!


Nifty sustains the trendline Breakout on Muhurat day trading. Nifty sustained the trendline breakout gained earlier this week on Flattish trade on Muhurat day. After making a high of 25934 Nifty ended at 25868. Supports for Nifty are at 25652 and 25370. Below this level there is a Mother line support at 25087. Something to worry about is the upcoming resistances 26015, 26277 and 26484 (Golden Fibonacci ratio resistance). If these 3 resistances are crossed and Nifty can go towards 27K or even reach 27394 which can be the new trend top within this Vikram Samvat year if everything goes in line with and in favour of current trend. Wish you all a fabulous Financial success in this festive season and beyond it.
Disclaimer: The above information is provided for educational purpose, analysis and paper trading only. Please don't treat this as a buy or sell recommendation for the stock or index. The Techno-Funda analysis is based on data that is more than 3 months old. Supports and Resistances are determined by historic past peaks and Valley in the chart. Many other indicators and patterns like EMA, RSI, MACD, Volumes, Fibonacci, parallel channel etc. use historic data which is 3 months or older cyclical points. There is no guarantee they will work in future as markets are highly volatile and swings in prices are also due to macro and micro factors based on actions taken by the company as well as region and global events. Equity investment is subject to risks. I or my clients or family members might have positions in the stocks that we mention in our educational posts. We will not be responsible for any Profit or loss that may occur due to any financial decision taken based on any data provided in this message. Do consult your investment advisor before taking any financial decisions. Stop losses should be an important part of any investment in equity.

Nifty’s candle today looks quite interesting!Nifty’s candle today looks quite interesting.
The color is red. The volume belongs to buyers. And it’s a clear shakeout.
Even with such a big red candle, buyers’ volume was 12 million higher than sellers, and the collective volume was higher too — so what’s really going on here?
It’s simple — accumulation. Bulls are still strong and active.
This pullback is just normal profit booking, which was already expected after the recent rally.
Pivot sits at 25918 and support is at 25800.
If NSE:NIFTY bounces from the support and sustains above the pivot, it can move up to 26100. But if the support breaks, the pullback could extend toward 25669.
No matter how deep the pullback goes on the index, stock-level buildup continues — which means this is a great opportunity for cash traders to pick strong short-term stocks.
Long-term breadth is improving faster than the short-term trend, showing broader strength.
Intraday breadth ratio stood at 0.76 today — negative for the second consecutive session. Until it turns positive, it’s better to avoid intraday trading.
On the sectoral side, NSE:CNXIT showed clear buildup today, and NSE:NIFTY_CONSR_DURBL stocks also displayed good momentum.
📊Levels at a glance:
Pivot: 25918
Support: 25800 (break = dip to 25669)
Resistance: 26100 (bounce target)
Market Breadth Ratio (intraday): 0.76 (negative)
Bias: Accumulation phase, healthy pullback
Sectors to watch: IT, Consumer Discretionary
That’s all for the day. Take care and have a profitable tomorrow.

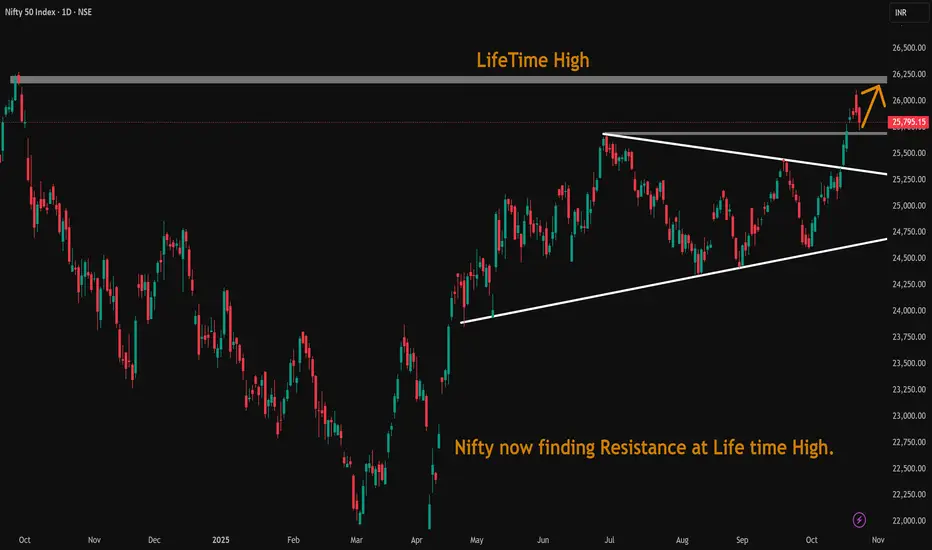
Nifty is now finding Resistance at Life time High.Nifty is now finding Resistance at Life time High. Sooner or later it has to move beyond this supply zone to uncharted territory.
Nifty Reversal Zones for 29 OCT 2025Nifty reversal zones for intraday, usually these area/zone act as supply or demand areas, Price tend to take support or rejections from these area's also these areas are good only for 29 OCT 2025, There are 2 Zone types Major and Minor, Major to target big trends and minor to target small trends and can be used for scalping

The Chart Talk - Nifty Sideways Broken Despite Huge Gapup !🧭 The Chart Talk – What Market Told Us Today By M Dhanushkumar
Welcome to The Chart Talk – What Market Told Us Today!
Nifty opened with a gap up of nearly 200 points, showing early bullish sentiment. However, after the strong open, the market moved sideways for most of the session, indicating indecision among traders.
Later, Nifty broke the sideways range on the downside, confirmed the move with a retest, and then continued lower to make the day’s low — a clear sign of weakness and profit booking after the early gap-up rally.
This price action shows how the market shifted from early optimism to selling pressure as the session progressed.
Let’s see how it reacts around today’s low in the next session — whether it holds as support or continues the downtrend.
If you found this useful, hit the like, follow for more daily chart talks, and feel free to ask your doubts in the comments!
📈 Disclaimer: This analysis is for educational purposes only, not investment advice.


The Chart Talk - Nifty Rejection & Trendline Breakdown Welcome to The Chart Talk – What Market Told Us Today! by M Dhanushkumar
As we discussed in yesterday’s Chart Talk, Nifty faced resistance at the same zone once again today and got clearly rejected from that level.
After the rejection, the market moved sideways for a while, showing a lack of fresh buying interest.
Later, we saw a trendline breakdown, giving a clear short trade setup, and Nifty slid nearly 114 points from the breakdown level — confirming the selling pressure.
This session highlights how respecting key resistance zones and simple price action can give clean intraday opportunities.
If you found this useful, hit the like, follow for daily Chart Talks, and share your views in the comments!
📈 Disclaimer: This analysis is for educational purposes only, not investment advice.

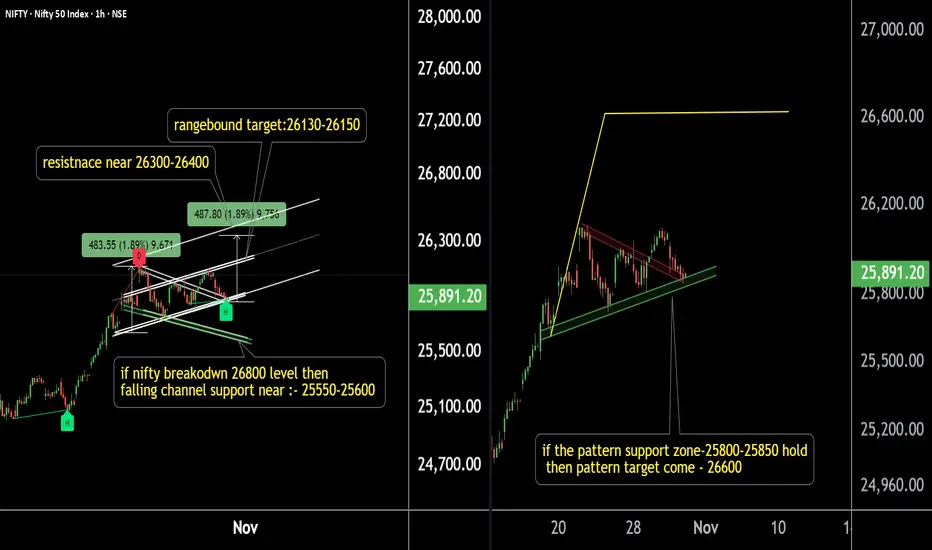
Nifty Key Levels on Radar — Crucial Zones to Watch This WeekNifty 50 – 1 Hour Timeframe Analysis
Nifty is currently showing strong support near the 25,800 zone.
If this level breaks, the next support can be seen around 25,550–25,600.
As per the current market structure, Nifty may first move in a range-bound phase, achieving initial targets around 26,150–26,180.
If the upward momentum continues, the next potential targets will be around 26,300–26,400 levels.
If the pattern support zone holds, then the pattern targets are likely to be achieved.
Thank you!
NIFTY S/R for 29/10/25Support and Resistance Levels:
Support Levels: These are price points (green line/shade) where a downward trend may be halted due to a concentration of buying interest. Imagine them as a safety net where buyers step in, preventing further decline.
Resistance Levels: Conversely, resistance levels (red line/shade) are where upward trends might stall due to increased selling interest. They act like a ceiling where sellers come in to push prices down.
Breakouts:
Bullish Breakout: When the price moves above resistance, it often indicates strong buying interest and the potential for a continued uptrend. Traders may view this as a signal to buy or hold.
Bearish Breakout: When the price falls below support, it can signal strong selling interest and the potential for a continued downtrend. Traders might see this as a cue to sell or avoid buying.
MA Ribbon (EMA 20, EMA 50, EMA 100, EMA 200) :
Above EMA: If the stock price is above the EMA, it suggests a potential uptrend or bullish momentum.
Below EMA: If the stock price is below the EMA, it indicates a potential downtrend or bearish momentum.
Trendline: A trendline is a straight line drawn on a chart to represent the general direction of a data point set.
Uptrend Line: Drawn by connecting the lows in an upward trend. Indicates that the price is moving higher over time. Acts as a support level, where prices tend to bounce upward.
Downtrend Line: Drawn by connecting the highs in a downward trend. Indicates that the price is moving lower over time. It acts as a resistance level, where prices tend to drop.
Disclaimer:
I am not SEBI registered. The information provided here is for learning purposes only and should not be interpreted as financial advice. Consider the broader market context and consult with a qualified financial advisor before making investment decisions.

Will Nifty Hold the Demand Zone After Today’s Weak Breakdown?Today, the market opened with a gap-down below the key support, showing that bears are still in control.
Later, price took support near Tuesday’s levels and formed a trendline and channel pattern, which eventually broke on the downside — but no strong momentum followed.
This indicates that buyers are still active near the demand zone, and the next session will decide whether Nifty can hold this support or extend the fall further.
If you liked this analysis, hit like, follow for daily Chart Talks, and share your view below!
📈 Disclaimer: For educational purposes only, not a buy/sell recommendation.

NIFTY AS we see there is a buying in nifty but 26000 to 25700 is zone where can nifty consolidate for some week if 26030 break and start closing above it we can see ATH soon

Nifty Broken Demand zone ! but Now at clear sideways What next ?I shared my view about Nifty, It is clear sidedways Now at bottom Can we expect towards to Top ?
If you liked this analysis, hit like, follow for daily Chart Talks, and share your view below!
📈 Disclaimer: For educational purposes only, not a buy/sell recommendation.

Nifty Analysis EOD – October 27, 2025 – Monday🟢 Nifty Analysis EOD – October 27, 2025 – Monday 🔴
Bulls return after the festive break, eyeing 26,000 with renewed strength
Diwali Greetings and Happy New Year to all Indian followers! ✨
After a long Diwali vacation with family, I’m finally back at the desk. Although I was tracking and trading daily, I couldn’t find time to write notes.
During the holiday stretch (7th–24th Oct), Nifty rallied more than 1000 points, hitting our 25,900 pattern target — a smooth ride for intraday traders, except for a few choppy sessions.
🗞 Nifty Summary
Last week’s candle shaped like an inverted hammer/shooting star, hinting at either a pause or a short-term reversal. But today, backed by positive global cues, Nifty opened gap-up by 48 points, showed no intent to fill the gap, and rallied sharply upward.
The index faced resistance around 25,944–25,977, and after several failed breakout attempts beyond 25,977, it briefly marked a new day high at 26,005 before slipping back into the resistance zone.
The final two hours turned volatile — both bulls and bears fought for control. Eventually, Nifty closed at 25,974, just below the intraday high yet comfortably above the previous day’s high — a sign of bullish continuation with caution ahead.
While the close above PDH is positive, sustained strength will only come if bulls breach and hold 25,977–26,020 on the upcoming monthly expiry session.
🛡 5 Min Intraday Chart with Levels
🛡 Intraday Walk
Nifty opened Gap-Up 48 points above PDH.
Rally extended straight to 25,944–25,977 resistance zone.
26,005 marked as intraday high — brief breakout attempt failed.
Last two hours saw heavy volatility within resistance band.
Closed strong at 25,974, maintaining higher-high structure.
🕯 Daily Candle Breakdown
Open: 25,843.20
High: 26,005.95
Low: 25,827.00
Close: 25,966.05
Change: +170.90 (+0.66%)
🏗️ Structure Breakdown
Green candle with solid momentum.
Body ≈ 122.85 pts → decent bullish body.
Range ≈ 178.95 pts → healthy intraday activity.
Upper wick ≈ 39.9 pts, Lower wick ≈ 16.2 pts.
📚 Interpretation
Market opened gap-up and held gains throughout.
Strong follow-through buying above 25,850.
Close near upper quartile of range → bullish conviction intact.
Minor upper wick shows temporary supply at 26,000 psychological mark.
🕯Candle Type
Bullish Marubozu variant (small top wick).
Indicates buying continuation after breakout-driven rally.
🛡 5 Min Intraday Chart
⚔️ Gladiator Strategy Update
ATR: 204.01
IB Range: 119.70 → Medium
Market Structure: Balanced
Trade Highlights:
09:20 – Long Trade → Target Achieved (R:R 1:1.85)
10:06 – Long Trade → Target Achieved (R:R 1:0.79)
📌 What’s Next? / Bias Direction
Bias: Mildly Bullish
As long as 25,850–25,865 holds, the bias remains positive.
A breakout above 26,020 may extend targets to 26,085–26,150, while failure could lead to a sideways consolidation.
📌 Support & Resistance Levels
Resistance Zones:
25996
26010 ~ 26020
26085 ~ 26100
Support Zones:
25865
25828
25790
25725 ~ 25715
💡 Final Thoughts
“Momentum loves clarity — hesitation builds only where conviction weakens.”
The market tone stays upbeat, but resistance near 26,000 will test whether bulls have the stamina to carry forward the festive rally.
✏️ Disclaimer
This is just my personal viewpoint. Always consult your financial advisor before taking any action.

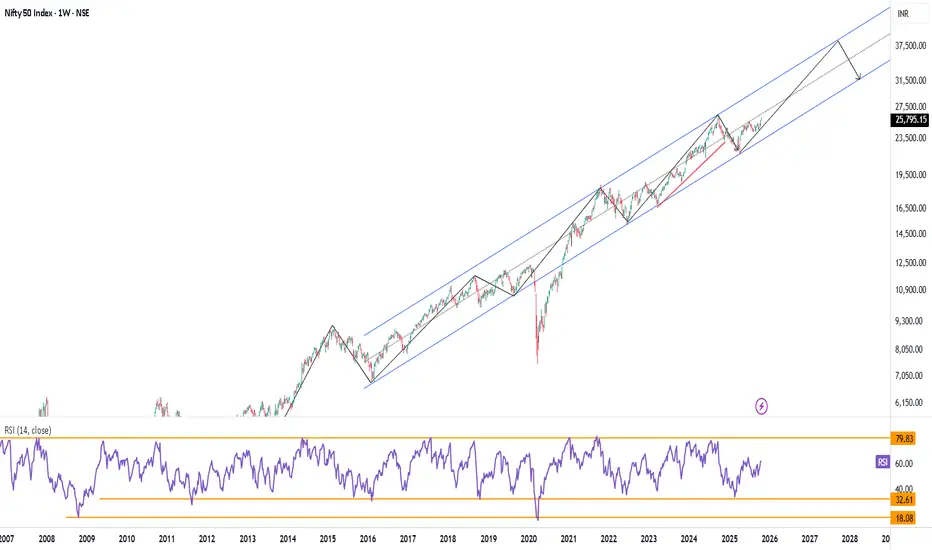
Nifty Weekly ChartIf trend holds and price is contained within channel, we will be trading close around 29500 by July 26 and eventually 37000 by Sep 27