Nifty Analysis EOD – August 28, 2025 – Thursday🟢 Nifty Analysis EOD – August 28, 2025 – Thursday 🔴
Bulls Tried, But Bears Closed the Table
🗞 Nifty Summary 🗞
Nifty started almost flat but below the prior low, and selling pressure hit from the first tick — falling 195 points in just 10 minutes to mark the day low at 24,507. Support came in, leading to a 170-point recovery, almost touching the day high near 24,675–24,695, but the support zone flipped into resistance. A sharp rejection dragged the index back to the lows, even breaching them to mark a new day low at 24,481.60.
By the close, a mild 50-point recovery couldn’t change the tone, with Nifty finishing at 24,533.10, down −211.15 points (−0.85%).
Over the last 5 sessions, Nifty has lost 672 points, slipping below the Fib 0.786 retracement of the recent swing high-low range.
🛡 5 Min Intraday Chart with Levels
📊 Intraday Walk
Gap-down, immediate 195-point fall to 24,507.
Bulls attempt recovery, index climbs 170 points.
Faces rejection at 24,675–24,695, prior support turned resistance.
Sellers regain control, Nifty revisits lows.
Breach of earlier low, new low at 24,481.60.
Small 50-point bounce, closes weak at 24,533.10.
📉 Daily Time Frame Chart with Intraday Levels
🕯 Daily Candle Breakdown
Open: 24,695.80
High: 24,702.65
Low: 24,481.60
Close: 24,500.90
Change: −211.15 (−0.85%)
🏗️ Structure Breakdown
Candle: Red (Close < Open)
Body: 194.90 points (large bearish body)
Upper wick: ~7 points → no strength above open
Lower wick: ~19 points → weak recovery attempt
📚 Interpretation
Gap-down open, below PDL.
Buyers failed to sustain upside; day’s high just 7 points above open.
Persistent selling throughout, only a minor bounce at close.
Another strong bearish candle, very similar to yesterday’s.
🕯Candle Type
Bearish Marubozu–style (big red body, tiny wicks).
Signifies trend-confirming, decisive selling pressure.
🔎 Short-Term View
Support: 24,480–24,450 (tested today). Break → 24,365–24,335.
Resistance: 24,695–24,720 (gap-down + rejection zone).
📌 The market is clearly moving in phases:
21st → Pause and alert
22nd → trend reversal confirmation
25th → pullback rejection
26th → confirmation
28th → bearish extension
Bulls must defend 24,350 to prevent a deeper correction.
🛡 5 Min Intraday Chart
⚔️ Gladiator Strategy Update
ATR: 204.83
IB Range: 195.45 → Medium
Market Structure: ImBalanced
Trade Highlights
9:45 AM – Long Trigger → Target achieved (R:R 1:1.5)
12:55 PM – Short Trigger → Target achieved (R:R 1:1.5)
📌 Support & Resistance Levels
Resistance Zones:
24,585 ~ 24,600
24,675 ~ 24,695
24,745
Support Zones:
24,665 ~ 24,650
24,365 ~ 24,335
🏹 Final Thoughts
“Markets don’t lie. When a support flips to resistance, the message is loud and clear — respect the structure.”
✏️ Disclaimer ✏️
This is just my personal viewpoint. Always consult your financial advisor before taking any action.
Trade ideas

Nifty levels - Aug 29, 2025Nifty support and resistance levels are valuable tools for making informed trading decisions, specifically when combined with the analysis of 5-minute timeframe candlesticks and VWAP. By closely monitoring these levels and observing the price movements within this timeframe, traders can enhance the accuracy of their entry and exit points. It is important to bear in mind that support and resistance levels are not fixed, and they can change over time as market conditions evolve.
The dashed lines on the chart indicate the reaction levels, serving as additional points of significance to consider. Furthermore, take note of the response at the levels of the High, Low, and Close values from the day prior.
We hope you find this information beneficial in your trading endeavors.
* If you found the idea appealing, kindly tap the Boost icon located below the chart. We encourage you to share your thoughts and comments regarding it.
Wishing you success in your trading activities!

clear rejection seen(bull trap in market)In the previous post already explaned market closing should be above green zone or else reversal is possible .A proper rejection is seen...holding 23800-23900 is much more important. if not sustain just get prepared for higher low pattern and can see more corrections in time

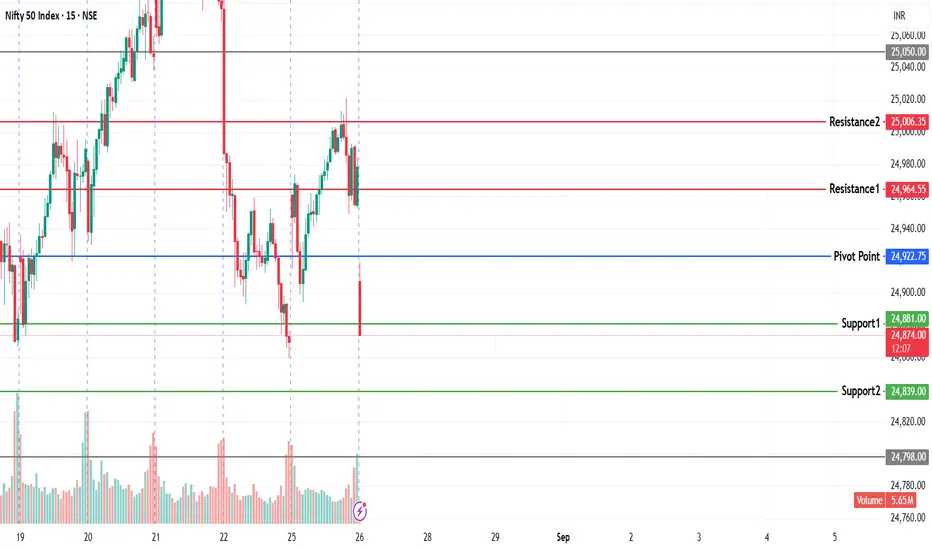
NIFTY KEY LEVELS FOR 28.08.2025NIFTY KEY LEVELS FOR 28.08.2025
************************* Time frame 3 Minutes******************************
If the candle stays above the pivot point, it is considered a bullish bias; if it remains below, it indicates a bearish bias. Price may reverse near Resistance 1 or Support 1. If it moves further, the next potential reversal zone is near Resistance 2 or Support 2. If these levels are also broken, we can expect the trend.
If the range(R2-S2) is narrow, the market may become volatile or trend strongly. If the range is wide, the market is more likely to remain sideways
📢 Disclaimer
I am not a SEBI-registered financial adviser.
The information, views, and ideas shared here are purely for educational and informational purposes only. They are not intended as investment advice or a recommendation to buy, sell, or hold any financial instruments.
Please consult with your SEBI-registered financial advisor before making any trading or investment decisions.
Trading and investing in the stock market involves risk, and you should do your own research and analysis. You are solely responsible for any decisions made based on this research.

Nifty Mandi?Doston, aaj ka idea main TradingView pe public post nahi kar paaya, isliye yahin bata raha hoon. Market ka setup kuch is tarah hai:
Abhi jo zone main dekh raha hoon woh important support/resistance ke aas-paas hai.
Short term trend thoda bias dikhata hai.
Jo strategy main use kar raha hoon usme level pe entry ka plan hai.
Stop-loss tight rakha hai aur target clear levels pe set hai

Nfity50 Technical Analysis for 28th of Aug., 2025NSE:NIFTY
Date: 28 August 2025
Trade Summary:
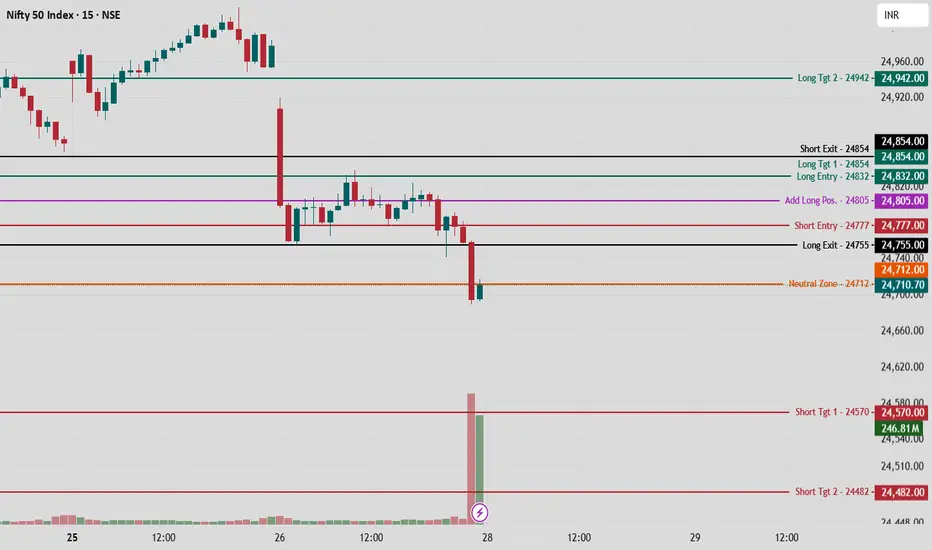
The directional bias remains negative with preference for selling on rise until 24,920 is crossed. Short trades are favored below 24,777 with momentum confirmation once the zero line at 24,712 is broken. Long trades are possible only as a counter move above 24,805–24,832 but are not the primary strategy.
Trade Logic
The index structure indicates sellers are in control as long as the market trades below the safe zone of 24,920. Sustaining under 24,712 confirms a breakdown which can extend towards 24,570 and 24,482. Buying interest will only be valid if the 24,805–24,832 support band is defended, which may trigger a short recovery towards 24,854 and 24,942.
Market Execution:
Preferred Trade: Short below 24,777; add positions once 24,712 breaks.
Short Targets: 24,570 and 24,482.
Stop for Shorts: Above 24,854.
Counter Long: Entry only above 24,805 and sustained above 24,832.
Long Targets: 24,854 and 24,942.
Stop for Longs: Below 24,755.
Disclaimers:
This view is developed using technical levels and market structure for educational purposes. Execution should be aligned with personal risk management rules, position sizing discipline, and prevailing market conditions. Traders must evaluate volatility and liquidity before acting and should not treat this note as investment advice.
Reciprocate:
Follow and boost if you like the analysis and do comment for any queries to discuss further.
Clear signs of accumulation visible in marketSo Tuesday didn’t go as planned. Market moved the exact opposite way. But honestly, no big surprise. In Monday’s note, I had already mentioned this week will be bearish and mostly ‘sell-on-rise’, with NSE:NIFTY y heading toward the 24650 support zone. And that’s where we are headed.
What happened on Tuesday was something I expected for Wednesday (one day before expiry). But I missed one point — Ganesh Chaturthi holiday on Wednesday shifted the market flow. That’s why fall came early.
Now let’s talk about tomorrow’s view:
On Tuesday, the Pivot Percentile (PP) was tight and Nifty opened below support. That gave us a sharp bearish day. Sellers dominated buyers by 225 million. But in the last 30 mins, that volume was cooled off to just 75 million. That shows accumulation is happening as we get close to the support zone.
The new pivot has shifted to 24773 with PP at 0.25%. Support is still around 24650. If that breaks, next stop is 24500.
If we open above pivot, Nifty may hang higher for the day with intraday resistance at 24777.
But overall, my view is sideways with a bearish tone.
One caution — don’t short the market tomorrow or near support. Let the support break first Or Instead, look at that as an opportunity to slowly accumulate strong stocks for a swing move.
NSE:BANKNIFTY has already broken support. Next level to watch is 53600.
And again, reminder — this pullback is healthy. Nothing to panic. Better to stick to your setups and prepare a watchlist. So when the market turns, you’re ready.
Best approach is to pick short-term positions, maybe for 6–7 months. Finance and Metals will likely lead the recovery. Auto parts and IT are still strong sectors.
Personally, I’m holding NSE:GARUDA and $NSE:BELRISE. Both are showing strength. If they persist through this bearish phase, I’ll add more. Remember, leaders deny to fall in pullbacks.
That’s it for today. Trade safe and hope tomorrow is profitable for you.
Nifty 50 Sell at 25093 with this 3 targetsNifty Still in down trend in previous pull back every retail trader thinking to buy, but actual setup is now pure sell starts and driving toward this 3 targets i mentioned in charts. Technical Analysis works

Nifty retesting the breakout - 27/08/2025Nifty coming back to horizontal support and trendline support
Nifty Analysis EOD – August 26, 2025 – Tuesday🟢 Nifty Analysis EOD – August 26, 2025 – Tuesday 🔴
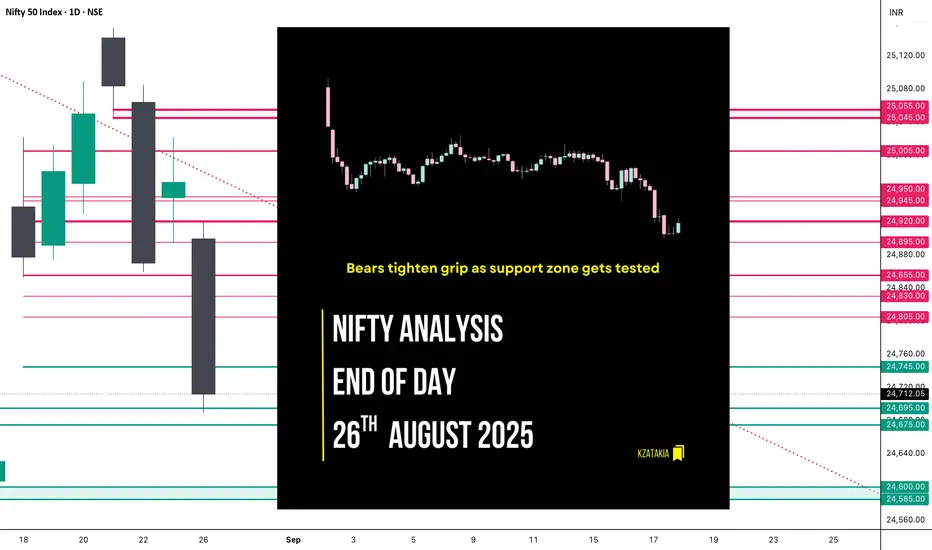
Bears tighten grip as support zone gets tested
📰 Nifty Summary
Nifty opened with a 72-point gap-down and extended the fall by more than 150 points, finding support at 24,755.
Despite a few recovery attempts, the index mostly hovered around VWAP. Around 3 PM, Nifty broke the day’s low to hit 24,689.60 before a minor 21-point bounce, finally closing at 24,710.70.
Monday’s upmove proved to be just a dead-cat bounce of Friday’s fall. After forming an Inside Bar on the daily chart, today’s breakdown extended the weakness. Now, holding the 24,585–24,600 zone will be crucial for any base-building attempts.
🛡 5 Min Intraday Chart with Levels
📊 Intraday Walk
Opened with a 72-point gap-down.
Sharp selling → tested 24,755 support.
Multiple recovery attempts, stuck around VWAP.
3 PM breakdown → new day low at 24,689.60.
Closed weak at 24,710.70, right at support.
📉 Daily Time Frame Chart with Intraday Levels
🕯 Daily Candle Breakdown
Open: 24,899.50
High: 24,919.65
Low: 24,689.60
Close: 24,712.05
Change: −255.70 (−1.02%)
🏗️ Structure Breakdown
Strong red candle (Close < Open).
Body: 187.45 points → decisive selling.
Upper wick: 20 points → no buying strength.
Lower wick: 22 points → negligible bounce.
📚 Interpretation
Market opened lower, weak recovery above 24,919.
Continuous selling dragged it near the day’s low.
Confirms bearish follow-through after rejection at 25,000 on Aug 22.
Candle type:
Bearish Marubozu-like, signaling bear dominance.
🛡 5 Min Intraday Chart
⚔️ Gladiator Strategy Update
ATR: 201.98
IB Range: 164.05 → Medium
Market Structure: ImBalanced
Trade Highlights: No trade triggered by the system
today.
📌 Support & Resistance Levels
Resistance Zones:
24,805 ~ 24,830
24,855
24,895
24,920
24,945 ~ 24,950
Support Zones:
24,695 ~ 24,675
24,600 ~ 24,585
🔮 What’s Next?
Short-term resistance now sits at 24,920, acting as a ceiling.
Support lies at 24,695–24,675, already tested today.
If broken, the next key zone is 24,585–24,600, crucial for base-building.
Trend clearly shifted from buying fatigue → decisive selling.
💭 Final Thoughts
“Markets don’t reverse on hope, they reverse on structure.”
With today’s close hugging the support zone, the next few sessions will decide if Nifty can stabilize—or if bears extend their grip further.
✏️ Disclaimer
This is just my personal viewpoint. Always consult your financial advisor before taking any action.
NIFTY S/R for 28/8/25Support and Resistance Levels:
Support Levels: These are price points (green line/shade) where a downward trend may be halted due to a concentration of buying interest. Imagine them as a safety net where buyers step in, preventing further decline.
Resistance Levels: Conversely, resistance levels (red line/shade) are where upward trends might stall due to increased selling interest. They act like a ceiling where sellers come in to push prices down.
Breakouts:
Bullish Breakout: When the price moves above resistance, it often indicates strong buying interest and the potential for a continued uptrend. Traders may view this as a signal to buy or hold.
Bearish Breakout: When the price falls below support, it can signal strong selling interest and the potential for a continued downtrend. Traders might see this as a cue to sell or avoid buying.
MA Ribbon (EMA 20, EMA 50, EMA 100, EMA 200) :
Above EMA: If the stock price is above the EMA, it suggests a potential uptrend or bullish momentum.
Below EMA: If the stock price is below the EMA, it indicates a potential downtrend or bearish momentum.
Trendline: A trendline is a straight line drawn on a chart to represent the general direction of a data point set.
Uptrend Line: Drawn by connecting the lows in an upward trend. Indicates that the price is moving higher over time. Acts as a support level, where prices tend to bounce upward.
Downtrend Line: Drawn by connecting the highs in a downward trend. Indicates that the price is moving lower over time. It acts as a resistance level, where prices tend to drop.
Disclaimer:
I am not SEBI registered. The information provided here is for learning purposes only and should not be interpreted as financial advice. Consider the broader market context and consult with a qualified financial advisor before making investment decisions.

Nifty 50 ~ Night skyThis is logical to see the price a little bit down.
We have here nice price mark. That can be used as a Take Profit.
Market is going up in the big picture. But we have right now a little downtrend tendency.

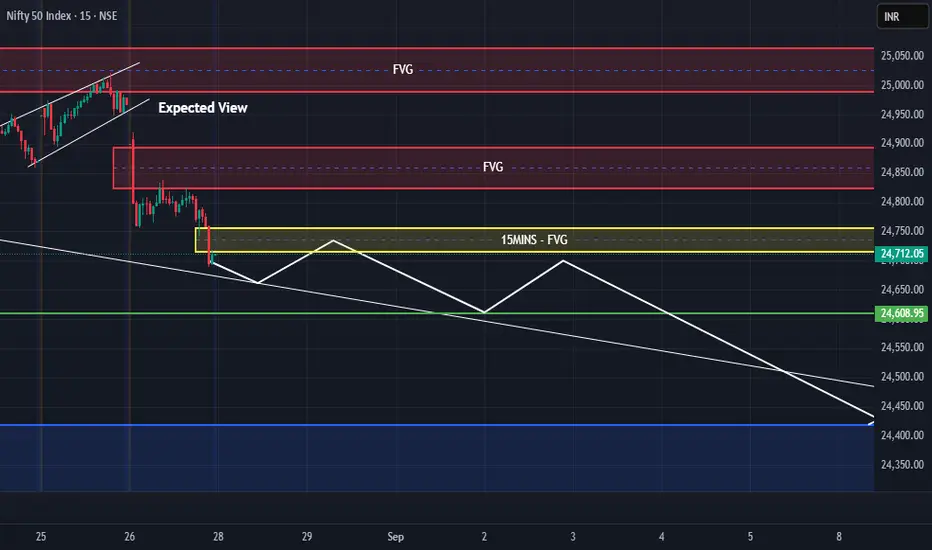
Nifty Analysis for 28-08-2025Bullish FVG has been mitigated by today but still there is some Order gaps are there.
Market Outlook: The analysis is bearish, anticipating a further decline in the Nifty 50. The current price is at 24,712.05.
Trading Strategy: The plan is to initiate a short (sell) trade. The strategy is to wait for the price to first retrace upwards, targeting a "Fair Value Gap" (FVG) left by prior price action.
Key Levels:
Entry: The optimal entry point for a short position is within the FVG zone, specifically between 24,850 and 24,900.
Stop-Loss (SL): To manage risk, the stop-loss should be placed just above this resistance area, at 24,950.
Target (T1): The primary profit-taking target is a strong support level at 24,400.
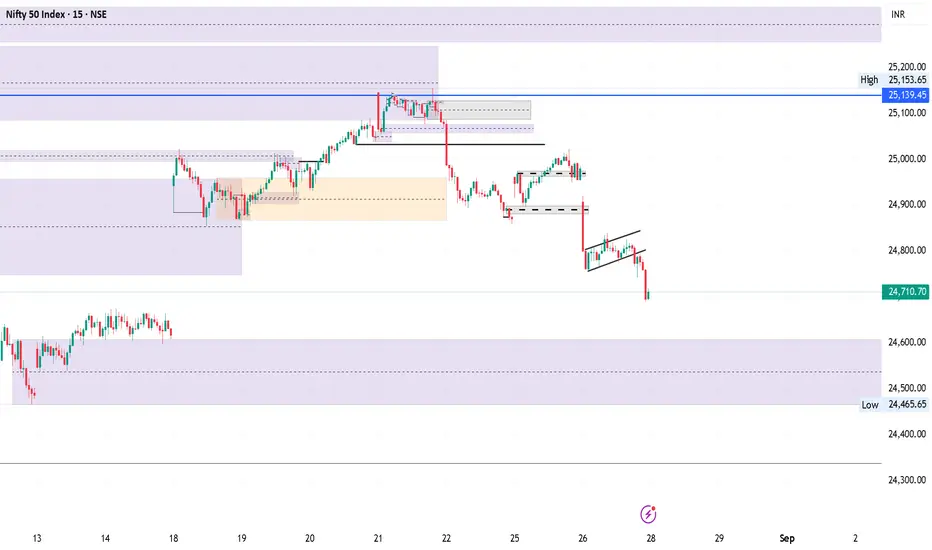
Why is Nifty50 Falling? | Technical OutlookBackground:
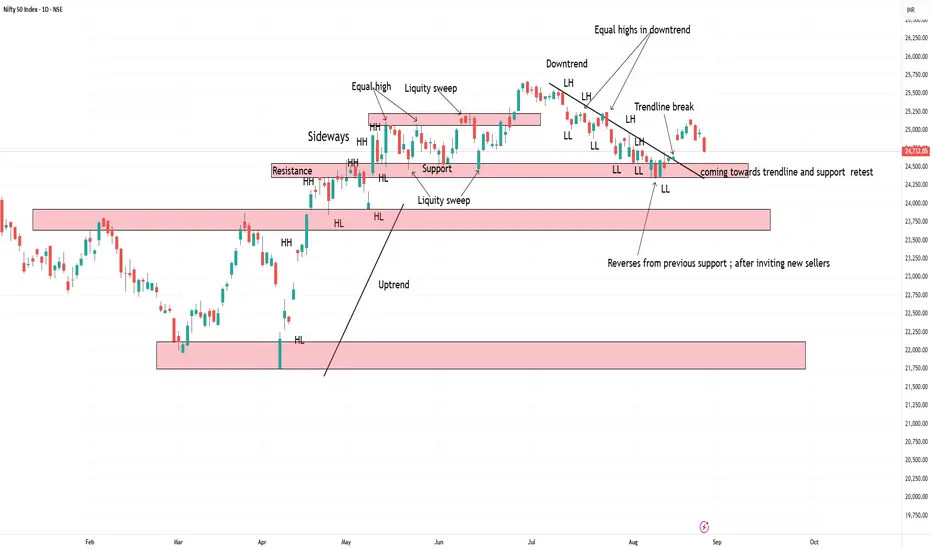
On 30th June, Nifty50 made a high of 25,699.35. From that point, the index entered a bearish trend, which extended down to the recent low of 24,337.50. This low marked a Break of Structure (BoS), signaling that a pullback phase was likely to follow.
-----------------------------------------------------------------------------------------------------------------
Pullback Phase:
The pullback began on 11th August, when price failed to break below the previous low and started forming higher highs (HH) and higher lows (HL).
If we plot a Fibonacci retracement from 30th June (high) to 11th August (low), the 0.618 (golden ratio) comes in around 25,139.45.
-----------------------------------------------------------------------------------------------------------------
Price Action:
On 14th August, the market opened with a gap up, likely leaving some unfilled buy orders behind. This gap also opened within the supply premium zone around the golden fib level.
Since then, the price has reversed to the downside, forming lower lows (LL) and lower highs (LH) aligning with the higher time frame bearish trend.
------------------------------------------------------------------------------------------------------------------
Key Levels to Watch:
24,600 – 24,465: Important POI (Point of Interest) for buyers.
24,337.50: A crucial structural level. If this level holds and price begins to form HH and HL again, it can be considered a strong low for buyers.
-------------------------------------------------------------------------------------------------------------------
Chart Patterns (15m timeframe):
Head & Shoulders formation.
Bear Flag pattern.
------------------------------------------------------------------------------------------------------------------
Additionally, Gift Nifty is already showing signs of weakness near 24,600. With markets closed tomorrow for the festive holiday, Thursday could potentially open with a gap down.
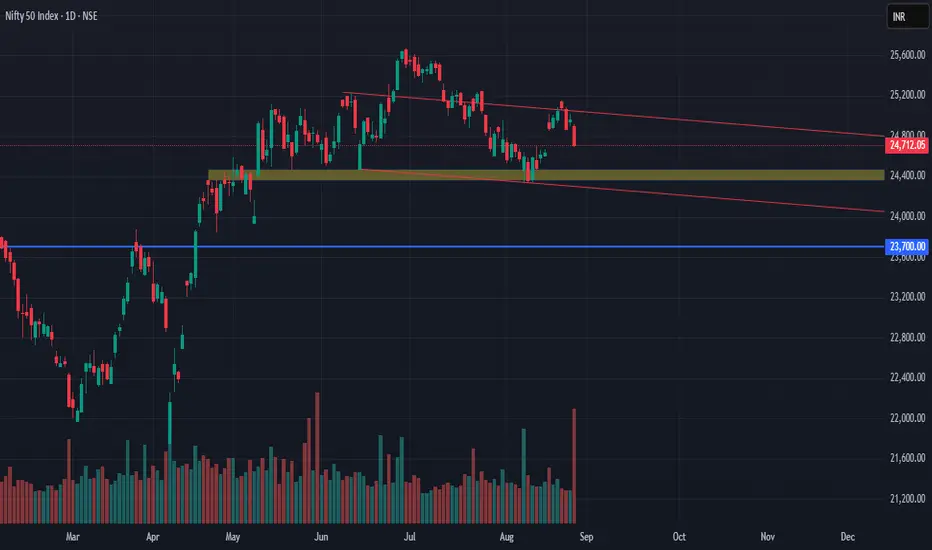
NIFTY MAY COME 23700 || WHAT TO DO NOWAs per my previous drawing you can check these are based on ZZ and Trend line.
Here again based on these tools simply we can have a view of 23700.
But always need to remember "Market Is God".
If I see any drawing changes based on price then I have to revise my drawing and target too.
Till then having the same view intact but with stop loss.
Why this is important?
It will help you to manage your investments and trading too.
So simply follow price action and SL and have a peace money ahead.
Thanks for reading.
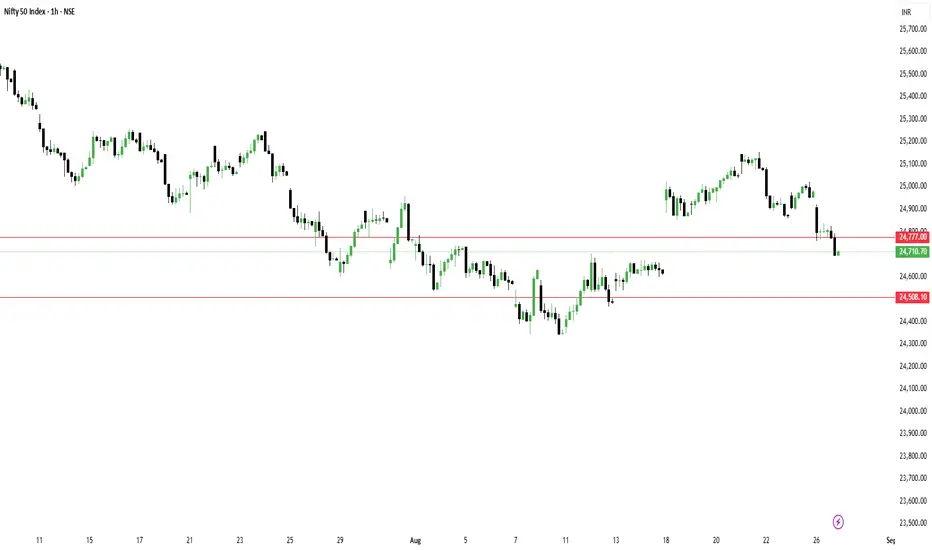
Nifty in search of a bottom before Trump Tariff Deadline. Nifty nose dived more than 1% today as the deadline for additional Tariff implementation has arrived. With a market holiday tomorrow investor shorted their positions. The supports for Nifty travelling in the hourly parallel channel which is shown in the chart seem to be at 24689 and 24573. If we get a closing below 24573 then Nifty can fall further to 24351 or below. We are in the zone from where historical RSI support as you can see in the chart. This makes it possible for Nifty to fight back on Thursday and Friday if things go well on Political front and there is no further bad news.
In the scenario of Nifty fighting back the resistance for Nifty seems to be at 24776. If we get a closing above 24776 then there is a triple strong resistance zone between 24850 and 24939. This zone consists of 4 strong resistances which are mid-channel resistance, Mother line of hourly chart, father line of hourly chart and finally trend line resistance. Once we get a closing above 24939 the future resistances will be at 25013, 25127 and finally 25253. Above 25253 closing Bulls will be back in business.
Disclaimer: The above information is provided for educational purpose, analysis and paper trading only. Please don't treat this as a buy or sell recommendation for the stock or index. The Techno-Funda analysis is based on data that is more than 3 months old. Supports and Resistances are determined by historic past peaks and Valley in the chart. Many other indicators and patterns like EMA, RSI, MACD, Volumes, Fibonacci, parallel channel etc. use historic data which is 3 months or older cyclical points. There is no guarantee they will work in future as markets are highly volatile and swings in prices are also due to macro and micro factors based on actions taken by the company as well as region and global events. Equity investment is subject to risks. I or my clients or family members might have positions in the stocks that we mention in our educational posts. We will not be responsible for any Profit or loss that may occur due to any financial decision taken based on any data provided in this message. Do consult your investment advisor before taking any financial decisions. Stop losses should be an important part of any investment in equity.

Nifty 50: Ditched the Buy Signal ,still in a sell trajectory Nifty 50: Ditched the Buy Signal ,still in a sell trajectory.
Currently sitting at a support of 24700 .
Another Support is at 24300.
MACD also turned back and couldn't pierce 0.
( Not a Buy / Sell Recommendation
Do your own due diligence ,Market is subject to risks, This is my own view and for learning only .)

Nifty levels - Aug 28, 2025Nifty support and resistance levels are valuable tools for making informed trading decisions, specifically when combined with the analysis of 5-minute timeframe candlesticks and VWAP. By closely monitoring these levels and observing the price movements within this timeframe, traders can enhance the accuracy of their entry and exit points. It is important to bear in mind that support and resistance levels are not fixed, and they can change over time as market conditions evolve.
The dashed lines on the chart indicate the reaction levels, serving as additional points of significance to consider. Furthermore, take note of the response at the levels of the High, Low, and Close values from the day prior.
We hope you find this information beneficial in your trading endeavors.
* If you found the idea appealing, kindly tap the Boost icon located below the chart. We encourage you to share your thoughts and comments regarding it.
Wishing you success in your trading activities!

Nifty 50Nifty 50 should hold around these zones and target 25669, We can look for confirmations from here to go long

NIFTY50 UPDATEAfter the formation of a diametric pattern, as expected, the NIFTY50 index experienced a strong upward movement. This upward movement concluded with the formation of a Reverse Contracting Triangle pattern. Given the current conditions, two probable scenarios lie ahead for the index:
1- The correction that followed the Reverse Contracting Triangle is wave-b of a larger upward movement, and after the completion of this wave, NIFTY50 will resume its upward trend. Considering the strong movement that occurred after the diametric pattern, it seems likely that this scenario could materialize. In this scenario, the 24337 level will not be broken to the downside.
2- If the price breaks below 24337, we should assume that a double pattern of triangle - X - diametric formed wave-a, and the Reverse Contracting Triangle that followed is wave-b of a larger corrective downward pattern, which could be a neutral or reverse triangle.
Good luck
NEoWave Chart

NIFTY KEY LEVELS FOR 26.08.2025NIFTY KEY LEVELS FOR 26.08.2025
************************* Time frame 3 Minutes******************************
If the candle stays above the pivot point, it is considered a bullish bias; if it remains below, it indicates a bearish bias. Price may reverse near Resistance 1 or Support 1. If it moves further, the next potential reversal zone is near Resistance 2 or Support 2. If these levels are also broken, we can expect the trend.
If the range(R2-S2) is narrow, the market may become volatile or trend strongly. If the range is wide, the market is more likely to remain sideways
📢 Disclaimer
I am not a SEBI-registered financial adviser.
The information, views, and ideas shared here are purely for educational and informational purposes only. They are not intended as investment advice or a recommendation to buy, sell, or hold any financial instruments.
Please consult with your SEBI-registered financial advisor before making any trading or investment decisions.
Trading and investing in the stock market involves risk, and you should do your own research and analysis. You are solely responsible for any decisions made based on this research.
26 August 2025 Nifty50 trading level Key Levels (25th Aug 2025 Close → 24,978.55)
25,218
🔺 Above 10m closing → Shot Cover Level
🔻 Below 10m → Hold PE by Safe Zone
25,133
🔺 Above 10m → Hold CE by Entry Level
🔻 Below 10m → Hold PE by Risky Zone
25,033
🔺 Above 10m → Positive Trade View
🔻 Below 10m → Negative Trade View
24,940 (Opening Levels)
🔺 Above Opening S1 → 10m Hold CE by Level
🔻 Below Opening R1 → 10m Hold PE by Level
24,840
🔺 Above 10m → Hold CE by Level
🔻 Below 10m → Hold PE by Level
24,738
🔺 Above 10m → Hold CE by Safe Zone
🔻 Below 10m → Unwinding Level

