Nifty reversal setupOn the daily chart, Nifty made a top at the upper Bollinger Band. last 3 times this happened, it dropped to the lower band. If the trend repeats, we may see 24,300 soon.
Trade ideas

Nifty levels - Aug 22, 2025Nifty support and resistance levels are valuable tools for making informed trading decisions, specifically when combined with the analysis of 5-minute timeframe candlesticks and VWAP. By closely monitoring these levels and observing the price movements within this timeframe, traders can enhance the accuracy of their entry and exit points. It is important to bear in mind that support and resistance levels are not fixed, and they can change over time as market conditions evolve.
The dashed lines on the chart indicate the reaction levels, serving as additional points of significance to consider. Furthermore, take note of the response at the levels of the High, Low, and Close values from the day prior.
We hope you find this information beneficial in your trading endeavors.
* If you found the idea appealing, kindly tap the Boost icon located below the chart. We encourage you to share your thoughts and comments regarding it.
Wishing you success in your trading activities!

25600 is the major resistance of Niftyon 3rd Oct 2024 nifty hade a good gap down and the high of the candle on that day has became the good resitance point in july 2025 it has touched that level of high of 3rd Oct 2024 that is 25600 and then it came down and no again Nifty is toddling towards that level

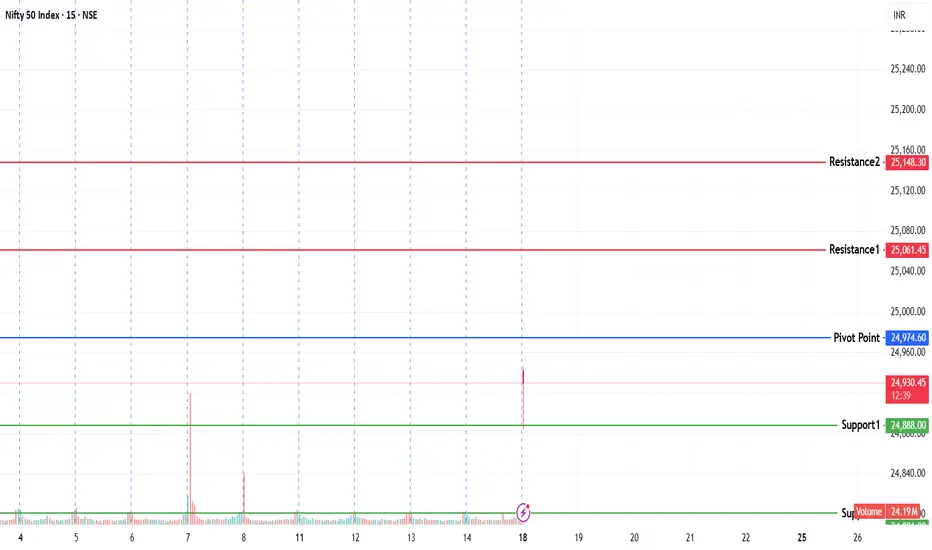
NIFTY KEY LEVELS FOR 21.08.2025NIFTY KEY LEVELS FOR 21.08.2025
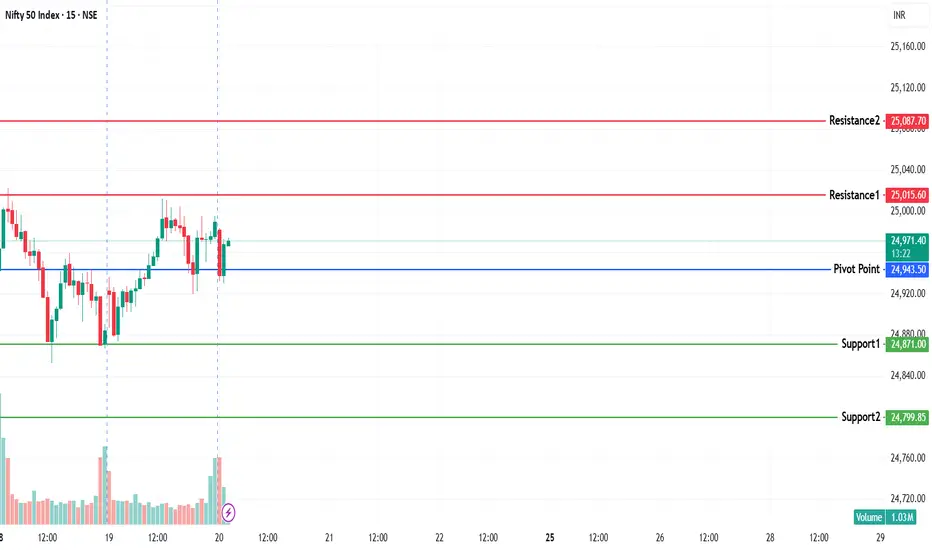
If the candle stays above the pivot point, it is considered a bullish bias; if it remains below, it indicates a bearish bias. Price may reverse near Resistance 1 or Support 1. If it moves further, the next potential reversal zone is near Resistance 2 or Support 2. If these levels are also broken, we can expect the trend.
If the range(R2-S2) is narrow, the market may become volatile or trend strongly. If the range is wide, the market is more likely to remain sideways
📢 Disclaimer
I am not a SEBI-registered financial adviser.
The information, views, and ideas shared here are purely for educational and informational purposes only. They are not intended as investment advice or a recommendation to buy, sell, or hold any financial instruments.
Please consult with your SEBI-registered financial advisor before making any trading or investment decisions.
Trading and investing in the stock market involves risk, and you should do your own research and analysis. You are solely responsible for any decisions made based on this research.

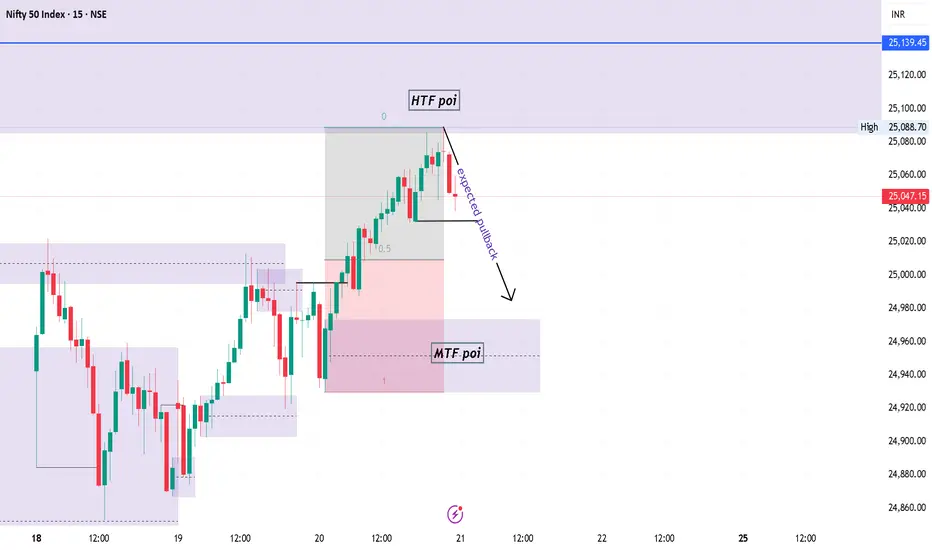
Nifty50 Trade setup (conditional long)Market Update & Plan
Yesterday, price tested our HTF POI and showed a slight rejection. Toward the end of the session, we also saw a strong bearish 15m candle.
For today, the safer approach is to wait for a pullback into the 24,973 – 24,929 zone and look for a bullish rejection candle there. The higher-timeframe trend for this week remains bullish, and since today is Thursday, it’s better not to trade against the trend. If the setup doesn’t align, we simply skip the trade just like we did last Thursday.

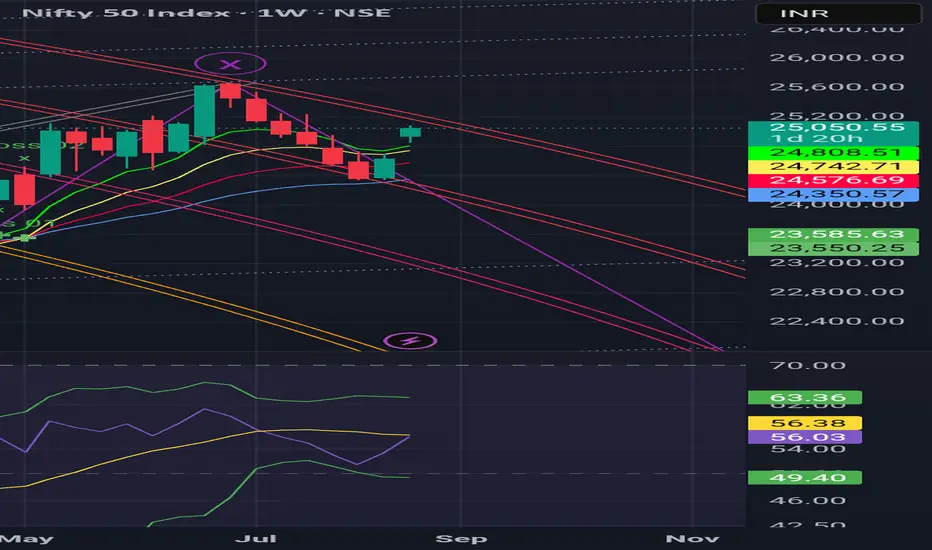
Wait till the Friday closing.There's a good chance that starting the following week, the Nifty will begin to decline even more quickly if it closes this week so that the corresponding RSI oscillator closes only a little bit near this yellow moving average line.
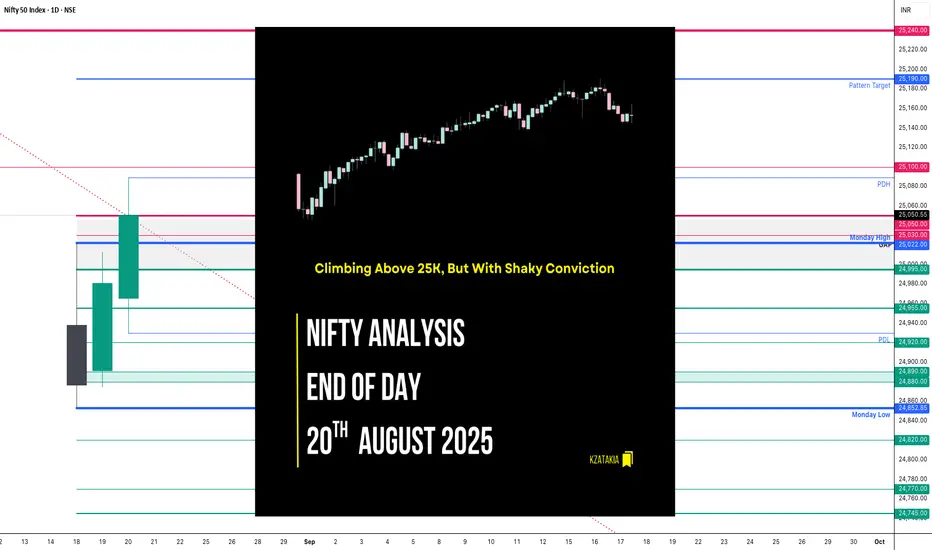
Nifty Analysis EOD – August 20, 2025 – Wednesday🟢 Nifty Analysis EOD – August 20, 2025 – Wednesday 🔴
Climbing Above 25K, But With Shaky Conviction
🗞 Nifty Summary
Nifty opened flat but slipped 50+ points in the opening minutes, sliding below the CPR zone to mark the day’s low at 24,929.70.
A sharp recovery followed — breaking the day’s high and reaching PDC (Previous Day Close) — only to get rejected and pulled back toward the CPR BC.
This 60-point rollercoaster played out within just 30 minutes, setting a volatile tone.
Later, after crossing 24,995, the index faced resistance at 25,020–25,030. Gradual progress pushed Nifty to 25,063, where it hit a trendline hurdle. Despite multiple attempts, it couldn’t hold convincingly above it, and the day ended at 25,050.55 — marginally positive (+ 70 points), but with effort showing fatigue.
👉 Intraday action tells the story: every breakout lacked conviction, with sharp throwbacks. While Nifty somehow managed to hold above 25k, Bank Nifty stayed weak, stuck near VWAP and below CPR (negative bias).
With weekly expiry tomorrow, sustainability above 24,990–25,030 and breakout PDH in the first half could trigger a short-covering rally targeting 25,190–25,240.
🛡 5 Min Intraday Chart with Levels
📊 Intraday Walk
🔻 Early dip → Below CPR, day low at 24,929.70.
🔼 Quick rebound → Tested PDC, rejection pulled back to CPR BC.
⚔️ 60-point whipsaws within first 30 mins = High volatility.
🔼 Crossed 24,995 → Resistance at 25,020–25,030 zone.
🚧 Stalled at 25,063 → Trendline resistance.
📉 Multiple failed breakouts, sharp pullbacks.
✅ Closed 25,050.55, above 25k but not convincing.
📉 Daily Time Frame Chart with Intraday Levels
🕯 Daily Candle Breakdown
Open: 24,965.80
High: 25,088.70
Low: 24,929.70
Close: 25,050.55
Change: +69.90 (+0.28%)
🏗️ Structure Breakdown
Green Candle (Close > Open).
Body: 84.75 points
Upper Wick: 38.15 points
Lower Wick: 36.10 points
Balanced wicks → Intraday tug-of-war.
📚 Interpretation
Buyers managed another close above 25,000.
Supply zone still active near 25,080–25,100 → sellers capping the rally.
Despite intraday volatility, close above open = continuation of bullish structure.
Candle suggests testing phase at 25k, not yet a clean breakout.
🕯️ Candle Type
A Spinning Top (bullish tilt) → indecision with buyers slightly ahead.
🛡 5 Min Intraday Chart
⚔️ Gladiator Strategy Update
ATR: 205.36
IB Range: 61.95 → Small
Market Structure: Balanced
Trade Highlight:
⏰ 10:10 AM → Long Trigger → Target Hit (R:R = 1:2)
🕵️ Range & Bias
Support Zone: 24,920 – 24,890
Resistance Zone: 25,090 – 25,100
Bias: Cautiously Bullish → Above 25k, but conviction lacking.
📌 Support & Resistance Levels
🎚️ Resistance Zones
25,030 – 25,050
25,100
25,190
25,240
🎚️ Support Zones
24,995
24,955
24,920
24,890 – 24,880
💡 Final Thoughts
Nifty is grinding higher, but intraday volatility and failed follow-throughs highlight lack of conviction. For expiry, the 25,100 ceiling is crucial. A sustained move above could trigger short-covering firepower, while below 24,930, the downside gap-filling risk reopens.
"Levels hold the key — conviction comes only when price sustains beyond them."
✏️ Disclaimer
This is my personal analysis — not investment advice. Please consult your financial advisor before trading.
Nifty 50 : Recovering quite well from the support of 24300Nifty 50 : Recovering quite well.
Almost sitting near the Buy signal now.
25250 will be an important level to test.
( Not a Buy / Sell Recommendation
Do your own due diligence ,Market is subject to risks, This is my own view and for learning only .)

Nifty levels - Aug 21, 2025Nifty support and resistance levels are valuable tools for making informed trading decisions, specifically when combined with the analysis of 5-minute timeframe candlesticks and VWAP. By closely monitoring these levels and observing the price movements within this timeframe, traders can enhance the accuracy of their entry and exit points. It is important to bear in mind that support and resistance levels are not fixed, and they can change over time as market conditions evolve.
The dashed lines on the chart indicate the reaction levels, serving as additional points of significance to consider. Furthermore, take note of the response at the levels of the High, Low, and Close values from the day prior.
We hope you find this information beneficial in your trading endeavors.
* If you found the idea appealing, kindly tap the Boost icon located below the chart. We encourage you to share your thoughts and comments regarding it.
Wishing you success in your trading activities!

NIFTY KEY LEVELS FOR 20.08.2025NIFTY KEY LEVELS FOR 20.08.2025
Sorry for the delayed post..
If the candle stays above the pivot point, it is considered a bullish bias; if it remains below, it indicates a bearish bias. Price may reverse near Resistance 1 or Support 1. If it moves further, the next potential reversal zone is near Resistance 2 or Support 2. If these levels are also broken, we can expect the trend.
If the range(R2-S2) is narrow, the market may become volatile or trend strongly. If the range is wide, the market is more likely to remain sideways
📢 Disclaimer
I am not a SEBI-registered financial adviser.
The information, views, and ideas shared here are purely for educational and informational purposes only. They are not intended as investment advice or a recommendation to buy, sell, or hold any financial instruments.
Please consult with your SEBI-registered financial advisor before making any trading or investment decisions.
Trading and investing in the stock market involves risk, and you should do your own research and analysis. You are solely responsible for any decisions made based on this research.
Nifty Today market traded in range of 24850 to 25020.
Either side broke out, then only move ment is possible.
Otherwise market traded in the range.

Nifty50 Index - Chart Pattern Trade - 18-22 Aug., 2025Nifty 50 Index Chart Pattern Analysis - 19th Aug., 2025.
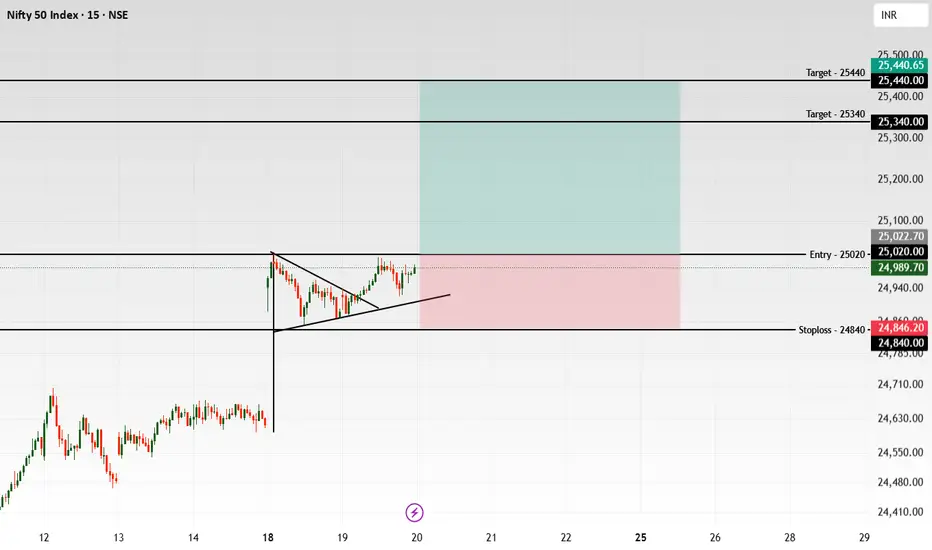
As a technical chart analyst, I’ve identified a classic symmetrical triangle breakout on the Nifty 50 Index’s 15-minute chart. This pattern forms when price action moves into a tightening range, and both buyers and sellers hesitate, creating converging trend lines. This signals a buildup of momentum that often results in a sharp breakout once either side gains control.
Why This Pattern Forms
The symmetrical triangle you see here represents a consolidation phase. In such periods, uncertainty leads to reduced volatility and a “coil” effect, where energy builds up for the next big move. Once that energy is released—usually with increased volume—a breakout confirms the next directional trend.
My Ideal Trade Setup
Entry:
I plan to enter above the breakout level at 25,020. This confirms that the buyers are taking charge and allows me to avoid “fake outs” that might trap traders.
Stoploss:
My stoploss is set at 24,840, just below the lower support and swing low. This protects my capital and enforces discipline in case the move fails. If by any chance I'll find Nifty here, will definitely pick the position as the best spot to enter, i.e. near stoploss.
Target:
I’m aiming for 25,340–25,447, applying the measured move rule from the triangle’s height projected upward from the entry. This is a realistic zone to book profits.
Exit Strategy for Momentum Loss
If momentum fades after my entry—indicated by weak follow-through, low volume, or reversal candles—I’ll exit early, even before my stoploss is hit. Staying nimble is key if the breakout fails to hold and the price slides below the entry after confirming the breakout.
My Trading Approach
Entering only after a confirmed breakout above 25,020.
Keeping a tight stoploss at 24,840 for risk management. May try near SL or make 2 attempt if necessary.
Booking profits at the projected target zone—never letting greed override discipline.
Reacting quickly if momentum wanes, prioritizing capital protection.
This strategy keeps my trades efficient and minimizes risk while leveraging the power of classic breakout patterns.
Follow for more such inputs.
Nifty showing strength but nearing key resistances now.Nifty had a good closing today up 103.7 points closing just below 25K at 24980.65. Things have taken a positive turn after the GST relief related announcement from GOI. Today Reliance did heavy lifting as it was up 2.84%.
Now the Nifty is entering a zone where there are few important hurdles. Once they are crossed there is a fair Chance of proper Bull run. The resistance in front of Nifty now are at 24992, 25042, 25133 and most importantly the zone between 25245 to 25328. Above 25328 there is strong Bullish territory.
The supports for Nifty remain at 24866, 24820 (Father Line support), 24742 (Mother line support). Below 24742 there can be further bearish weakness which can pull Nifty down towards 24573 or even 24341. (But that can happen only if we get a closing below 24742.
Right now the Nifty seems to be in Bullish mode with few resistances approaching.
Disclaimer: The above information is provided for educational purpose, analysis and paper trading only. Please don't treat this as a buy or sell recommendation for the stock or index. The Techno-Funda analysis is based on data that is more than 3 months old. Supports and Resistances are determined by historic past peaks and Valley in the chart. Many other indicators and patterns like EMA, RSI, MACD, Volumes, Fibonacci, parallel channel etc. use historic data which is 3 months or older cyclical points. There is no guarantee they will work in future as markets are highly volatile and swings in prices are also due to macro and micro factors based on actions taken by the company as well as region and global events. Equity investment is subject to risks. I or my clients or family members might have positions in the stocks that we mention in our educational posts. We will not be responsible for any Profit or loss that may occur due to any financial decision taken based on any data provided in this message. Do consult your investment advisor before taking any financial decisions. Stop losses should be an important part of any investment in equity.

Nifty Inside Bar CandleNifty Formed Inside Bar Candle Entry 25013 SL 24873 T1 25191 T2 25275
Else Lower break then
Entry 24873 T1 24683 T2 24599

Nifty levels - Aug 20, 2025Nifty support and resistance levels are valuable tools for making informed trading decisions, specifically when combined with the analysis of 5-minute timeframe candlesticks and VWAP. By closely monitoring these levels and observing the price movements within this timeframe, traders can enhance the accuracy of their entry and exit points. It is important to bear in mind that support and resistance levels are not fixed, and they can change over time as market conditions evolve.
The dashed lines on the chart indicate the reaction levels, serving as additional points of significance to consider. Furthermore, take note of the response at the levels of the High, Low, and Close values from the day prior.
We hope you find this information beneficial in your trading endeavors.
* If you found the idea appealing, kindly tap the Boost icon located below the chart. We encourage you to share your thoughts and comments regarding it.
Wishing you success in your trading activities!

NIFTY KEY LEVELS FOR 19.08.2025NIFTY KEY LEVELS FOR 19.08.2025
Sorry for the delayed post..
If the candle stays above the pivot point, it is considered a bullish bias; if it remains below, it indicates a bearish bias. Price may reverse near Resistance 1 or Support 1. If it moves further, the next potential reversal zone is near Resistance 2 or Support 2. If these levels are also broken, we can expect the trend.
If the range(R2-S2) is narrow, the market may become volatile or trend strongly. If the range is wide, the market is more likely to remain sideways
📢 Disclaimer
I am not a SEBI-registered financial adviser.
The information, views, and ideas shared here are purely for educational and informational purposes only. They are not intended as investment advice or a recommendation to buy, sell, or hold any financial instruments.
Please consult with your SEBI-registered financial advisor before making any trading or investment decisions.
Trading and investing in the stock market involves risk, and you should do your own research and analysis. You are solely responsible for any decisions made based on this research.

NIFTY S/R for 19/8/25Support and Resistance Levels:
Support Levels: These are price points (green line/shade) where a downward trend may be halted due to a concentration of buying interest. Imagine them as a safety net where buyers step in, preventing further decline.
Resistance Levels: Conversely, resistance levels (red line/shade) are where upward trends might stall due to increased selling interest. They act like a ceiling where sellers come in to push prices down.
Breakouts:
Bullish Breakout: When the price moves above resistance, it often indicates strong buying interest and the potential for a continued uptrend. Traders may view this as a signal to buy or hold.
Bearish Breakout: When the price falls below support, it can signal strong selling interest and the potential for a continued downtrend. Traders might see this as a cue to sell or avoid buying.
MA Ribbon (EMA 20, EMA 50, EMA 100, EMA 200) :
Above EMA: If the stock price is above the EMA, it suggests a potential uptrend or bullish momentum.
Below EMA: If the stock price is below the EMA, it indicates a potential downtrend or bearish momentum.
Trendline: A trendline is a straight line drawn on a chart to represent the general direction of a data point set.
Uptrend Line: Drawn by connecting the lows in an upward trend. Indicates that the price is moving higher over time. Acts as a support level, where prices tend to bounce upward.
Downtrend Line: Drawn by connecting the highs in a downward trend. Indicates that the price is moving lower over time. It acts as a resistance level, where prices tend to drop.
Disclaimer:
I am not SEBI registered. The information provided here is for learning purposes only and should not be interpreted as financial advice. Consider the broader market context and consult with a qualified financial advisor before making investment decisions.

Nifty Nifty buy above 24900 for target 25000.
Sell below 24800 for target 24700.
This is educational purpose only.

GST related jump; Auto, Consumption & others breaks market slumpThere was some positive game changing news required to break the market slump which was provided by honourable PM in his Independence day speech. Now exact GST slots and how the same is implemented is yet to be seen. There was some negative news as well as EU and Ukraine and US do not seem to be on the same page with respect to ceasefire between Russia and Ukraine. So still there are some Global issues which are yet to be answered.
Additionally the Tariff war in general and with respect to India is not yet solved. Additionally the Trade talks between India and US have gone for a toss with next meeting which was to happen later this month has been postponed indefinitely. Thus the signal is not clear cut green. So once the GST Euphoria subsides there can be consolidation/correction again so traders have to be cautious. Long term investors can see this as an opportunity for reshuffling Portfolio in line with local consumption related stocks. Some of the Auto stocks have gone absolutely in the 5th gear. Consumption is heating up, Finance and Baking, Insurance, realty and FMCG can also join the band wagon along with Infra and capital goods in future. IT, Oil &Gas, Power can take a back seat for now but might join the band wagon if up move persists.
Overall what we saw today was a good up move. If Nifty is able to clear key resistances we can see strong up move across the sectors. If not so there can be further consolidation and sectoral rotation. Things are in balance right now. Predicting next move is difficult but certainly it was a good day on browsers.
Major events are unfolding but clarity will be there once the dust settles. Now the Nifty supports and resistances are as under:
Nifty supports remain at: 24810 (Father line of Hourly chart), 24746, 24671 (Mother line of Hourly chart), 24534 and 24334.
Nifty Resistances Remain at: 24995, 25116, 25246 (Trend Line Resistance above which Bulls will be comfortable), 25405, 25544 and finally 25639.
Disclaimer: The above information is provided for educational purpose, analysis and paper trading only. Please don't treat this as a buy or sell recommendation for the stock or index. The Techno-Funda analysis is based on data that is more than 3 months old. Supports and Resistances are determined by historic past peaks and Valley in the chart. Many other indicators and patterns like EMA, RSI, MACD, Volumes, Fibonacci, parallel channel etc. use historic data which is 3 months or older cyclical points. There is no guarantee they will work in future as markets are highly volatile and swings in prices are also due to macro and micro factors based on actions taken by the company as well as region and global events. Equity investment is subject to risks. I or my clients or family members might have positions in the stocks that we mention in our educational posts. We will not be responsible for any Profit or loss that may occur due to any financial decision taken based on any data provided in this message. Do consult your investment advisor before taking any financial decisions. Stop losses should be an important part of any investment in equity.

Nifty Analysis EOD – August 18, 2025 – Monday🟢 Nifty Analysis EOD – August 18, 2025 – Monday 🔴
Gap-Up Glory Meets 25K Roadblock
🗞 Nifty Summary
Nifty opened with a massive 300+ point gap-up, but early profit booking dragged it down by 58 points. A sharp rebound from the day’s low in the first 5 min carried it to a new high of 25,022, just testing the psychological 25K level.
However, that zone acted as a ceiling; profit booking and fresh selling kicked in, pulling Nifty not only below the high or mean but also beneath the opening print and morning day low. After a brief 100-point bounce from a fresh day low, rejection from the VWAP kept the index suppressed.
By the close, Nifty settled near the day’s bottom at 24,876.95, still up +245.65 points (+1.00%) but printing a red candle due to closing below the open.
👉 A textbook gap-up exhaustion session: bullish sentiment upfront, intraday dominated by selling pressure.
📊 Intraday Walk
🚀 Gap-Up Start: Open at 24,938.20 (up >300 points).
📉 Early Booking: Dragged down ~58 points.
🔄 Quick Rebound: Buyers drove Nifty to the day high at 25,022.
⛔ 25K Blocked: Profit booking intensified, breaking below opening levels.
⚡ Second Bounce: +100 points recovery attempt from new day low.
📉 VWAP Rejection: Sellers regained control; close near the bottom at 24,876.95.
🛡 5 Min Intraday Chart with Levels
📉 Daily Time Frame Chart with Intraday Levels
🕯 Daily Candle Breakdown
Open: 24,938.20
High: 25,022.00
Low: 24,852.85
Close: 24,876.95
Change: +245.65 (+1.00%)
Candle Structure
Type: Red candle (close < open) despite a strong % gain.
Body: 61.25 pts
Upper Wick: 83.80 pts
Lower Wick: 24.10 pts
Interpretation
Market opened strong but gave back intraday gains.
Candle resembles an Inverted Hammer / Shooting Star in a gap-up.
Signals loss of bullish momentum, but needs next session confirmation.
🛡 5 Min Intraday Chart
⚔️ Gladiator Strategy Update
ATR: 218.49
IB Range: 137.7 → Medium
Market Structure: imBalanced
Trade Highlight: No trade triggered
📌 Support & Resistance Levels
Resistance Zones
24,955
24,995
25,030 – 25,050
25,100
25,240
Support Zones
24,850 – 24,820
24,770 – 24,745
24,695 – 24,675
24,600 – 24,585
🎯 What’s Next?
If 24820 ~ 24,850 holds, buyers may regroup and reattempt a breakout above 25,000.
If broken, expect deeper profit booking toward 24,745 – 24,675.
Psychological pressure at 25K remains the key battle zone.
💡 Final Thoughts
Today was a classic gap-up exhaustion day — the market showed enthusiasm, but sellers ruled intraday.
“Markets love to test conviction. What looks like strength at open can often be weakness by close.”
✏️ Disclaimer
This is just my personal viewpoint. Always consult your financial advisor before taking any action.

Nifty levels - Aug 19, 2025Nifty support and resistance levels are valuable tools for making informed trading decisions, specifically when combined with the analysis of 5-minute timeframe candlesticks and VWAP. By closely monitoring these levels and observing the price movements within this timeframe, traders can enhance the accuracy of their entry and exit points. It is important to bear in mind that support and resistance levels are not fixed, and they can change over time as market conditions evolve.
The dashed lines on the chart indicate the reaction levels, serving as additional points of significance to consider. Furthermore, take note of the response at the levels of the High, Low, and Close values from the day prior.
We hope you find this information beneficial in your trading endeavors.
* If you found the idea appealing, kindly tap the Boost icon located below the chart. We encourage you to share your thoughts and comments regarding it.
Wishing you success in your trading activities!

NIFTY KEY LEVELS FOR 18.08.2025NIFTY KEY LEVELS FOR 18.08.2025
If the candle stays above the pivot point, it is considered a bullish bias; if it remains below, it indicates a bearish bias. Price may reverse near Resistance 1 or Support 1. If it moves further, the next potential reversal zone is near Resistance 2 or Support 2. If these levels are also broken, we can expect the trend.
If the range(R2-S2) is narrow, the market may become volatile or trend strongly. If the range is wide, the market is more likely to remain sideways
📢 Disclaimer
I am not a SEBI-registered financial adviser.
The information, views, and ideas shared here are purely for educational and informational purposes only. They are not intended as investment advice or a recommendation to buy, sell, or hold any financial instruments.
Please consult with your SEBI-registered financial advisor before making any trading or investment decisions.
Trading and investing in the stock market involves risk, and you should do your own research and analysis. You are solely responsible for any decisions made based on this research.