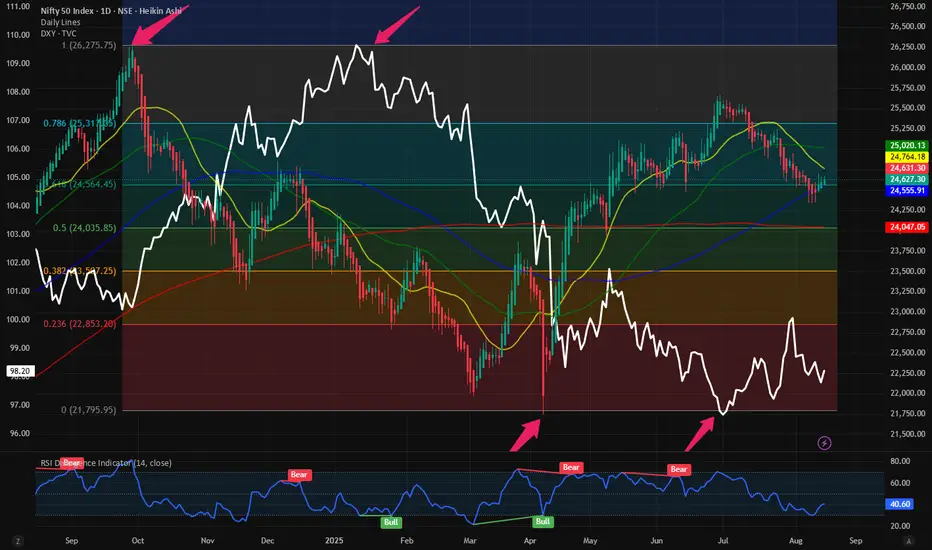
$NIFTY: Failed breakout, no bullish pattern visible Indian equity markets were the investors favorite for many years, and it did perform very well for the last 10 years. At its peak the index has generated 150% return for its investors in the last 5 years beating the S&P500 and even the tech heavy NASDAQ100. But since peaking in Sept 2024 the index has been lower to sideways for almost 12 months.
The recent poor price action in NSE:NIFTY has resulted in the index down more than 10% from its highs. With SP:SPX and PEPPERSTONE:NAS100 at or new their ATH and TVC:DXY below 100 the index is unable to break out of this poor price action. On July 27 we discussed this and concluded that the medium-term target of 2600 on NSE:NIFTY and 96 on TVC:DXY remains intact. Since then, we are more of less unchanged on both the indices. Now let’s look into the Fib retracement levels on the Daily chart of $NIFTY. The Tops and the bottom on the NSE:NIFTY correspond perfectly with that of $DXY.
We need a revision in our short to medium term expectation in bot the indices. Now I expect much poor price action within NSE:NIFTY as it has very little momentum left to show for. We should be happy if we can touch the 0.786 Fib levels which is @ 25300 which indicates a meagre 3% upside from here.
Verdict: Underperform. NSE:NIFTY minimum upside potential in the index. Rather go long other risky assets to outperform the markets.
Trade ideas
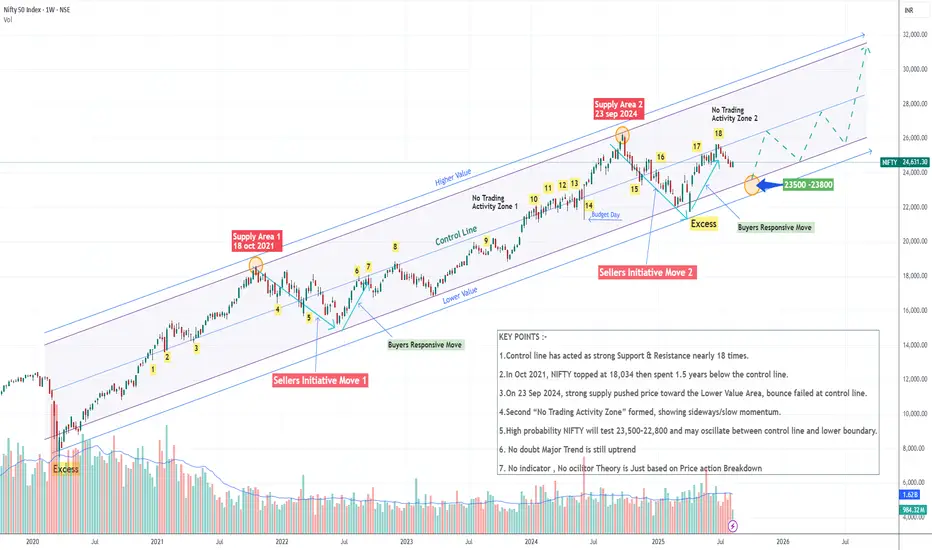
“NIFTY Price Action Breakdown Signals Next Big Move”🔑 Key Highlights
(1) Control Line as Key Zone
➡️The control line has acted as strong support and resistance multiple times (around 18 confirmations).
(2) Historical Example (Oct 2021)
➡️On 18 Oct 2021, NIFTY made a new high at 18,034.
➡️ The selling pressure was so intense that the index spent nearly 1.5 years trading below the control line.
(3) Recent Supply Zone (Sep 2024)
➡️On 23 Sep 2024, heavy selling activity pushed the market down toward the lower value area.
➡️Even after rebounding, the index once again faced resistance at the control line.
(4) No Trading Activity Zones
➡️The market has already formed one such zone in the past.
➡️Now a second “no trading activity zone” has been confirmed, showing reduced momentum and sideways behavior.
(5) Next Possible Move
➡️There is a high probability that NIFTY will attempt to test the Lower Value Area (23,500–22,800).
➡️After that, the market may oscillate between the control line and the lower boundary before deciding its next major direction.
👉 This entire analysis is based purely on DAMIR’s Price Action Breakdown theory, no indictor, no oscillator had been used.
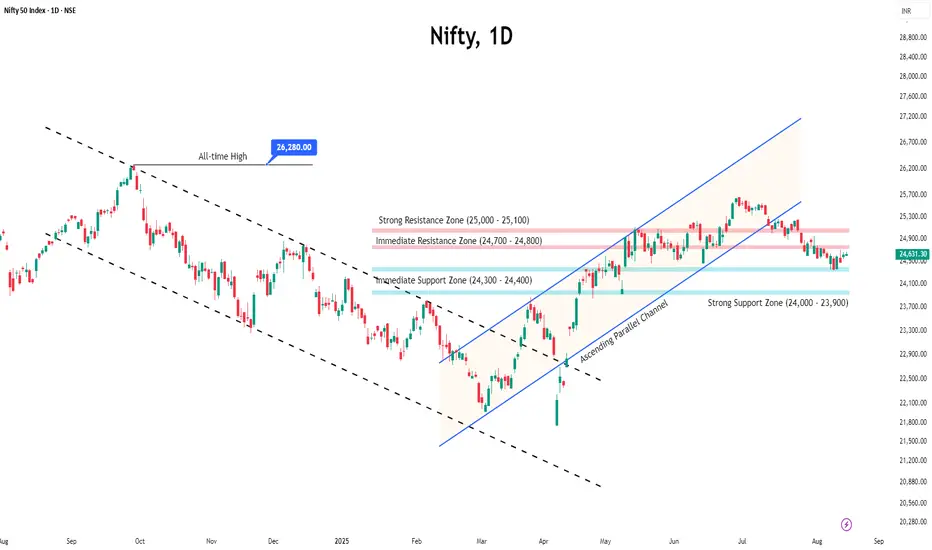
GST Reforms + Cooling Inflation: Can Nifty Aim for 25,800..?🚀 Nifty 50: Breakout + Big Policy Boost ?
📉 Technical View
Nifty 50 has broken out of its downward channel and is testing higher levels.
* Key resistance: 24,850 🔑
* If sustained & retested → next target: 25,800 🎯
This could mark the start of a fresh bullish leg if momentum holds.
📊 Macro Tailwinds
* Inflation cools off ➝ July CPI at 1.55% (lowest since June 2017) 😮
* Food inflation at -1.76%, down from -1.06% in June.
👉 Softening inflation = stronger spending power + supportive environment 📈
📰 Policy Catalyst: GST Reforms by Diwali 2025
PM Modi’s Independence Day speech highlighted “Next-Gen GST Reforms” 🇮🇳:
* 12% GST slab ➝ may shift to 5% 💡
* 28% GST slab ➝ may shift to 18% 📉
* New 40% slab for sin goods (tobacco, beer, etc.) 🚬🍺
➡️ Could lighten tax burden, stimulate consumption, and lift corporate profits.
⚡ Takeaway
Technical breakout + cooling inflation + GST reforms = constructive setup for Nifty 50.
* Watch 24,850 carefully → breakout & retest opens gates to 25,800.
📌 Note: Global risk remains. Trump’s proposed additional tariffs could hinder the trend and inject volatility 🌍⚠️.

Nifty August TDX Levels -Observation:
The month has erupted with a bearish undertone, casting shadows over the market’s horizon. It’s a turbulent start, fraught with uncertainty .
Bulls:
Despite the indicators flashing oversold, there’s a flicker of hope—a glimmer that a resilient bullish pattern might awaken on a smaller time frame. Yet, patience is vital; we must wait for that decisive moment when the market reveals a clear bullish formation before boldly stepping in.
Bears:
Since the dawn of last month, relentless downward momentum has engulfed the markets .
Now, only a tentative pullback, should tempt us to initiate fresh short positions, for the risk-reward landscape remains perilous and unkind.
Conclusion:
The true opportunities lie at the crucial junctures—those key Support and Resistance levels, pausing points within the intricate dance of Time Cycles. It is only when these points are reached that we should reassess with clarity and resolve. The probability of an Impulsive wave surging forth is high; the current Corrective wave has hit its targets, yet its story remains unfinished—setting the stage for a potential dramatic turn in the market’s saga.
For sharper insight and a more profound understanding, I urge you to view the chart through the hourly lens. Only then can the full emotional weight and strategic clarity of these movements come into focus.

Nifty Rebounds After Six-Week Fall, Consolidation Continues● Nifty finally ended its six-week losing run, closing the week with a 1.10% gain despite trading in a narrow range.
● Volatility inched higher, with India VIX rising 2.68% to 12.35, reflecting a slightly elevated risk perception, though it remains comfortably low.
● On the technical front, the 24,300–24,400 zone is likely to act as immediate support, while resistance is seen at 24,700–24,800.
● Heading into nest expiry, the index is expected to remain in a neutral phase as it continues to consolidate below key resistance levels. Without a decisive breakout, aggressive buying should be avoided.
● Traders are advised to closely monitor price action around these key levels and manage risk carefully while planning trades.
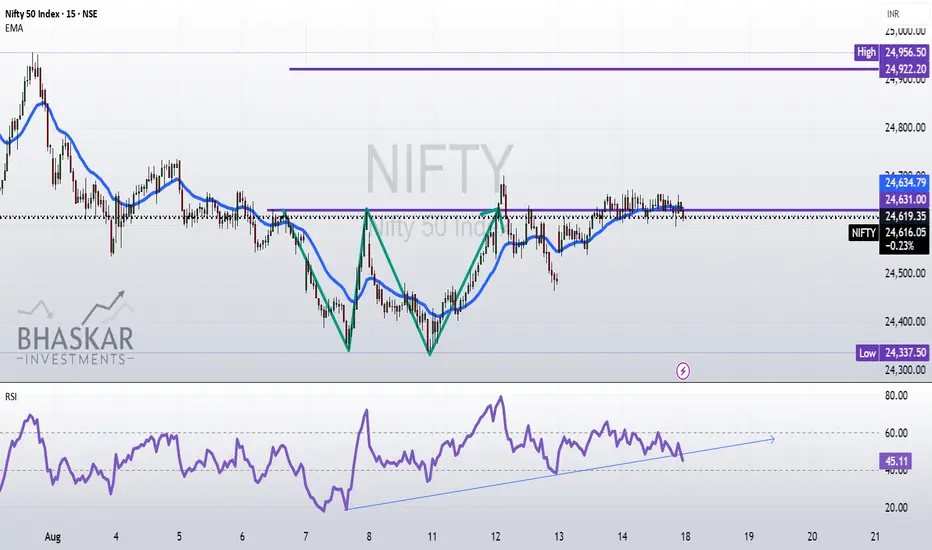
Explaining concept of RSI with respect EMA.The NIFTY50 is currently displaying a bullish setup, characterized by the formation of a ‘W’ pattern on the chart. This structure is further supported by a strengthening Relative Strength Index (RSI), which indicates improving momentum. Additionally, the price action is aligning positively with the EMA20 , reinforcing the potential for an upward move. Together, these technical signals suggest that NIFTY50 may experience bullish momentum in the near future.
Disclaimer:
I am NOT a SEBI registered advisor nor a financial advisor.
Any investments or trades I discuss on my blog are intended solely for educational purposes and do not represent specific financial, trading, or investment advice.
Disclosure:
I, the author of this report, and my immediate family members do not have any financial interest or beneficial ownership in the securities mentioned herein at the time of publication.
Nifty August 3rd Week AnalysisNifty is looking positive, but there's uncertainty whether it will be able to hold on to the upside. We can expect momentum up to 25000, but for that, it must sustain above 24730-800. Otherwise, we can expect a sell-off on a rise. On the downside, Nifty has been defending 24350 for the last 2 weeks, and therefore, it is a strong support zone now, and no major downside is expected until Nifty breaches 24350.


Nifty is retracing from supportNifty is retracing from support.Trum -Putin meeting yesterday in Alaska looks like productive positive for markets.

Wkly Market Wrap – Nifty Breaks Losing Streak, Bulls Eye 25,100Nifty closed the week at 24,631, up 270 points from last week’s close, after hitting a high of 24,702 and a low of 24,347. As I highlighted in last week’s outlook, Nifty once again respected my range of 24,800–23,900 to the dot.
After five straight weeks of red, we finally saw a green weekly close—a much-needed breather for the bulls. But remember, this is the first pullback after a prolonged downtrend, so sellers are likely to make another attempt to drag the markets lower.
📌 Key levels for next week:
Support: 24,300 – If bulls defend this level, we could see a rally toward 25,000–25,100.
Resistance: 25,100 – Strong selling pressure likely here.
Even if 24,300 breaks, I don’t expect Nifty to slip below 24,200–24,150 this week.
💡 Opportunity Alert: For those who’ve been patiently waiting for a dip to enter, this week could present a good buying window—possibly followed by another opportunity by the second week of September. Have your list of fundamentally strong stocks ready to pounce.
Global Cue – S&P 500 on Fire
The S&P 500 once again closed at a new all-time high of 6,468, and the momentum suggests it’s on track to test the key Fibonacci level of 6,568. If you’re invested in the US markets, trail your stop-loss to 6,200 to safeguard profits.
Bulls are back in the game, but sellers haven’t left the field—next week will be all about who controls the pitch!

Nifty Weekly Outlook (15–21 August 2025)Nifty Weekly Outlook (15–21 August 2025)
Above pivot = bullish bias.
Below pivot = bearish bias.
Watch for reversals near R1/S1, then R2/S2, and finally R3/S3 if levels break.
📢 Disclaimer
I am not a SEBI-registered financial adviser.
The information, views, and ideas shared here are purely for educational and informational purposes only. They are not intended as investment advice or a recommendation to buy, sell, or hold any financial instruments.
Please consult with your SEBI-registered financial advisor before making any trading or investment decisions.
Trading and investing in the stock market involves risk, and you should do your own research and analysis. You are solely responsible for any decisions made based on this research.
Nifty trading Zones for Next WeekNifty 50 Trading Opportunities with proper zones. Enter purely Based on Techinical Zones when price respects the areas marked.

Nifty Analysis EOD – August 14, 2025 – Thursday 🟢 Nifty Analysis EOD – August 14, 2025 – Thursday 🔴
Quiet Expiry Day on the Surface, Wild Moves Beneath
🗞 Nifty Summary
Nifty opened neutral, and within the first 1 minute carved a 60-point range — a range that turned out to be almost the entire day’s action. For the rest of the session, the index stayed locked inside this band, repeatedly attempting to break above the PDH + R1 zone, but each time failing to sustain. Similarly, the lower boundary provided reliable support, keeping Nifty trapped.
While the overall weekly expiry felt silent in terms of range, the price action inside the band was anything but quiet — wild intraday swings offered ample opportunities for scalpers and quick traders. Structurally, today’s range stayed inside the previous day’s range, aside from a few points of false breakout shadows.
The game plan for the next session remains the same as discussed yesterday — we’re still waiting for a decisive breakout from this coiling structure.
Refere the game plan here:
🛡 5 Min Intraday Chart with Levels
📉 Daily Time Frame Chart with Intraday Levels
🕯 Daily Candle Breakdown
Candle Data:
Open: 24,607.25
High: 24,673.65
Low: 24,596.90
Close: 24,631.30
Change: +11.95 (+0.05%)
Structure Breakdown:
Green candle (Close > Open)
Body size: 24.05 points → very small → low momentum
Upper wick: 42.35 points
Lower wick: 10.35 points
Interpretation:
Market opened near yesterday’s close, tried pushing higher but failed to hold gains.
Small green body signals sideways indecision; buyers still defended the 24,600 zone.
Longer upper wick vs lower wick → selling pressure near highs.
Candle Type:
Small-bodied Spinning Top / Doji-like candle → indecision, no clear trend control.
📊 Short-Term View
Consolidation persists in 24,600–24,650 zone.
Break above 24,675 = bullish strength.
Break below 24,595 = bearish momentum toward 24,535–24,460.
Range & Bias:
Support: 24,595 – 24,535
Resistance: 24,675 – 24,700
Bias: Neutral-to-mildly bullish above 24,600
🛡 5 Min Intraday Chart
⚔ Gladiator Strategy Update
ATR: 199.36
IB Range: 68.25 → Medium
Market Structure: Balanced
Trade Highlight: No Trade Triggered
📌 Support & Resistance Levels
Resistance Zones:
24,660
24,690 ~ 24,700
24,735
24,780
Support Zones:
24,585
24,560
24,525 ~ 24,515
24,500
24,475
💡 Final Thoughts
"The tighter the coil, the sharper the breakout."
Nifty is compressing hard — a breakout is inevitable, and expiry’s quietness might just be the calm before a directional move.
✏️ Disclaimer
This is a personal market observation, not financial advice.

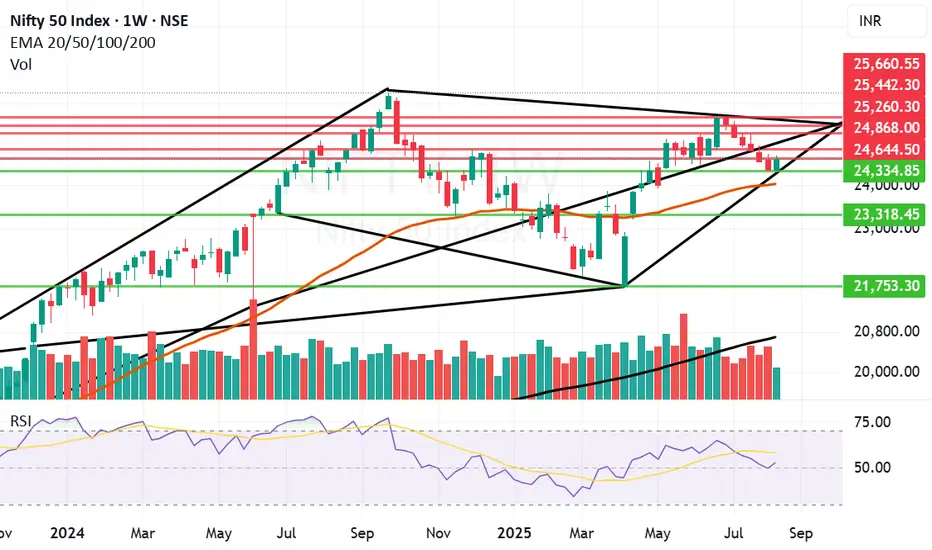
Nifty successful in breaking the falling pattern after 6 weeksNifty against all odds was successful in breaking the falling pattern after 6 weeks. However we are not out of danger yet. We need another positive weekly candle next week to confirm the reversal. As of now we do not know for sure that the low of last week that is 24337 is the bottom or bottom is yet to be made but anyway it was a great fight back against all odds of Trump Tariff Tantrum and the news of US's cozying up with our unfriendly neighbours.
Amongst all this noise the great news came this evening when S&P (Standard & Poor's global sovereign rating agency) which has changed outlook for India after 17 years this welcome change comes as India's rating improved to BBB from BBB- that is from Stable to Positive. This is for all the nay Sayers who doubted. India's long term outlook. The Tariff noise will go away in few weeks or months but Long term investors should look at buying and reshuffling the portfolios looking in tune with the tail winds.
Medium to short term supports and resistances for Nifty remain are as under:
With all this data coming in Support for Nifty remains at: 24334, 24032 (Mother line support of weekly chart), If this level is broken we may see Nifty falling temporarily towards 23318 or lower.
Resistances for Nifty remain at: 24644, 24868, 25260 (Key resistance level), 25442, 25660.
Disclaimer: The above information is provided for educational purpose, analysis and paper trading only. Please don't treat this as a buy or sell recommendation for the stock or index. The Techno-Funda analysis is based on data that is more than 3 months old. Supports and Resistances are determined by historic past peaks and Valley in the chart. Many other indicators and patterns like EMA, RSI, MACD, Volumes, Fibonacci, parallel channel etc. use historic data which is 3 months or older cyclical points. There is no guarantee they will work in future as markets are highly volatile and swings in prices are also due to macro and micro factors based on actions taken by the company as well as region and global events. Equity investment is subject to risks. I or my clients or family members might have positions in the stocks that we mention in our educational posts. We will not be responsible for any Profit or loss that may occur due to any financial decision taken based on any data provided in this message. Do consult your investment advisor before taking any financial decisions. Stop losses should be an important part of any investment in equity.
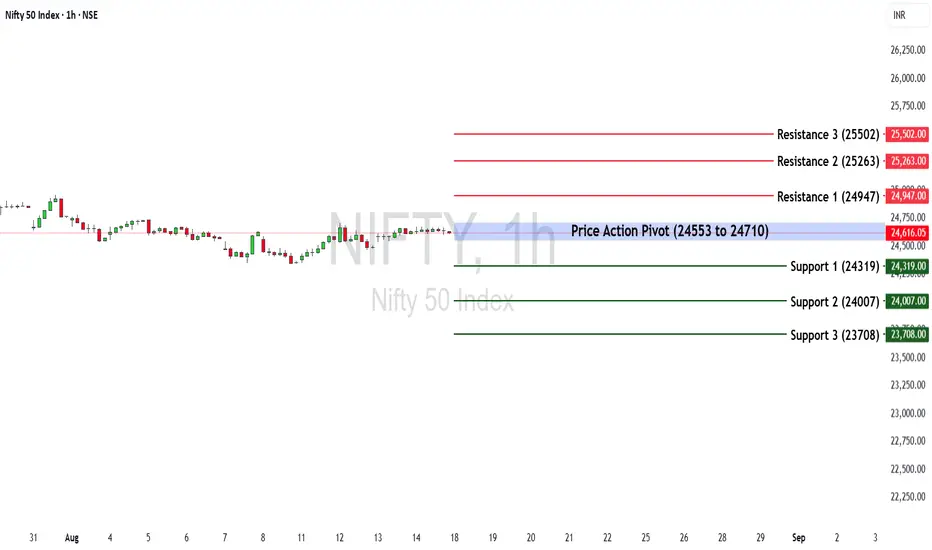
Nifty Weekly Outlook: Holding the Line or Breaking Below?The Nifty 50 ended the week at 24,631.30, gaining +1.10%.
🔹 Key Levels for the Upcoming Week
📌 Price Action Pivot Zone:
24,553 to 24,710 – This is the critical zone to watch. A decisive move beyond either side may dictate next week’s trend.
🔻 Support Levels
Support 1 (S1): 24,319
Support 2 (S2): 24,007
Support 3 (S3): 23,708
🔺 Resistance Levels
Resistance 1 (R1): 24,947
Resistance 2 (R2): 25,263
Resistance 3 (R3): 25,502
📈 Market Outlook
✅ Bullish Scenario:
If Nifty sustains above 24,710, buying momentum could build, aiming for R1 (24,947). A strong breakout above this may push prices towards R2 (25,263) and R3 (25,502).
❌ Bearish Scenario:
If the index breaks below 24,553, selling pressure may return. This could drag Nifty towards S1 (24,319), and further down to S2 (24,007) and S3 (23,708).
Disclaimer: lnkd.in
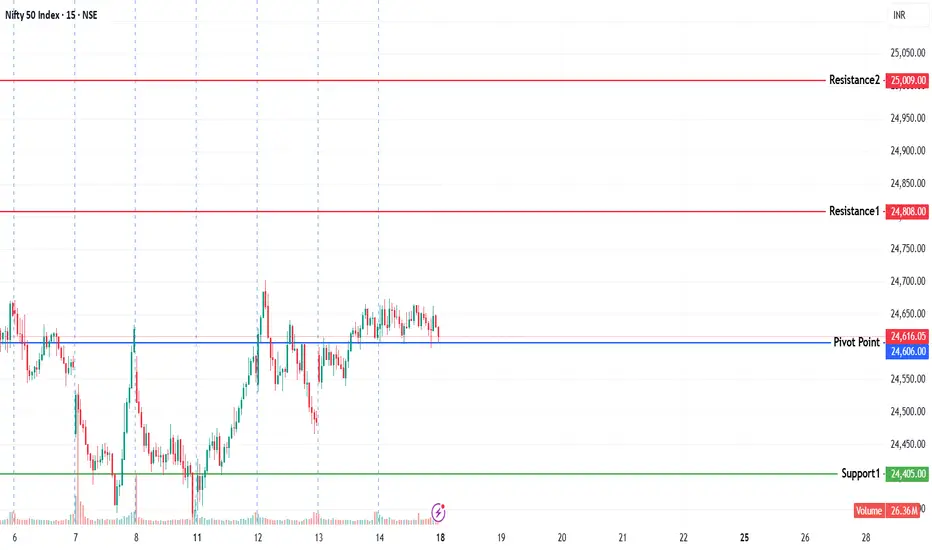
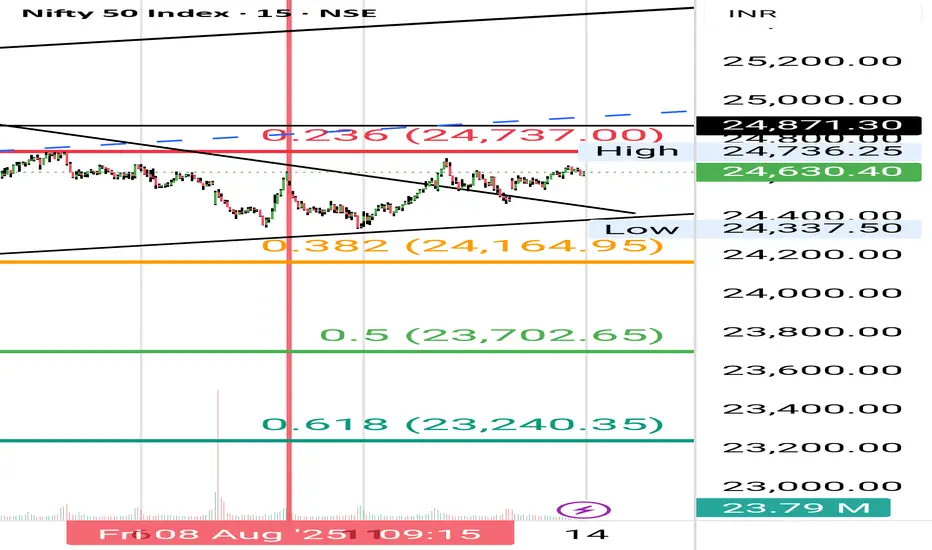
Nifty levels - Aug 18, 2025Nifty support and resistance levels are valuable tools for making informed trading decisions, specifically when combined with the analysis of 5-minute timeframe candlesticks and VWAP. By closely monitoring these levels and observing the price movements within this timeframe, traders can enhance the accuracy of their entry and exit points. It is important to bear in mind that support and resistance levels are not fixed, and they can change over time as market conditions evolve.
The dashed lines on the chart indicate the reaction levels, serving as additional points of significance to consider. Furthermore, take note of the response at the levels of the High, Low, and Close values from the day prior.
We hope you find this information beneficial in your trading endeavors.
* If you found the idea appealing, kindly tap the Boost icon located below the chart. We encourage you to share your thoughts and comments regarding it.
Wishing you success in your trading activities!

Poll Engagement StyleNifty is stuck in a tight 30-point range.
📈 Above 24,650 = bullish breakout?
📉 Below 24,620 = bearish breakdown?
What’s your call for today?

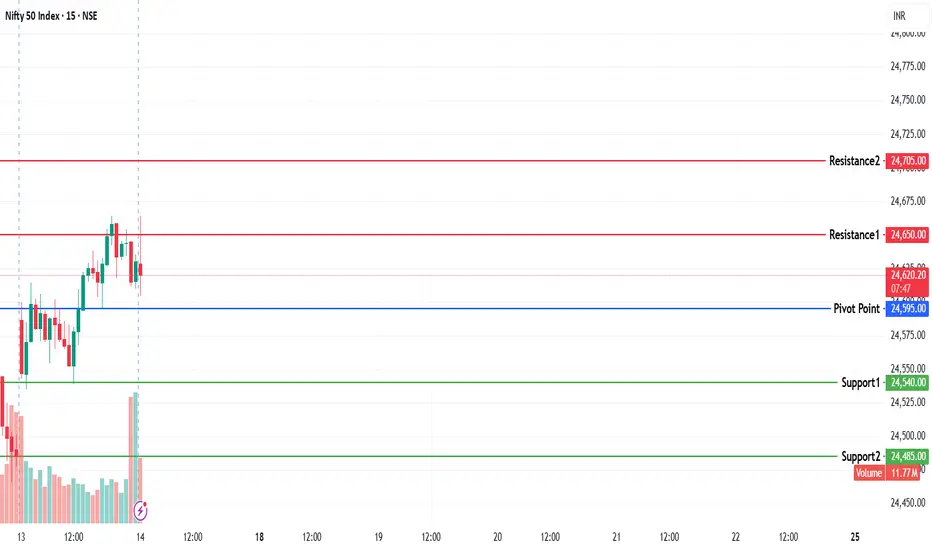
NIFTY KEY LEVELS FOR 14.08.2025NIFTY KEY LEVELS FOR 14.08.2025
If the candle stays above the pivot point, it is considered a bullish bias; if it remains below, it indicates a bearish bias. Price may reverse near Resistance 1 or Support 1. If it moves further, the next potential reversal zone is near Resistance 2 or Support 2. If these levels are also broken, we can expect the trend.
If the range(R2-S2) is narrow, the market may become volatile or trend strongly. If the range is wide, the market is more likely to remain sideways
📢 Disclaimer
I am not a SEBI-registered financial adviser.
The information, views, and ideas shared here are purely for educational and informational purposes only. They are not intended as investment advice or a recommendation to buy, sell, or hold any financial instruments.
Please consult with your SEBI-registered financial advisor before making any trading or investment decisions.
Trading and investing in the stock market involves risk, and you should do your own research and analysis. You are solely responsible for any decisions made based on this research.
"Nifty 50 Compression Zone: Breakout Setup Between 24,300–24,700The Nifty 50 is currently consolidating within a well-defined range of 24,300 (support) to 24,700 (resistance). This compression zone is backed by strong Open Interest clustering on both Call and Put sides, suggesting a potential breakout setup. My idea focuses on visualizing this range with floating entry labels, CE/PE overlays, and mutually exclusive signal logic to guide intraday decisions.
---
🔍 Technical Setup
| Parameter | Value / Observation |
|----------------------|------------------------------------------------|
| Support Zone | 24,300–24,400 |
| Resistance Zone | 24,700–24,740 |
| Daily RSI | Positive crossover, holding above 50 |
| Candlestick Signal | Inverted hammer + long upper shadows |
| OI Clustering | Highest Call & Put OI at 24,500 |
| EMA Structure | Price hovering near 10-day and 50-day EMA |
Bullish Breakout Plan
- Trigger: Sustained close above 24,740
- Target Zones: 24,900 → 25,200
- Entry Label: Floating CE overlay with momentum confirmation
- Stop-loss: Below 24,480
🔸 Bearish Breakdown Plan
- Trigger: Breach below 24,300
- Target Zones: 24,100 → 23,950
- Entry Label: PE overlay with RSI divergence confirmation
- Stop-loss: Above 24,450
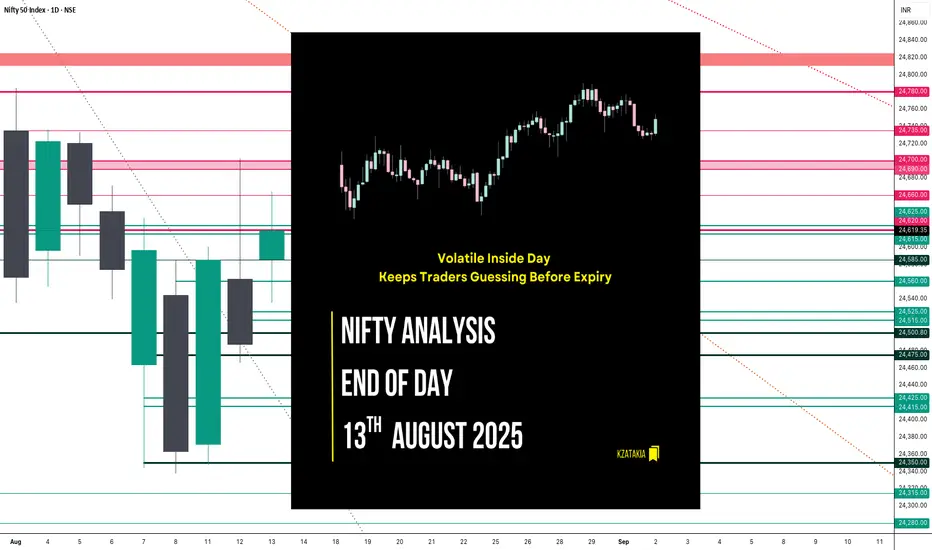
Nifty Analysis EOD – August 13, 2025 – Wednesday🟢 Nifty Analysis EOD – August 13, 2025 – Wednesday 🔴
Volatile Inside Day Keeps Traders Guessing Before Expiry
🗞 Nifty Summary
Nifty opened with a 102-point gap-up, driven by early bullish sentiment. However, the 24,600 zone acted as resistance right from the start, pushing prices down by 64 points to mark the day’s low at 24,535.25. Support emerged from the CPR zone, fueling a rebound that broke through 24,600 and set a new day high at 24,614.20, completing the Initial Balance (IB).
Once again, Nifty failed to sustain above 24,600, drifting between the IB range and VWAP. Around 12:40 PM, IB high was breached, but the index had to fight hard to stay above it. After an extended struggle to reach the previous day’s high, the index finally topped at 24,664.55, then retreated back toward the IB high before closing at 24,630.40.
Price action was highly volatile with no clear directional conviction, reflected in the long wicks on 5-minute candles. Structurally, the day remained balanced and inside the previous day’s range, forming an Inside Bar pattern on the daily chart — a setup known for potential breakout opportunities.
🛡 5 Min Intraday Chart with Levels
🎯 Tomorrow’s Game Plan
Tomorrow is weekly expiry, and my bias starts bullish:
💡 Bullish Plan:
If the market opens inside today’s range, I’ll wait for a breach and hold above 24,660 for long opportunities.
First hurdle: 24,700
Targets: 24,780 → 24,825 → 24,890
💡 Bearish Plan:
Not my primary view, but I’ll consider shorts if 24,525 ~ 24,515 breaks and sustains below.
First hurdle: 24,475 ~ 24,465
Targets: 24,425 → 24,350 → trail for deeper dips
📉 Daily Time Frame Chart with Intraday Levels
🕯 Daily Candle Breakdown
OHLC: Open 24,586.20 | High 24,664.55 | Low 24,535.25 | Close 24,619.35
Change: +131.95 (+0.54%)
Body: 33.15 points (small)
Upper Wick: 45.20 points
Lower Wick: 50.95 points
📌 Interpretation:
Small-bodied green Spinning Top → market hesitation despite a positive close.
Close above the midpoint hints at a mild recovery attempt.
Buyers need follow-through above 24,665 to build momentum; losing 24,535 could shift bias bearish.
📊 Short-Term View
Bias: Mildly bullish above 24,585
Support: 24,500 – 24,475
Resistance: 24,660 – 24,700
🛡 5 Min Intraday Chart
⚔ Gladiator Strategy Update
ATR: 212.98
IB Range: 78.95 → Medium
Market Structure: Balanced
Trade Highlight:
12:40 PM – Long Entry → SL Hit
📌 Support & Resistance Levels
📌 Resistance Zones:
24,660
24,690 ~ 24,700
24,735
24,780
📌 Support Zones:
24,585
24,560
24,525 ~ 24,515
24,500
24,475
💡 Final Thoughts
"Inside Bars before expiry can be like coiled springs — they can snap in either direction, and fast."
Patience in the morning and disciplined level play will be key tomorrow.
✏️ Disclaimer
This is my personal market view for educational purposes — not financial advice.
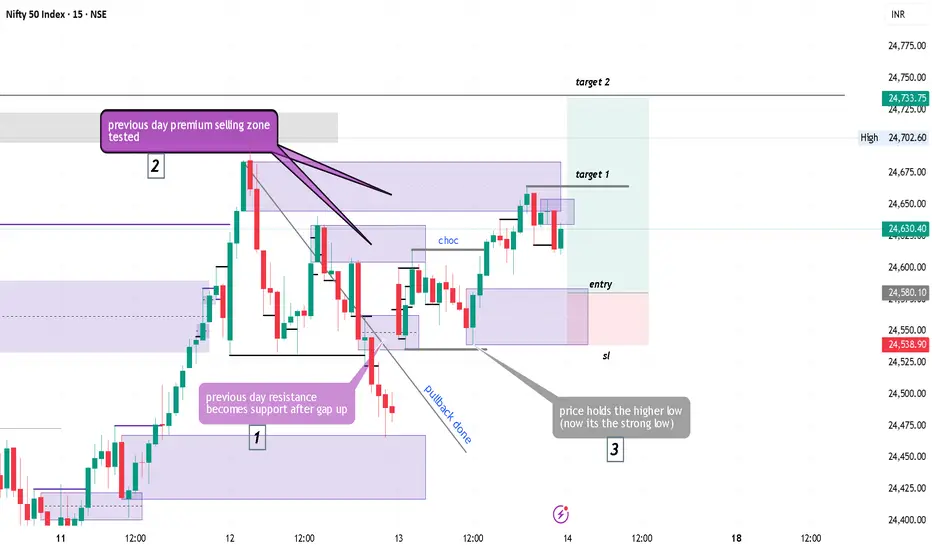
Nifty50 trade Technical Analysis for tomorrow (14 aug)As the market opened on 13 August, it gapped up above Resistance #1, directly entering the premium zone. The resistance, marked as (1), has now turned into support.
Following this, point (2) shows that the remaining supply zones were tested. However, the price did not break the day’s low of 24,538 and instead formed a swing structure favoring the long side. Based on this, our bias for tomorrow remains bullish.
Towards the close, the price tested the top supply zone on the 15-minute chart and showed signs of a pullback. This suggests that the price is likely to retrace into the new demand zone, which lies around the 24,583–24,538 area.
The strong low formed on 13 August is expected to hold. However, since the market is dynamic, it is best to wait for the price to enter the zone and reject bearish pressure before making any moves.
NIFTY -1H RSI Whispers, Market ListensPrice swept the sell-side liquidity before showing a bullish divergence on RSI.
A break above the descending trendline could trigger a rapid move toward the buy-side liquidity.
Setup suggests a classic trap-and-reversal scenario favoring the bulls.

Nifty levels - Aug 14, 2025Nifty support and resistance levels are valuable tools for making informed trading decisions, specifically when combined with the analysis of 5-minute timeframe candlesticks and VWAP. By closely monitoring these levels and observing the price movements within this timeframe, traders can enhance the accuracy of their entry and exit points. It is important to bear in mind that support and resistance levels are not fixed, and they can change over time as market conditions evolve.
The dashed lines on the chart indicate the reaction levels, serving as additional points of significance to consider. Furthermore, take note of the response at the levels of the High, Low, and Close values from the day prior.
We hope you find this information beneficial in your trading endeavors.
* If you found the idea appealing, kindly tap the Boost icon located below the chart. We encourage you to share your thoughts and comments regarding it.
Wishing you success in your trading activities!
