Nifty analysis On the weekly Nifty chart, the 40-week EMA is around 24,188, currently just ~175 points below the market at 24,363, with a bullish imbalance (FVG) sitting just above it; the last time Nifty dipped below this EMA was in Feb–Mar 2024, only ~1.35% (~300 points) under, before reversing from a confluence of a prior swing low, unfilled bullish FVG, and 50-week EMA support. If the EMA breaks now, the strongest support lies at 23,800–23,850, which is aligned with a March–April 2025 bullish order block and swing low. Given current macro conditions—U.S. tariffs on Indian exports, six straight weeks of FII selling, weak earnings, and geopolitical trade tensions—there’s about an 80% probability Nifty will test both the nearby FVG and EMA in weekly tf, the strongest resistances from the current price are 24,750–24,800 (recent lower high and bearish FVG, a near-term liquidity zone) and 25,050–25,100 (major swing high, start of last big sell-off, and 50% retracement of the recent drop), with the latter being the critical “supply wall” that would need to break to turn the weekly trend bullish again.
Trade ideas

I guess maybe nifty will form a double top in Monthly TF and canI guess maybe nifty will form a double top in Monthly TF and can come to blue Trendline like previous one it did.

Nifty is resting on support, likely to retrace from hereNifty is resting on support, likely to retrace from here. This fall is attributed to incresed US Tariff from 25 to 50 % to India

Nifty Analysis - WeeklyWith simple Monthly OHLC setup - Here is the Nifty's current support for the coming week.
23935 is the level where Sharks have laid their bet.
If 23935 falls for gaining support this time then the next level is at 22195 - 21965

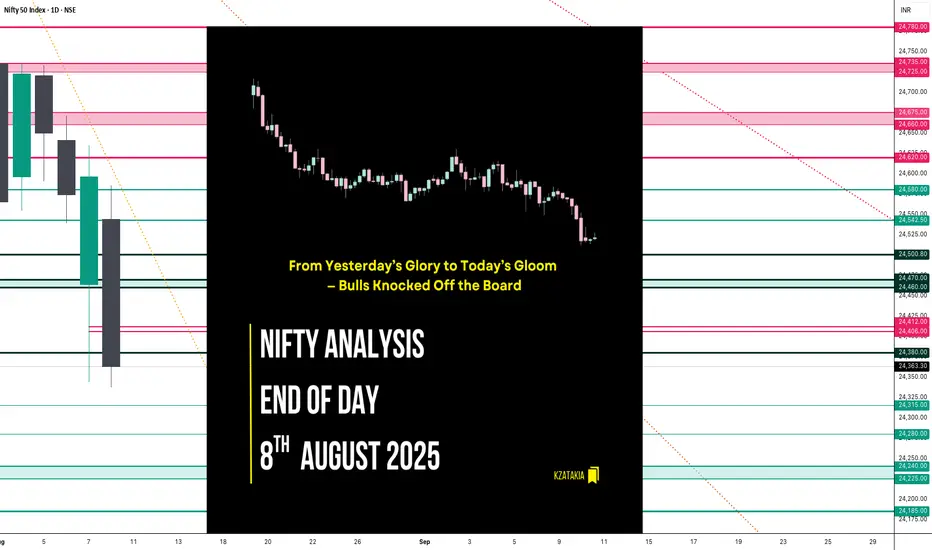
Nifty Analysis EOD – August 8, 2025 – Friday🟢 Nifty Analysis EOD – August 8, 2025 – Friday 🔴
From Yesterday’s Glory to Today’s Gloom — Bulls Knocked Off the Board
Today’s market was a textbook case of how quickly momentum can flip. Yesterday’s 289-point bullish surge was completely erased, with Nifty ending deep in the red and closing at the day’s low. Sellers clearly had the upper hand, leaving little room for bulls to breathe.
🗞 Nifty Summary
Friday opened with a 65-point gap-down — right below the crucial 24,580 support zone — and that level instantly showed rejection.
In the first 45 minutes, Nifty slipped 150 points from the day high and 200 points from the previous day high. The key Fibonacci retracement level from yesterday’s range — 24,406 ~ 24,412 — played the role of intraday savior multiple times, offering support and holding the market within a narrow zone for most of the day.
However, the bulls’ defense cracked after 3:00 PM. The support broke, triggering a sharp slide below 24,380 and even the Previous Day Low (PDL).
The upside was capped by 24,470 ~ 24,460, while 24,406 ~ 24,412 remained the battleground for most of the day until the breakdown.
In a single session, yesterday’s dramatic 289-point recovery rally was completely erased — with Nifty closing at the bottom of the PDL and CDL.
Today’s close is now below the low of 12th May, marking a 64-session (88-day) low.
Now the question for Monday: will bearish momentum extend, or will some positive news bring bulls back into play?
🛡 5 Min Intraday Chart with Levels
Intraday Walk
🔻 Gap-down open below major support at 24580.
⏳ First 45 minutes: Steep drop of 150 points from the day high.
🛡️ Fib support at 24406–24412 holds multiple times… until the late break.
🔻 Post 3 PM: Support collapse leads to fresh lows below PDL.
📉 Close near day’s low — erasing yesterday’s bullish rally.
📉 Daily Time Frame Chart with Intraday Levels
🕯 Daily Candle Breakdown
Open: 24,544.25
High: 24,585.50
Low: 24,337.50
Close: 24,363.30
Change: −232.85 (−0.95%)
Structure:
Real Body: 180.95 pts (Red Candle — Close < Open)
Upper Wick: 41.25 pts
Lower Wick: 25.80 pts
Interpretation:
Strong bearish sentiment — sellers maintained control from open to close.
Very small lower wick — indicates conviction from sellers in closing near the low.
Wiped out prior day’s gains — buyers have lost the short-term edge.
Candle Type:
Bearish Marubozu (near-full body) — signals decisive selling pressure, often a continuation pattern after weakness.
🛡 5 Min Intraday Chart
🥷 Gladiator Strategy Update
ATR: 210.45
IB Range: 134.05 → Medium
Market Structure: Balanced
Trade Summary:
10:35 AM – Short Entry → SL Hit
📌 What’s Next? / Bias Direction
Below 24,400: Bearish momentum likely to extend toward 24,250–24,200.
Above 24,470: Only a strong reclaim can shift bias back to neutral.
Gap-down/weak open on Monday may accelerate selling; bounce attempts will face resistance at 24,400–24,470.
🔍 Support & Resistance Levels
Resistance Zones:
24,406 ~ 24,412
24,460 ~ 24,470
24,500
24,580
Support Zones:
24,315
24,280
24,240 ~ 24,225
24,185
💬 Final Thoughts
"Markets don’t turn on hope — they turn on price. Respect the levels, and let price lead the story."
Bulls had the glory on Thursday, but Friday flipped the script completely. The market now sits at a multi-month low — momentum favors bears, but Monday’s open will decide if we see follow-through selling or a sharp dead-cat bounce.
✏️ Disclaimer
This is just my personal viewpoint. Always consult your financial advisor before taking any action.
Nifty levels - Aug 11, 2025Nifty support and resistance levels are valuable tools for making informed trading decisions, specifically when combined with the analysis of 5-minute timeframe candlesticks and VWAP. By closely monitoring these levels and observing the price movements within this timeframe, traders can enhance the accuracy of their entry and exit points. It is important to bear in mind that support and resistance levels are not fixed, and they can change over time as market conditions evolve.
The dashed lines on the chart indicate the reaction levels, serving as additional points of significance to consider. Furthermore, take note of the response at the levels of the High, Low, and Close values from the day prior.
We hope you find this information beneficial in your trading endeavors.
* If you found the idea appealing, kindly tap the Boost icon located below the chart. We encourage you to share your thoughts and comments regarding it.
Wishing you success in your trading activities!

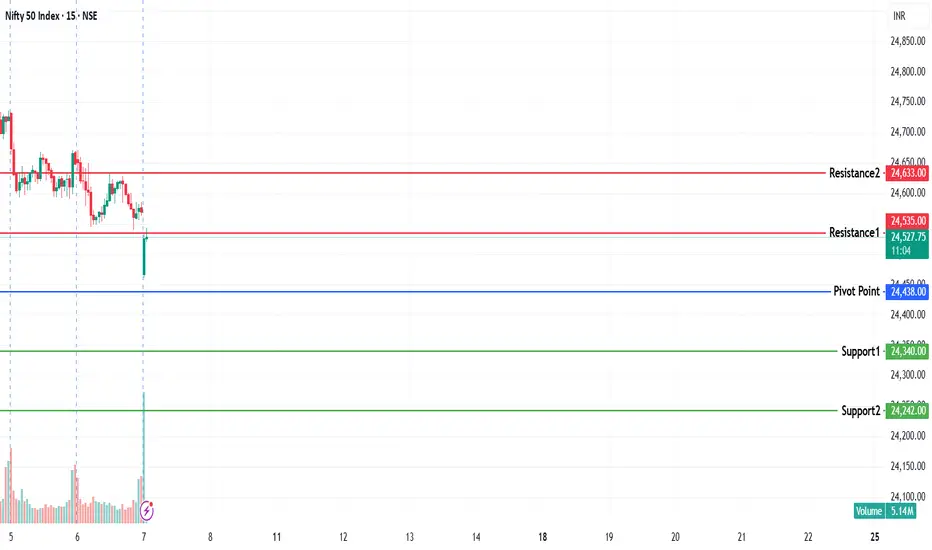
NIFTY KEY LEVELS FOR 08.08.2025NIFTY KEY LEVELS FOR 08.08.2025
Apologies for the delay in sharing this..
If the candle stays above the pivot point, it is considered a bullish bias; if it remains below, it indicates a bearish bias. Price may reverse near Resistance 1 or Support 1. If it moves further, the next potential reversal zone is near Resistance 2 or Support 2. If these levels are also broken, we can expect the trend.
If the range(R2-S2) is narrow, the market may become volatile or trend strongly. If the range is wide, the market is more likely to remain sideways
📢 Disclaimer
I am not a SEBI-registered financial adviser.
The information, views, and ideas shared here are purely for educational and informational purposes only. They are not intended as investment advice or a recommendation to buy, sell, or hold any financial instruments.
Please consult with your SEBI-registered financial advisor before making any trading or investment decisions.
Trading and investing in the stock market involves risk, and you should do your own research and analysis. You are solely responsible for any decisions made based on this research.
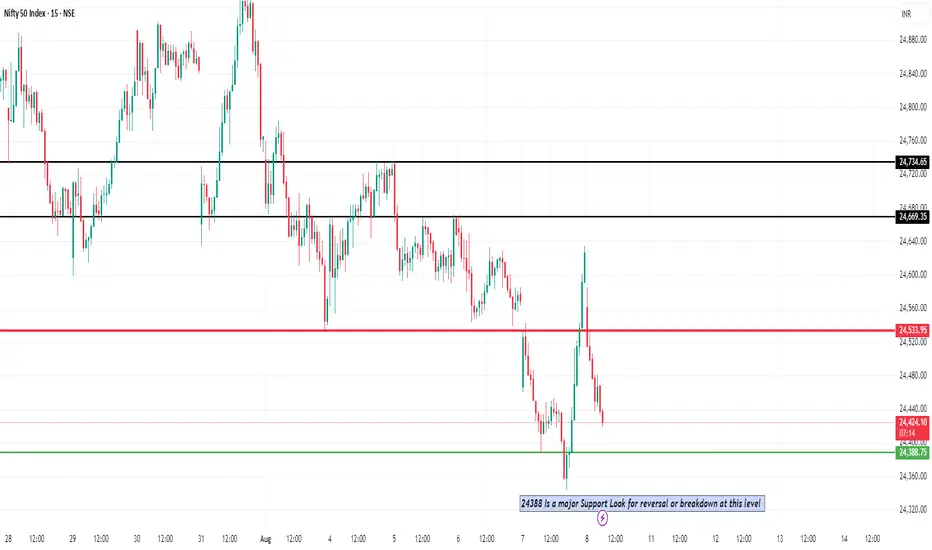
Nifty 50 Reversal / Breakdown ViewNifty 50 – Sharp Reversal from 24,388: What Really Happened Yesterday
Yesterday was a rollercoaster for the Nifty 50.
The day started on a sour note after news broke that the U.S. had slapped another 25% tariff on Indian exports, effectively doubling the total to 50%. The sentiment hit the floor right at the open, and we saw the index tumble to 24,388, marking a fresh three-month low.
But just when it looked like the selling would spiral, the market staged a dramatic turnaround. Strong buying — especially in the derivatives segment — kicked in during the second half. By the closing bell, Nifty had clawed its way back into the green, ending around 24,596. It wasn’t just a bounce; it felt like the bulls wanted to send a message: we’re still here.
Key Levels in Play
That 24,388 mark isn’t random. It lined up perfectly with a key support zone on the charts — one that also overlapped with short-term fair value gaps and EMA zones on the 15-minute chart. In other words, it was a prime area for a potential reaction.
Once the index got back above 24,450, buyers clearly had the upper hand. Now, 24,800 is the next hurdle. A strong break and hold above that could open the door for a test of 25,000. On the flip side, if we slip back under 24,450, we could be right back under pressure, staring at the 24,300–24,400 range again.
The Bigger Picture
Foreign flows: Global sentiment took a hit — foreign investors sold over ₹49,000 crore worth of equities yesterday, adding to the nervousness.
Sector moves: IT and pharma were the big drags early on, erasing some of their recent gains.
Domestic support: Local investors kept the faith, pumping in over ₹1 lakh crore — the strongest domestic inflows in four months — which likely helped cushion the fall.
Takeaway
Yesterday’s reversal wasn’t luck. It was a combination of technical support holding, aggressive short-covering, and steady domestic buying stepping in when the global mood was sour.
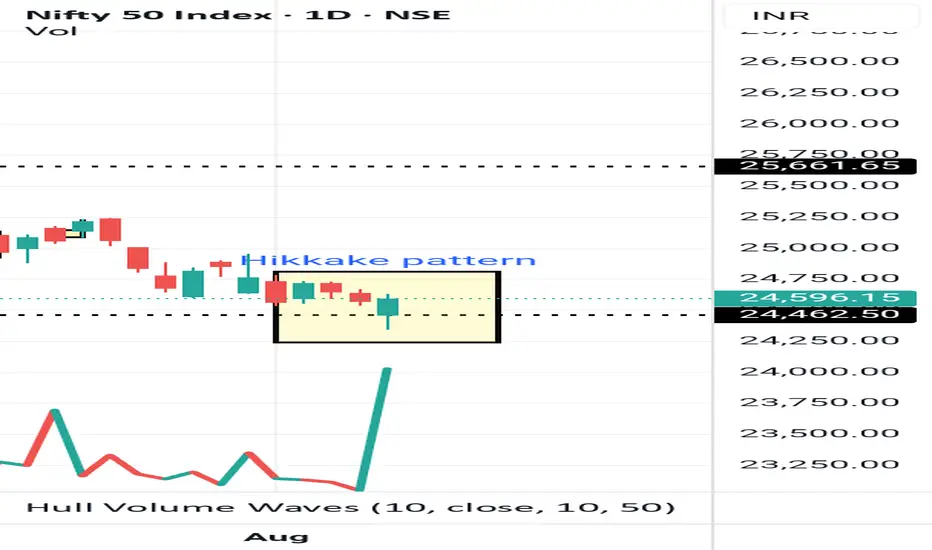
Nifty hikkake pattern.Nifty 24596 has given an excellent example for hikkake pattern to trap call writers.
Nifty 50's Elliott Wave Analysis & Price ProjectionHey, so let's take a look at this chart of the Nifty 50. where the market might be heading. Just a heads-up, this is all for learning, not for making actual financial decisions. Think of it more like a potential roadmap than a guaranteed outcome.
From what I can see, the chart is laying out a classic five-wave pattern.
* Wave 1: The first big push up was in the latter half of 2022 into early 2023. It was the start of the uptrend.
* Wave 2: After that, the market pulled back a bit—a healthy correction, really—in the middle of 2023. It didn't drop below the starting point of the first wave, which is exactly what you'd expect.
* Wave 3: This was the huge run-up that we saw from mid-2023 all the way into early 2024. That's typically the strongest and longest part of the move. The chart marks it with a "(b)" which suggests it's part of a bigger picture, but for now, we can see it as the big third wave.
* Wave 4: Now, we're in the middle of a correction, a kind of zigzag, that started after that massive run-up. The chart shows it finding a bottom around mid-2025. It's like the market is taking a breather before the final push.
* Wave 5: And this is where it gets interesting. The chart is forecasting the final leg up, starting from this mid-2025 low. It's suggesting we could see a big rally, with the Nifty potentially hitting targets around 28,000 and even above 30,000 by late 2026 or 2027.
Basically, the chart is saying we've gone up, corrected, gone up big, and now we're in a smaller correction, getting ready for one last big move to the upside.
Again, this is just one way of looking at the market. No one has a crystal ball, and a ton of other things—like news, company earnings, and what's happening around the world—could change this forecast completely. So, always do your own homework and talk to a pro before you invest your hard-earned money.
This forecast report is for educational purposes only and should not be considered financial advice. Market analysis, especially projections based on technical indicators like Elliott Wave theory, is speculative and does not guarantee future results. Always conduct your own research and consult with a financial professional before making any investment decisions.

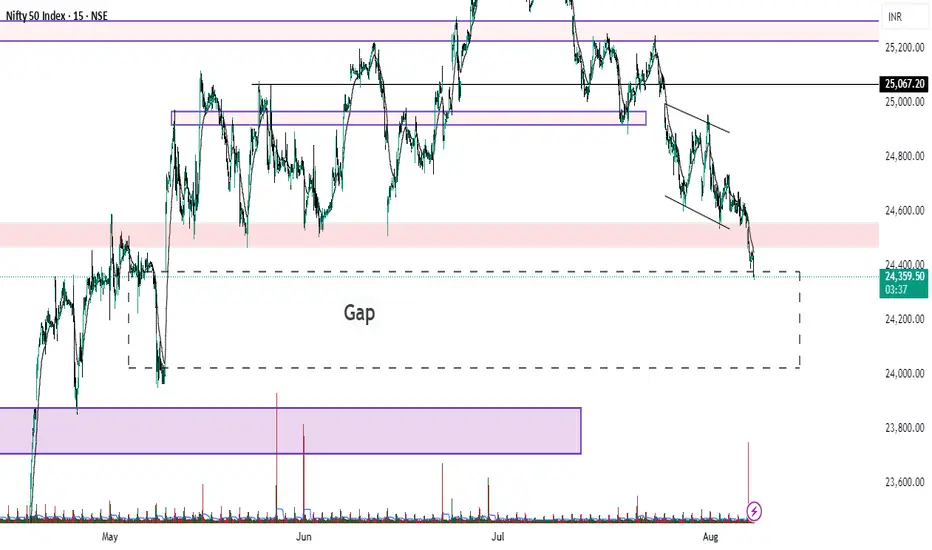
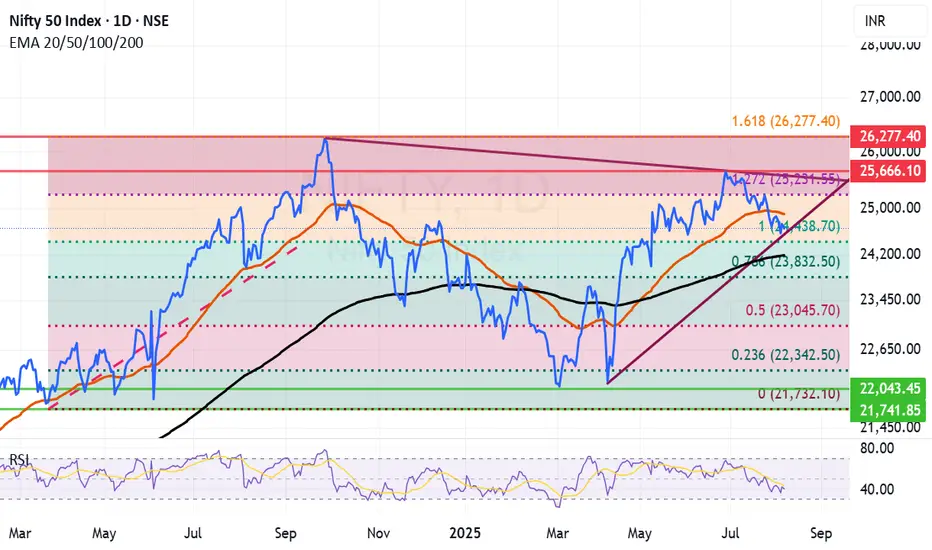
important Fibonacci retracement level approaching for NiftyVery important fibonacci retracement level for Nifty is arriving with ever increasing Trump tantrum and Indian defiance to toe US and EU line on Russian Crude and other trade practises. Market looks delicately placed at this juncture as investors fear that action from the West would undermine Indian growth story. The current fall can be utilized for shifting the balance of the portfolio towards goods that will be 100% made in India and will be consumed in India. For long term investors the current fall can be used to accumulate long term investment ideas with a horizon of 2 to 3 years.
Supports for Nifty remain at: 24438 (Important Fibonacci support), 24190 (Father line support, closing below this will enable bears to pull down Nifty towards next supports), 23832 (Next Fibonacci support), 23045 (Major Fibonacci support).
Resistance for Nifty remain at: 24896 (Mother Line Support), 25231 (Next Fibonacci resistance. A closing above this level will enable bulls to pull Nifty towards next trend line resistance), 25666 (Next Trend line resistance).
Disclaimer: The above information is provided for educational purpose, analysis and paper trading only. Please don't treat this as a buy or sell recommendation for the stock or index. The Techno-Funda analysis is based on data that is more than 3 months old. Supports and Resistances are determined by historic past peaks and Valley in the chart. Many other indicators and patterns like EMA, RSI, MACD, Volumes, Fibonacci, parallel channel etc. use historic data which is 3 months or older cyclical points. There is no guarantee they will work in future as markets are highly volatile and swings in prices are also due to macro and micro factors based on actions taken by the company as well as region and global events. Equity investment is subject to risks. I or my clients or family members might have positions in the stocks that we mention in our educational posts. We will not be responsible for any Profit or loss that may occur due to any financial decision taken based on any data provided in this message. Do consult your investment advisor before taking any financial decisions. Stop losses should be an important part of any investment in equity.
Nifty trend directionNifty 24596 has closed well gai ed the support. 24468.Volume burst suggest covering. Indicator is negatively diverged.fii's have sold contracts and pushed price high by selling derivatives.we expect nifty will face resistance at 24770 to 24855

Nifty is bullish but the concern is...Total Volume and closing were strong today — that’s a good sign.
But the only concern is that sellers' volume was 218 million more than buyers. That’s a big gap and something we can’t ignore.
NSE:NIFTY Pivot is at 24,524, and Pivot Percentile is 0.29% — that’s slightly high, so expect volatility.
If Nifty opens with a gap down and then sustains above the Pivot for 1 hour, we might see a good upside, and it would be worth chasing.
A gap-up open won’t be ideal — a controlled open near the pivot is better.
Apart from sellers’ volume, everything else looks bullish.
Even the options data is pointing toward a move up, with a target zone near 24,800.
So, my view for tomorrow is cautiously bullish.
NSE:BANKNIFTY is looking much stronger than Nifty.
This time, the rally might be led by NSE:CNXPSUBANK .
- Support: 55,294
- Resistance: 55,650
If BankNifty moves, chances are Nifty will follow as well.
Top Sectors to Watch:
NSE:CNXIT
NSE:CNXPHARMA
If you remember, I had mentioned earlier — this time when the market starts bouncing back from the bottom, IT sector will be the first to run.
That’s all for today.
Plan your trade and Trade your plan.
Take care. Have a profitable tomorrow.
Nifty Analysis EOD – August 7, 2025 – Thursday🟢 Nifty Analysis EOD – August 7, 2025 – Thursday 🔴
A Trap, a Reversal, and a Breathless Rally — Did You Catch It?
🗞 Nifty Summary
Today was expected to be volatile, but few were prepared for how wildly Nifty behaved.
After a gap-down of 110 points on the back of negative global cues, Nifty immediately started filling the gap and reached the Previous Day Low (PDL). However, strong rejection at PDL sent prices tumbling — slicing below the Open, IB Low, and even the Current Day Low, marking a sharp low at 24,387.
Then came the bear trap.
A brief breakdown to 24,344.15 looked like a breakdown, but instead triggered a sharp liquidity grab, launching a vertical move upward. From that bottom, Nifty surged in a breathtaking rally — not a single 5-min candle broke its previous candle’s low, signaling relentless buying. Almost every resistance zone — Swing High, VWAP, PDL/S1, CPR, Weekly Low — got taken out in one single breath.
Did you ride it?
Honestly — I didn’t. I was frozen watching this dramatic reversal unfold.
Still, today’s super recovery puts the index back within its known range. Now, bulls need a close above 24,660–24,675 to confirm momentum.
📉 Intraday 5 Min Chart Overview
🧭 Intraday Price Action Flow
9:15 AM: Opens 110 points down at 24,467.10
9:15–10:30 AM: Recovers swiftly to PDL, but fails there.
10:25 AM – 11:05 PM: Sharp fall — breaches CDL & IB Low → makes new day low at 24,387
1:20 PM Onwards: Attempts consolidation; false breakdown at 24,344.15
2:00 PM – 3:30 PM: Monster rally → No candle breaks prior low; bulls dominate to close at 24,626.65
📉 Daily Time Frame Chart with Intraday Levels
🕯 Daily Candle Breakdown
Open: 24,464.20
High: 24,634.20
Low: 24,344.15
Close: 24,596.15
Change: +21.95 (+0.09%)
🔍 Candle Structure:
Real Body: Green → +131.95 pts
Upper Wick: 38.05 pts
Lower Wick: 120.05 pts
🧠 Interpretation:
Strong rejection from intraday lows near 24,344
Long lower wick shows dip buying strength
Closed near the highs = bulls dominated the end
Still within larger range → needs breakout above 24,675 for follow-through
🔥 Candle Type:
A bullish recovery candle, hammer-like, but within a sideways structure — shows aggressive buying near important demand zone (24,340–24,380).
📈 Updated Short-Term View – 7th August 2025
Support Zone: 24,340 – 24,380
Resistance Zone: 24,620 – 24,675
Bias: Neutral with a bullish tilt, unless 24,340 breaks decisively.
🎯 Trading Insight
A close above 24,660–24,675 may lead to further upside — possibly testing 24,735–24,780
Failure to hold above 24,460 will shift bias back to bearish
🛡 5 Min Intraday Chart
🥷 Gladiator Strategy Update
ATR: 205.09
IB Range: 82.85 → Medium
Market Structure: ImBalanced
⚔️ Trade Summary:
🕙 10:25 AM – Short Entry → Trail SL Hit (R:R = 1:1.8)
🧱 Support & Resistance Levels
🔼 Resistance Zones:
24,620
24,660 ~ 24,675
24,725 ~ 24,735
24,780 ~ 24,795
24,860 ~ 24,880
🔽 Support Zones:
24,542 ~ 24,535
24,500
24,470 ~ 24,460
24,380 ~ 24,344
💬 Final Thoughts
"Markets reward patience and punish rigidity."
Today was a masterclass in trap-reversal-breakout structure. While many were either trapped or missed the move, this type of price action reminds us — be ready, but never rigid.
Now all eyes on 24,675 — can bulls push above it and sustain?
✏️ Disclaimer:
This analysis reflects personal views and is not trading advice. Please consult your financial advisor before making decisions.

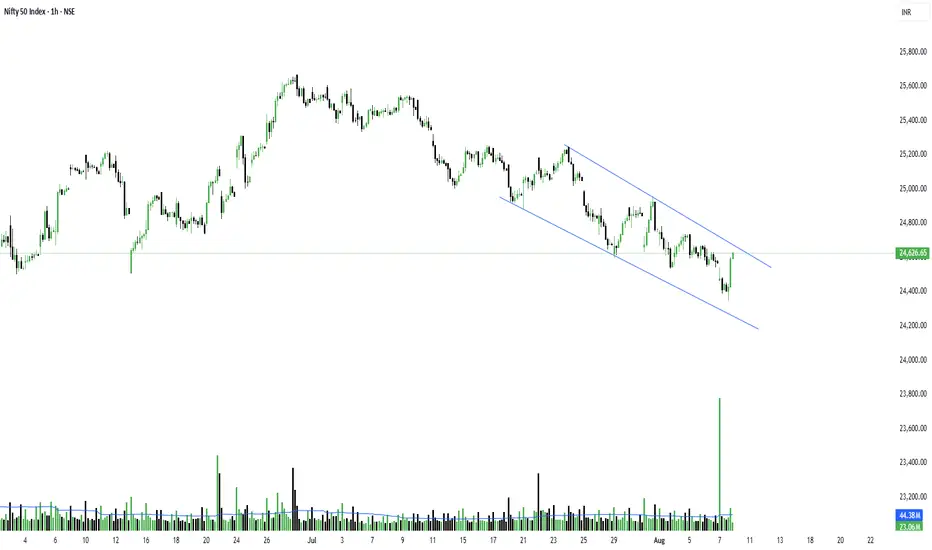
Nifty bounce from Anchored VWAPAfter sharp correction nifty finally bounce from Anchored Vwap support if hold this level probability high to outperform .

"Nifty Is Developing a New Trend""The index needs to test the 24450-24500 range again to regain positivity, as these levels are expected to act as key support. Once these levels are tested and hold as support, it could be a good opportunity to play swing long positions in the market."

The Nifty is currently developing a new trend"The index needs to test the 24450-24500 range again to regain positivity, with these levels expected to act as key support. A successful test of this support zone could present an opportunity for swing long positions."

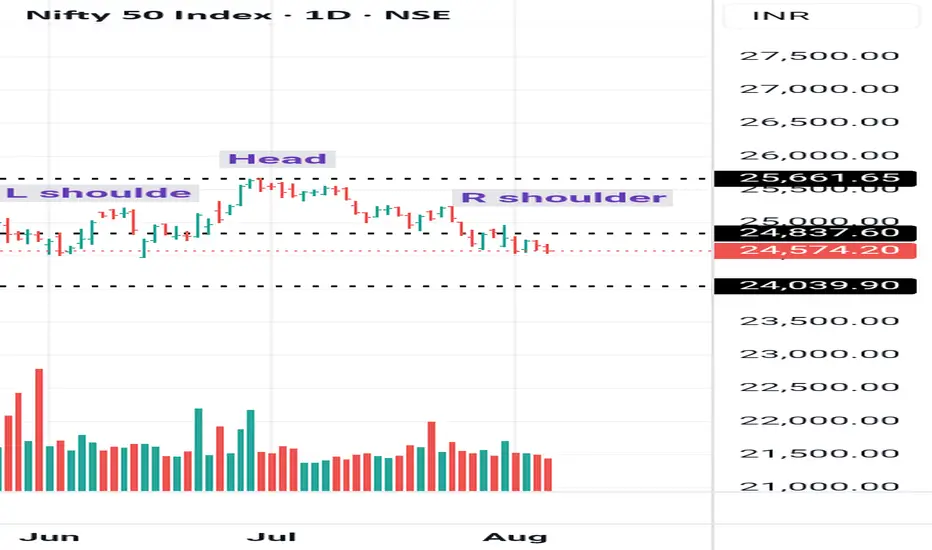
Nifty breakdown of HS patternNifty 24570 has broken down of H S pattern.technical target 24080.indicator is negatively diverged.volume falls with price.fii's have sold contracts and negetive in derivatives.we expect nifty will move down further with resistance at 24837
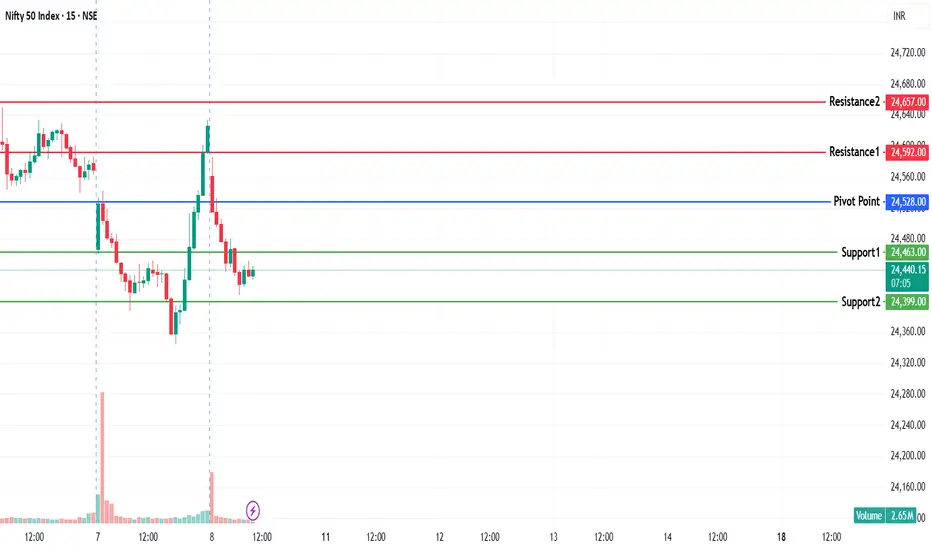
Nifty levels - Aug 08, 2025Nifty support and resistance levels are valuable tools for making informed trading decisions, specifically when combined with the analysis of 5-minute timeframe candlesticks and VWAP. By closely monitoring these levels and observing the price movements within this timeframe, traders can enhance the accuracy of their entry and exit points. It is important to bear in mind that support and resistance levels are not fixed, and they can change over time as market conditions evolve.
The dashed lines on the chart indicate the reaction levels, serving as additional points of significance to consider. Furthermore, take note of the response at the levels of the High, Low, and Close values from the day prior.
We hope you find this information beneficial in your trading endeavors.
* If you found the idea appealing, kindly tap the Boost icon located below the chart. We encourage you to share your thoughts and comments regarding it.

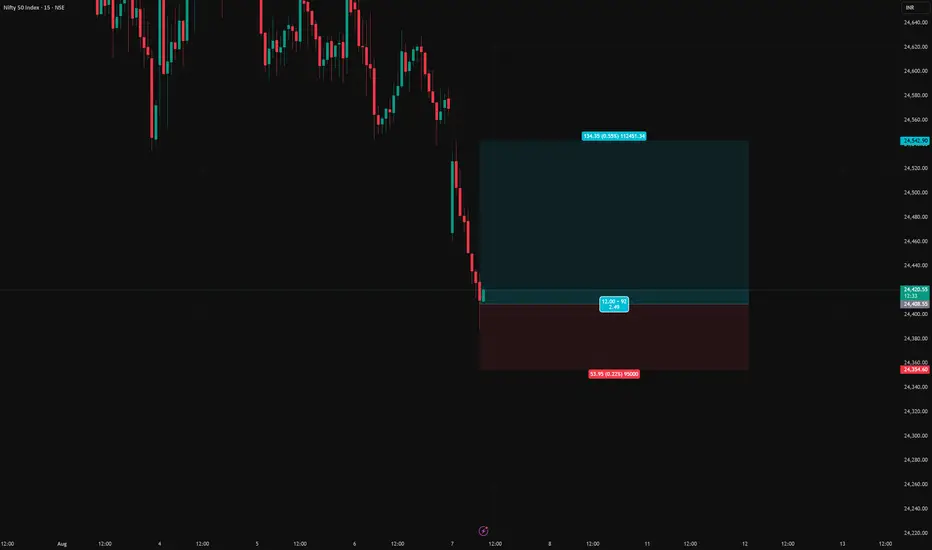
NIFTY long setupNifty long setup
Entry price - 24408.55
Stop loss - 24354.60
Target - 24542.90
Risk Reward - 1:2.5
Nifty !!Nifty at the deciding point. I cannot write my view but some people will get an idea what I am talking about.

NIFTY KEY LEVELS FOR 07.08.2025NIFTY KEY LEVELS FOR 07.08.2025
If the candle stays above the pivot point, it is considered a bullish bias; if it remains below, it indicates a bearish bias. Price may reverse near Resistance 1 or Support 1. If it moves further, the next potential reversal zone is near Resistance 2 or Support 2. If these levels are also broken, we can expect the trend.
If the range(R2-S2) is narrow, the market may become volatile or trend strongly. If the range is wide, the market is more likely to remain sideways
📢 Disclaimer
I am not a SEBI-registered financial adviser.
The information, views, and ideas shared here are purely for educational and informational purposes only. They are not intended as investment advice or a recommendation to buy, sell, or hold any financial instruments.
Please consult with your SEBI-registered financial advisor before making any trading or investment decisions.
Trading and investing in the stock market involves risk, and you should do your own research and analysis. You are solely responsible for any decisions made based on this research.