Nifty near strong support level 📊 Nifty Chart Update!
Nifty is now trading near a strong support level 🛑
Watch closely for a possible reversal or bounce from this zone! 🔄📈
Trade ideas

Time to be cautious Nifty is at make or break levels, Be careful about general market trends before jump into any new trades.
Long Term Nifty Analysis.(With Economic Commentary). We saw phenomenal resistance by Indian markets today after the Tariff announcements. Nifty bounced back and at one point was 330 points above low of the day. However there was Profit booking and selling on bounce due to prevailing Tariff uncertainties and Nifty came of the peak to close at 24768. Even after losing a lot of ground which it gained it ended up 133 points from the low of the day. Nifty ended the day in the negative losing 87.6 points from yesterday's close. This was much better than estimation of many experts. We might not be out of the woods yet but nevertheless fight back was phenomenal.
Now coming to Tariffs. I am not an expert in economy but let us assume the worst case scenario that trade negotiations fail and this is the tariff stays at 25% + Penalty. Again assuming that we loose 50% of our exports to US due to this decision. Say tariff would apply to 50b worth goods exported by us to USA and we 25b worth business. The impact on GDP will be as under.
GDP Impact = 25b/3.7T= 0.0067 = 0.67% of our GDP will be shaved off..(Rough Estimate). So say our is say 6.5. Then we continue to grow at 5.9 or 5.8. (Again I am not an expert and this estimate is based on a lot of assumption). This loss of GDP can be covered by increasing local consumption or exploring other market. Enhancing ties with markets outside USA. Thus it is not something which is going to kill Indian markets. We survived 1991, We survived Covid, We survived, Ukraine - Russia war, Israel-Iran conflict, Operation Sindoor Lows so we will survive this too and continue thriving. India is destined to become 3rd Largest Economy and unless there are local / internal political mishaps or mess-ups our growth will continue.
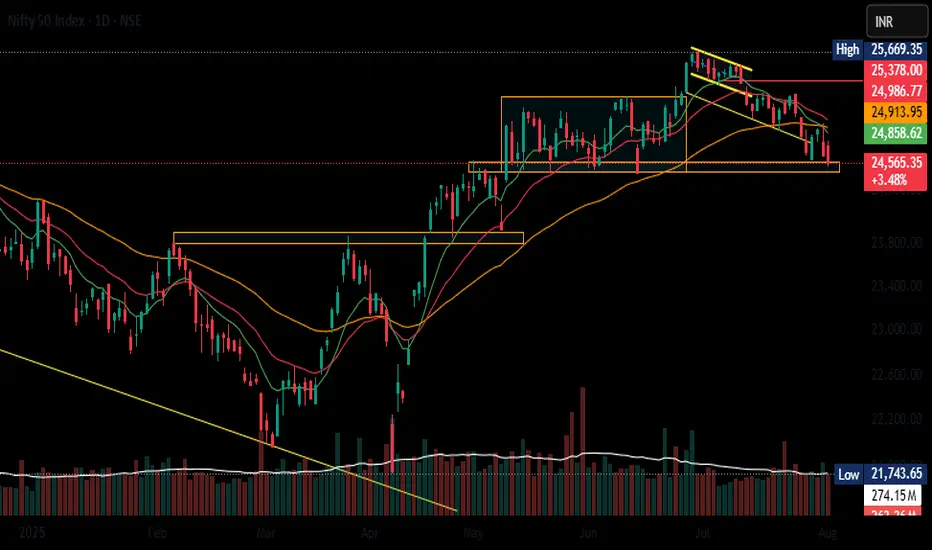
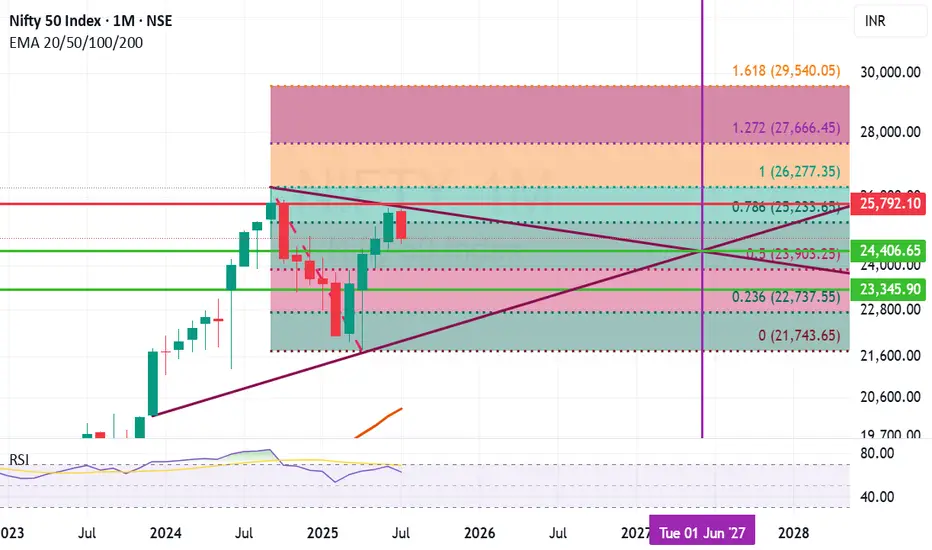
Fibonacci retracement of Nifty ant trend line analysis suggests few important support and resistance levels. The Horizontal line in the chart here suggests the cut off date. The chart suggests that:
Important Supports for Nifty remain at: 24406 (Mid Trend Support), 23903 (Important Fibonacci Support), 23345 (Important Candle support), (Below 23345 Nifty becomes very week and we will be in Bear grip where bears can drag Nifty down to 22737 or even 21742 in unlikely circumstances).
Important Resistance Levels: 25233 (Important Fibonacci resistance), 25792 (Important Candle resistance), 26277 (Previous All Time high), In the long term we might reach 27666 or even 29540 in close to 24 months time.
Conclusion:
Scenario 1) Indian Growth story continues and business thrive the optimistic range for Nifty by June 2027 seems to be the range between 26277 to 29540 or above.
Scenario 2) Indian economy faces changes and internal / external issues hamper progress the pessimistic range for Nifty by June 2027 seems to be anywhere between 23090 to 26277.
Scenario 3) Local or Global catastrophic events unfurl. Global and Indian economy takes a hit (Long drawn wars or local political leadership changes, Covid like events etc.) during this time frame 23090 to 21743 or below..(This does not seem likely but you never say never).
Disclaimer: The above information is provided for educational purpose, analysis and paper trading only. Please don't treat this as a buy or sell recommendation for the stock or index. The Techno-Funda analysis is based on data that is more than 3 months old. Supports and Resistances are determined by historic past peaks and Valley in the chart. Many other indicators and patterns like EMA, RSI, MACD, Volumes, Fibonacci, parallel channel etc. use historic data which is 3 months or older cyclical points. There is no guarantee they will work in future as markets are highly volatile and swings in prices are also due to macro and micro factors based on actions taken by the company as well as region and global events. Equity investment is subject to risks. I or my clients or family members might have positions in the stocks that we mention in our educational posts. We will not be responsible for any Profit or loss that may occur due to any financial decision taken based on any data provided in this message. Do consult your investment advisor before taking any financial decisions. Stop losses should be an important part of any investment in equity.
#Nifty - Pivot Point: 25031.63Date: 18-07-2025
#Nifty Current Price: 25025
Pivot Point: 25031.63 Support: 24794.06 Resistance: 25270.32
#NiftyUpside Targets:
Target 1: 25376.92
Target 2: 25483.53
Target 3: 25652.99
Target 4: 25822.45
#NiftyDownside Targets:
Target 1: 24686.89
Target 2: 24579.73
Target 3: 24410.26
Target 4: 24240.80
#TradingView #Stocks #Equities #StockMarket #Investing #Trading #Nifty
#TechnicalAnalysis #StockCharts #Finance

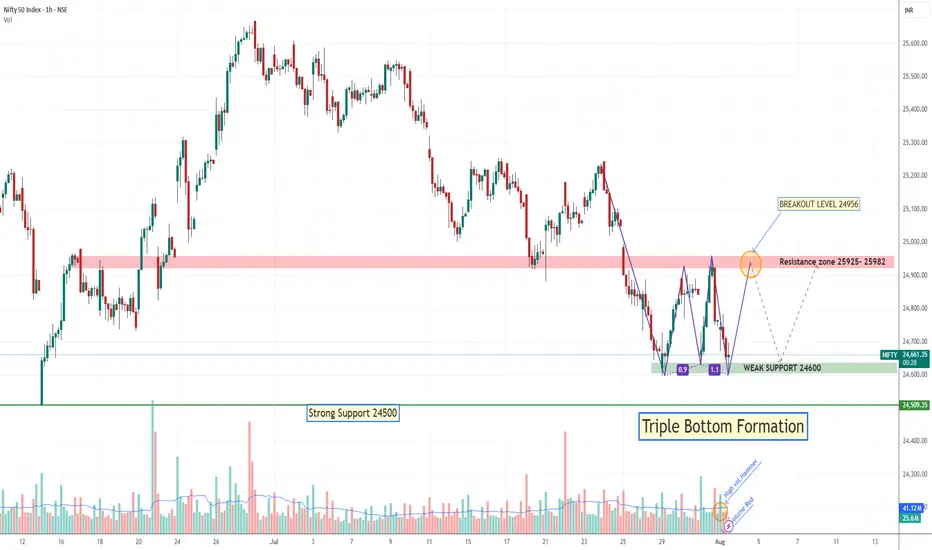
Tripple Bottom Formation if Hold 24600Nifty 3rd Time Tested 24600 level if it Break next Strong support 24500, if hold then may rallied again till 24956. May be Falling red candle is just testing candle of High-volume Hammer.
#Nifty directions and levels for August 1st:Good morning, friends! 🌞
Here are the market directions and levels for August 1st:
The global market (based on the Dow Jones) has shown a moderately bearish sentiment,
while the local market continues to display a bearish tone.
Today, Gift Nifty indicates a neutral opening.
What can we expect today?
In the previous session, both Nifty and Bank Nifty experienced high volatility.
However, the closing happened around the middle of the current swing, indicating a possible range-bound market. Until this range is broken, we cannot expect a strong directional move.
If the range breaks, we can follow the breakout direction.
In my side, the structures of Nifty and Bank Nifty appear slightly different. Nifty continues to show bearish sentiment, whereas Bank Nifty is showing signs of a mild bounce back. So, they may counterbalance each other, and if that happens, we may see a neutral closing by the end of the day.
On the other hand, if the market breaks immediate support or resistance with a solid candle or after consolidation, we can expect a directional move in that breakout direction.

nifty 01/08/2025I am not SEBI Registered analyst. this is for education purpose only. this is only my view. please do own research before innate a trade or making investment plan. technical analysis are probability only.

Nifty 50 analysis I have done my nifty analysis as we enter august month expiry. July has been a volatile month with 5 week and corporate results.

In addition to previous positional trade with targetThis are no buy sell recommendation but sharing for learning purpose only.
#NIFTY August 1st view#NIFTY August 1 st View : NSE:NIFTY Currently doing wave 3, and around buying zone, lets add up Nifty future and Nse Stocks for fresh high from Aprils low

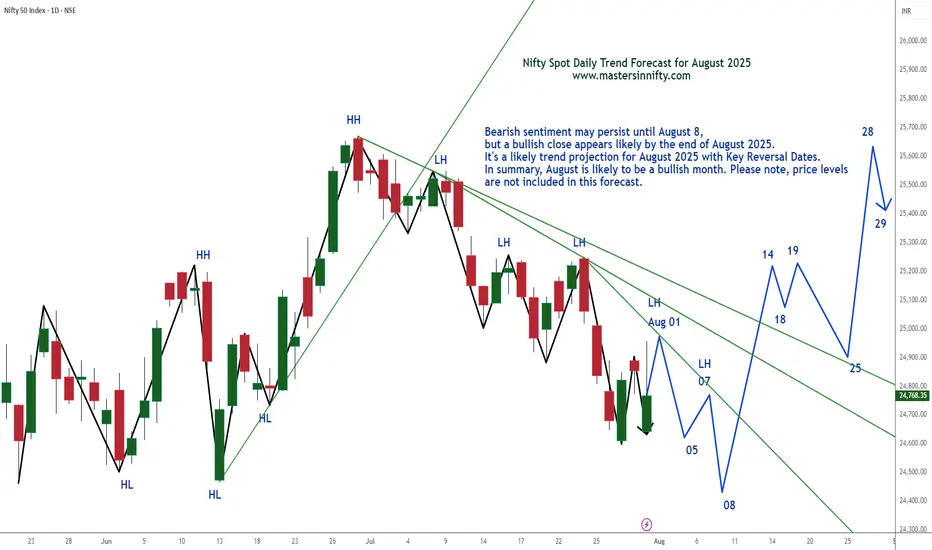
Nifty Spot Index Projection Line for August 2025Bearish sentiment may persist until August 8, but a bullish close appears likely by the end of August 2025.
It's a likely trend projection for August 2025 with Key Reversal Dates. In summary, August is likely to be a bullish month. Please note, price levels are not included in this forecast.
Traders are suggested to conduct own technical studies before entering into the trades and proper risk management is a must.
This is just my personal view.
Best of Luck & Happy Trading.
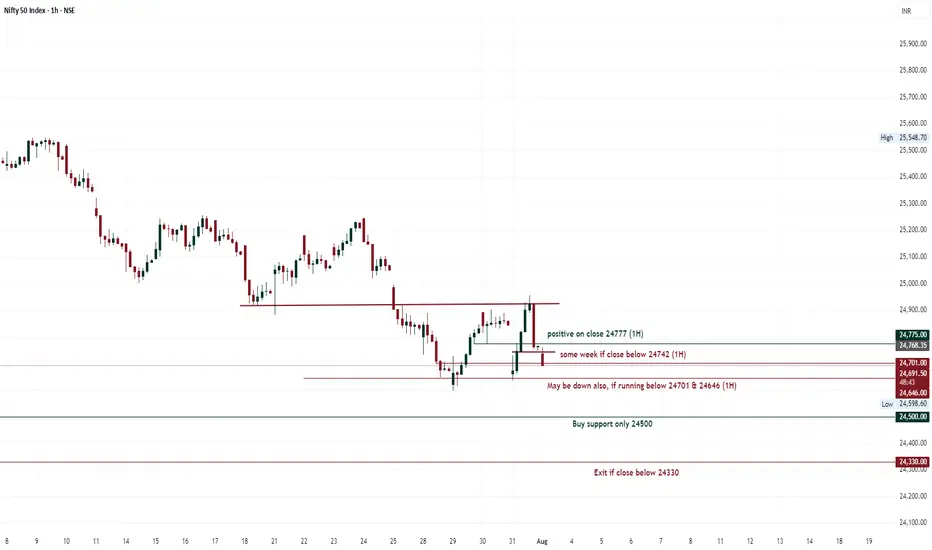
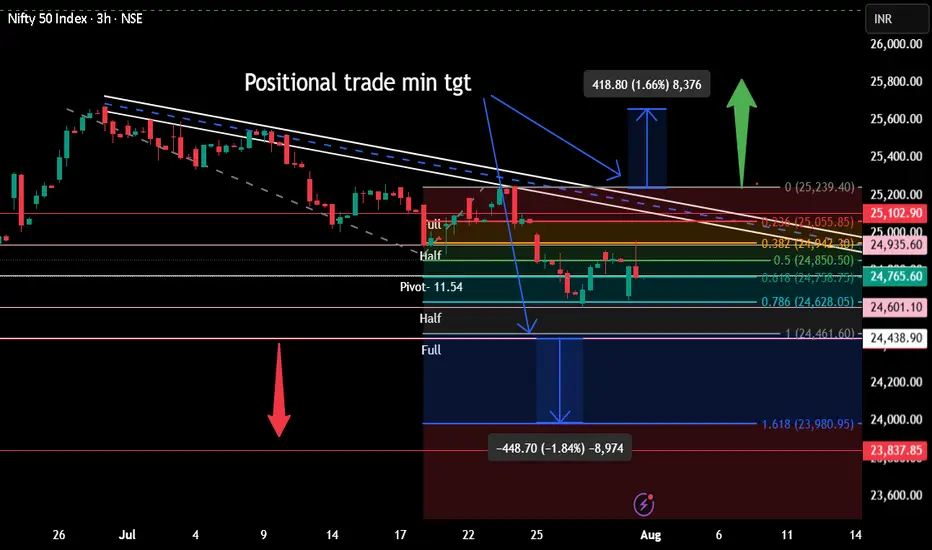
Positional tradeAt present market is for scalper/intraday trader. Positional trade to be done only once,
1. 24438 is crossed on day closing basis. Bearish view
2. 25102 is crossed on day closing basis. Bullish view
Pivot- Half-Full are weekly range and applicable only till 7th August.
Vertical lines are important times for intraday as buyer

NIFTY UPDATE The volume profile on Nifty indicates that up moves will not be smooth, we need some base formation before any meaningful momentum returns to the market. Keep tracking the minor and major pivots marked. This is what I will be tracking to take profits.

Nifty Analysis EOD – August 1, 2025 – Thursday🟢 Nifty Analysis EOD – August 1, 2025 – Thursday 🔴
🎢 Illusion Rally: What You See, Isn’t What It Was!
🧾 Nifty Summary
As we all expected, a negative gap-down opening occurred due to external news. Nifty opened 183 points lower, tested the 24,660–24,675 support zone, then rebounded sharply after a symmetrical triangle + VWAP breakout. The rally pierced through all key levels like a hot knife through butter, topping at 24,950, only to reverse with equal intensity. Closed at 24,765.
📌 Despite the technical structure, today’s move had no clear technical reasoning — more likely triggered by a mix of tariff news, confidence in Modi, weekly + monthly expiry, and manipulation.
📌 in spite of a bullish candle, strong upper rejection from 24,950 hints weakness. Candle appears bullish on colour, but bears dominated intraday close — forming a bearish Moboroshi Candle (illusion of strength).
📌 Bearish Moboroshi Candle Structure : close > open and close < Previous Close
🔍 Intraday Walk
📉 Gap down of 183 pts
🟢 Support held at 24,660–24,675
🔺 Symmetrical triangle + VWAP breakout
🚀 Sharp upmove to 24,950 zone
🔁 Reversal with same intensity
📉 Closed at 24,765 — below prior close
🖼 5 Min Time Frame Chart with Intraday Levels
📉 Daily Time Frame Chart with Intraday Levels
🕯 Daily Candle Breakdown
Open: 24,642.25
High: 24,956.50
Low: 24,635.00
Close: 24,768.35
Change: −86.70 (−0.35%)
Candle Structure:
✅ Green Candle (Close > Open) → +126.10 pts real body
⬆️ Upper Wick → 188.15 pts (Very Long)
⬇️ Lower Wick → 7.25 pts (Tiny)
Interpretation:
Opened near yesterday's low
Intraday sharp rally towards 24,950+
Faced strong selling at highs
Closed above open, but way below high — signals clear rejection
Candle Type:
📌 Bearish Moboroshi Candle — Appears bullish but hides weakness
🧠 Buyers strong initially, but sellers took control at the top
Key Insight:
Bulls need decisive close above 24,880–24,910
Else, expect drift back toward 24,660–24,675
🛡 5 Min Intraday Chart
⚔️ Gladiator Strategy Update
ATR: 208.29
IB Range: 93.95 → Medium
Market Structure: Unbalanced
Trades Triggered:
✅ 10:40 AM – Long Entry → Trailing Target Hit (R:R – 1:6.25)
📌 Trade Summary: Big R:R win today on breakout with trailing logic execution!
🧱 Support & Resistance Levels
🔺 Resistance Zones:
24,820 ~ 24,830
24,850
24,880 ~ 24,890
24,910
🔻 Support Zones:
24,780
24,725 ~ 24,715
24,660 ~ 24,650
24,620 ~ 24,600
💭 Final Thoughts
"When the move can’t be explained, the best position is caution."
Today's market behavior reinforces the idea that not all moves are technical. Keep your tools sharp, but don’t ignore contextual chaos.
✏️ Disclaimer
This is just my personal viewpoint. Always consult your financial advisor before taking any action.

Nifty levels - Aug 01, 2025Nifty support and resistance levels are valuable tools for making informed trading decisions, specifically when combined with the analysis of 5-minute timeframe candlesticks and VWAP. By closely monitoring these levels and observing the price movements within this timeframe, traders can enhance the accuracy of their entry and exit points. It is important to bear in mind that support and resistance levels are not fixed, and they can change over time as market conditions evolve.
The dashed lines on the chart indicate the reaction levels, serving as additional points of significance to consider. Furthermore, take note of the response at the levels of the High, Low, and Close values from the day prior.
We hope you find this information beneficial in your trading endeavors.
* If you found the idea appealing, kindly tap the Boost icon located below the chart. We encourage you to share your thoughts and comments regarding it.
Wishing you success in your trading activities!

Nifty again back towards the upper rangeNifty’s recent rise can be attributed to short covering ahead of the monthly expiry, which often results in a surge as traders close their short positions.
Currently, the index faces a strong resistance zone around 25,000–25,100. A clear move above this range could indicate a trend change or a shift towards a more bullish outlook. If Nifty does not decisively cross this resistance, the market is expected to remain neutral to sideways, meaning price action could stay range-bound without a clear direction.
Additionally, 24,600 will act as a strong support level. As long as Nifty stays above 24,600, market sentiment should remain stable, supporting a constructive stance. A break below this level could signal increased caution.
Summary:
Rise driven by short covering ahead of expiry.
Strong resistance at 25,000–25,100.
24,600 will act as strong support.
Above 25,100: Trend change or bullish breakout likely.
Below 25,100: Market remains neutral/sideways.
Above 24,600: Sentiment stays steady; below may warrant caution.
Unless Nifty crosses above the resistance zone or drops below strong support, the outlook remains stable and sideways.

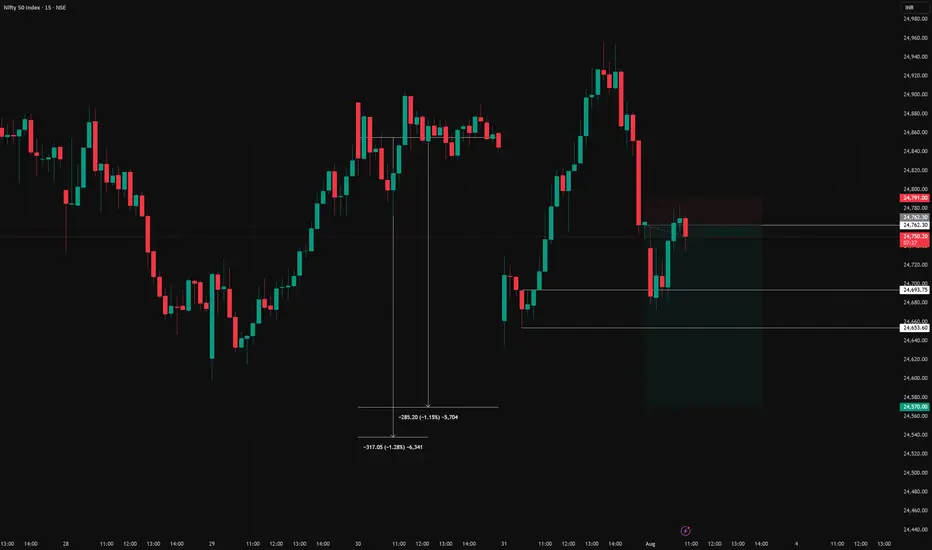
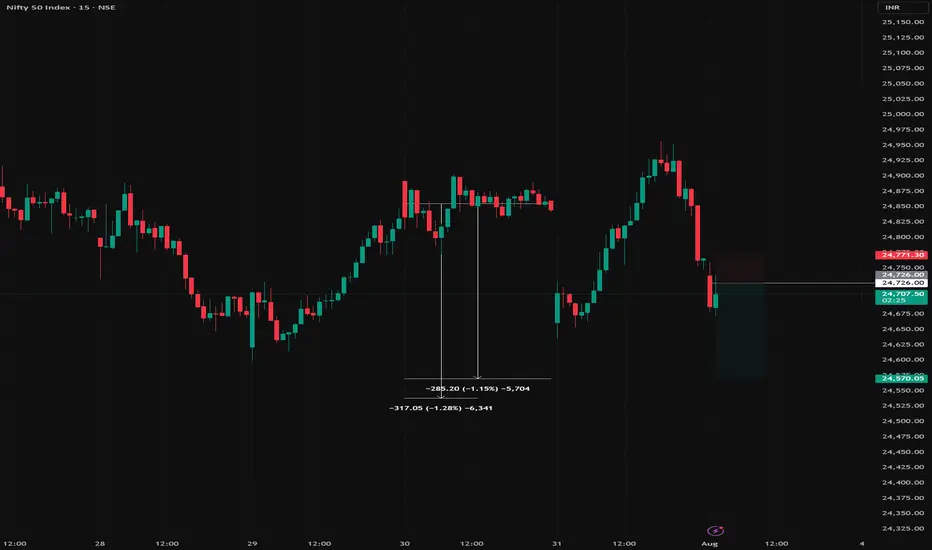
Nifty 24780 Pullback possible on next 1-2 days On 31 July, if someone watch closely price action he could capture Today up move coz Nifty gave almost same price action as 13 June let's try to find what is the Same thing: -
(A)31 July 2025: gap down is (-70%)
volume around 97 million
Bounce Back after gap down around +1%
(B) 13 June: gap down was (-80%)
Volume around 93 million
Bounce back after gap down around +1
On 13 June Nifty faced resistance of 24980 level then retraced. Due to such similarities, we can conclude that it could be pullback around 24780 level although I don't say market will behave same as before, I know every second of market is very dynamic and different from past days, but technical analysis always based on historical data. so, this is just assumption. take the trade on your own analysis & research.

From Demand to Glory: Nifty’s Bullish March to 25,220 Nifty Bullish Outlook
-Current Price: 24,905 (approx)
- Key Demand Zone: 24,620 – 24,660
- Key Supply Zone: 25,200 – 25,240
Technical View
- Strong Demand Bounce: Nifty reversed sharply from the demand zone (24,620–24,660),
indicating strong buying interest.
- Trend Breakout Potential: Price is approaching resistance near 24,920; a breakout could push
towards the supply zone at 25,220 (target).
- Momentum Structure: Higher lows formed after the demand zone test, showing bullish
strength.
News & Data Supporting Bullish Bias
- India’s Q1 GDP Growth: The latest estimates show strong economic growth, supporting equity
market sentiment.
- FIIs Turning Buyers: Foreign Institutional Investors (FIIs) have been net buyers over the past
few sessions, supporting index upside.
- Global Market Tone: US and Asian equities are stable, and crude oil prices are moderating,
supporting risk appetite.
- RBI Policy Outlook: Market expects no immediate rate hikes, keeping liquidity positive for
equities.
Expectation
If Nifty sustains above 24,900, we expect a bullish move towards 25,220 in the short term.
Stop-loss: Below 24,780 (to manage risk).


