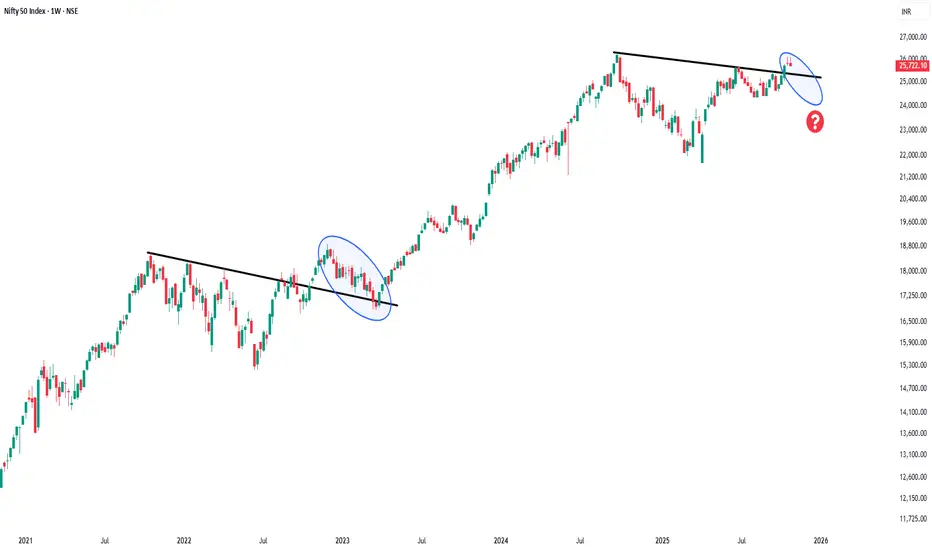
Will history repeat this time ?Previously nifty after breakout retest its support . Will history repeatthis time ?
Trade ideas
Nifty Analysis EOD – October 30, 2025 – Thursday 🟢 Nifty Analysis EOD – October 30, 2025 – Thursday 🔴
Bears Take the Driver’s Seat — 26K Slips Away Again!
🗞 Nifty Summary
Nifty opened with a 55-point gap-down right at the previously marked support zone of 26010 ~ 26020. However, the very first minute of trade confirmed weakness — the index couldn’t hold this zone and lost nearly 140 points within the first 40 minutes, breaking both key support and PDL levels.
A brief rescue attempt came from 25900, leading to a 75-point bounce, but conviction was missing — the market stayed rangebound for the majority of the session. Around 1:30 PM, a breakdown below IB Low triggered another wave of selling, marking the day’s low at 25845 in a highly volatile session.
By the close, Nifty settled at 25891.20, down 177 points, reflecting a clear shift in control to the bears.
🛡 5 Min Intraday Chart with Levels
🛡 Intraday Walk
Gap-down open near key support (26010–26020) failed instantly.
Sharp 140-point fall in early trade broke multiple support levels.
Rebound from 25900 lacked conviction; sideways phase dominated mid-session.
Breakdown below IB Low (13:30) opened a fresh range to 25845.
Wild volatility throughout; end-of-day close below 26K strengthened bearish grip.
📉 Daily Time Frame Chart with Intraday Levels
🕯 Daily Candle Breakdown
Open: 25,984.40
High: 26,032.05
Low: 25,845.25
Close: 25,877.85
Change: −176.05 (−0.68%)
🏗️ Structure Breakdown
Type: Bearish candle with long upper wick and wide range.
Range (High–Low): 186.80 points → high volatility.
Body: ≈ 106.55 points → strong selling pressure.
Upper wick: ≈ 47.65 points → rejection from intraday highs.
Lower wick: ≈ 32.60 points → mild recovery from lows.
📚 Interpretation
The day began with optimism but ended in disappointment for bulls. Early strength faded quickly as sellers dominated from 26,000 onward.
The close near the lower end of the range confirms profit booking and mild distribution at higher levels. This candle follows the earlier bullish continuation with a strong bearish response, signaling short-term caution.
🕯Candle Type
A Bearish Engulfing–like continuation candle, though not textbook perfect, represents a decisive rejection near 26K — an early warning for bulls.
🛡 5 Min Intraday Chart
⚔️ Gladiator Strategy Update
ATR: 202.90
IB Range: 139.80 → Medium
Market Structure: Imbalanced (Bearish Tilt)
Trade Highlights:
10:31 – Short Trade → Trailing SL Hit
10:57 – Long Trade → Target Achieved (R:R 1:1.31)
13:18 – Long Trade → SL Hit
📌 What’s Next? / Bias Direction
As mentioned in yesterday’s note, 26010 ~ 26020 was the must-hold zone — and losing it handed full control to bears.
For bulls to regain ground, Nifty needs to close above 26K with strength.
For bears, a close below 25700 will confirm short-term dominance and possibly extend weakness toward 25580–25500.
Until then, expect high volatility and range-bound play. Avoid emotional trades; discipline is your edge.
📌 Support & Resistance Levels
Resistance Zones:
25920
25944
25977
26010 ~ 26020
Support Zones:
25865 ~ 25845
25810 ~ 25790
25725 ~ 25715
💡 Final Thoughts
“Markets test patience before rewarding conviction. In volatility, your biggest weapon is restraint.”
✏️ Disclaimer
This is just my personal viewpoint. Always consult your financial advisor before taking any action.

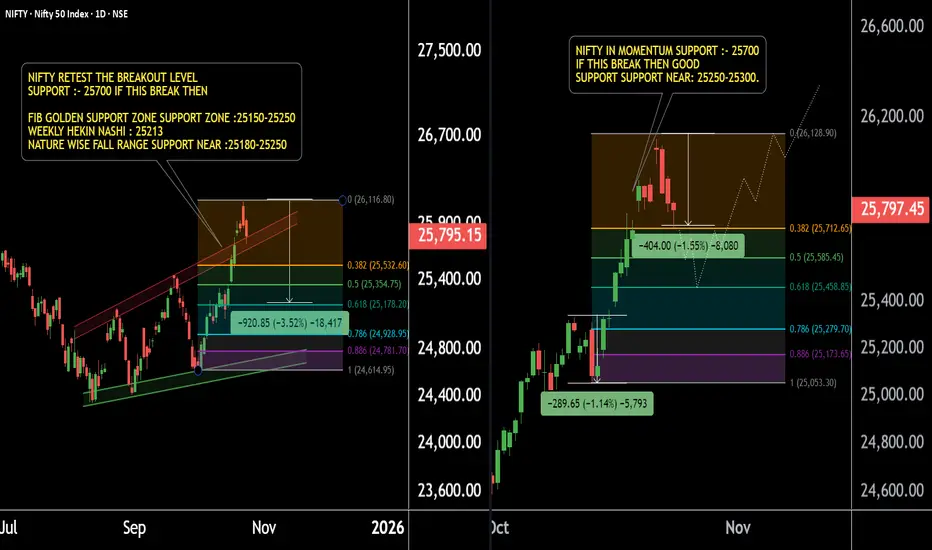
NIFTY SUPPORT LEVELS – Time to Focus for Potential ReversalNIFTY – Focus on Key Buying Levels (Daily & 4H Timeframe Analysis)
NIFTY is currently showing strong support zones for both momentum and safe buying opportunities.
Timeframe: Daily & 4H
Primary Momentum Buying Level: Around 25,700
Based on Fibonacci levels and short-term price action.
If NIFTY breaks below 25,700, we may see a further decline of 200–250 points.
Next Support Zone: 25,450–25,500 (Daily Timeframe)
Heikin Ashi Candle Support: 25,213, with a broader support range of 25,150–25,250 — confirmed by multiple price action setups.
Key Insight:
If NIFTY holds above these key supports, a reversal or bullish momentum is highly possible. Stay focused on the mentioned levels and trade with patience and discipline.
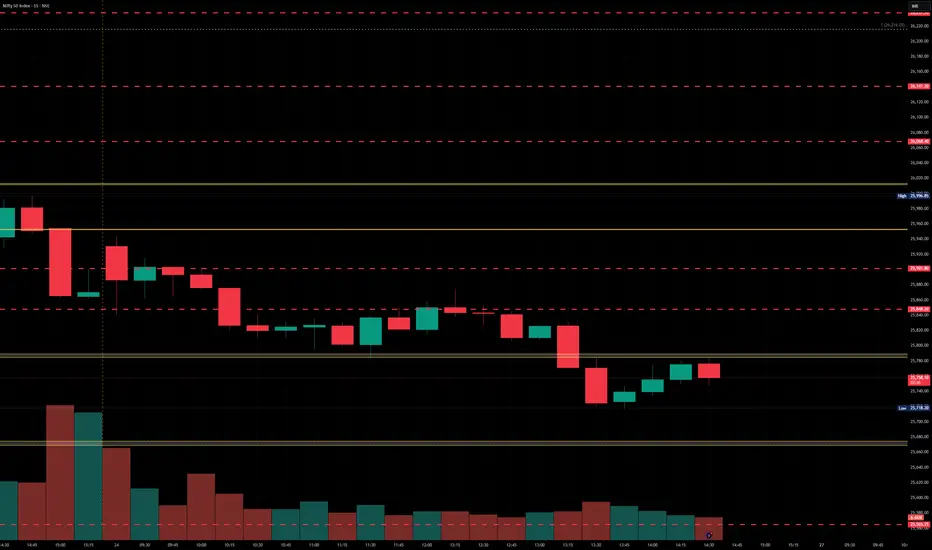
Nifty levels - Oct 27, 2025Nifty support and resistance levels are valuable tools for making informed trading decisions, specifically when combined with the analysis of 5-minute timeframe candlesticks and VWAP. By closely monitoring these levels and observing the price movements within this timeframe, traders can enhance the accuracy of their entry and exit points. It is important to bear in mind that support and resistance levels are not fixed, and they can change over time as market conditions evolve.
The dashed lines on the chart indicate the reaction levels, serving as additional points of significance to consider. Furthermore, take note of the response at the levels of the High, Low, and Close values from the day prior.
We hope you find this information beneficial in your trading endeavors.
* If you found the idea appealing, kindly tap the Boost icon located below the chart. We encourage you to share your thoughts and comments regarding it.
Wishing you success in your trading activities!
Nifty50 Index Intraday Analysis - 24th Oct., 2025NSE:NIFTY — Chart Pathik Insights
Fresh levels for the day map out critical reaction zones and trend triggers for both intraday momentum and reversal trades. Nifty is currently trading near 25,870 after a steady decline, now consolidating just below the zero line at 25,891—a clear pivot for bulls and bears alike.
Bearish Setup:
Short bias stays valid below 25,955, especially if momentum fails to reclaim above the 25,983 add-long zone.
Downside Levels:
25,742: First support for partial covers or quick targets.
25,650: Major extension for deeper moves if pressure persists.
Risk Management: Shorts should remain protected under 25,931; cover or reverse if price recovers above 25,983.
Bullish Setup:
Long ideas activate above 26,012, confirmed with close over 26,035 and momentum building through higher targets.
Upside Levels:
26,041: Initial resistance and logical booking point.
26,133: Extended level for full trend play.
Risk Management: Protect longs near 25,983 or 25,955 in case of sudden reversals.
Neutral View:
25,891 serves as the day’s balance line. Choppiness likely persists while price hovers this zone—wait for strong directional follow-through for high-conviction plays.
Use these references for disciplined entries, dynamic positioning, and logical intraday exits. If these levels support your decision making, boost, comment, and share—your feedback fuels ongoing daily analysis.
For constant, structured insights and analytic growth, follow Chart Pathik.

PRZ for Nifty 25803-25978PRZ for Nifty 25803-25978
Min. Target : 25111-24602-24288
CMP 24868 @ Oct 21, 2025
Chart by Sandeep Rehlan

NIfty 50Nifty 50 advances steadily toward completing the cycle
The internal structure of wave (3.1) Completed & Coming towards 3.2 as mentioned in the chart till that Rectangle Box.

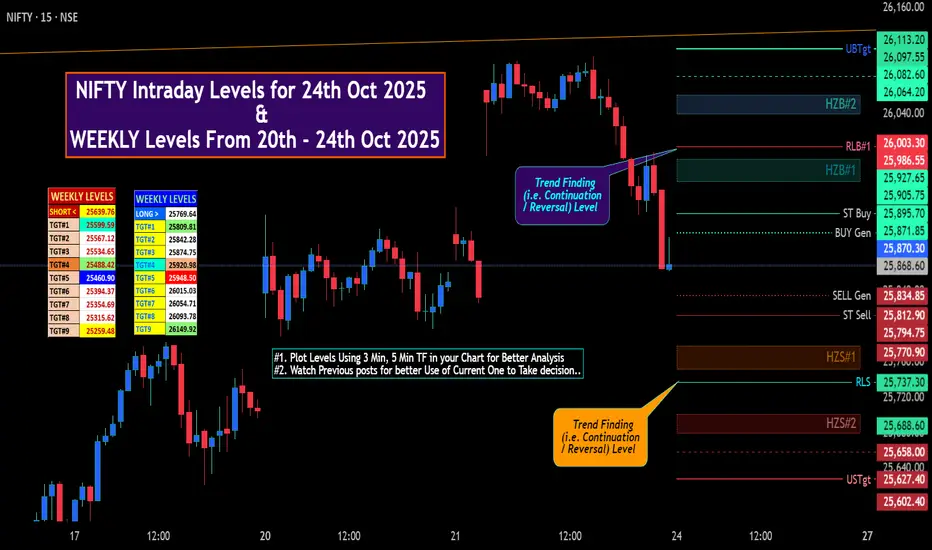
NIFTY Intraday Levels for 24th Oct 2025✍🏽️ Yesterday night GIFTNITY Closed Near +1.4+%
In Social Network & Analyst fraternity sitting & Shouting in Business Channel NEW High with Gapup of 300+ points, BUT NEVER REACHED 300+ Points during whole day of Trading. Also Notice One thing All the Gains in First 3-4 hours of trade absorbed in Last hour & Closd Near Day LOW & Near Monday Close.
But as per my Level No 5 min Candle Closed Above my mentioned "UBTgt @ 26098.55 ( Though at 12.45 pm European Market opening Session a Knee-Jurk reaction made a high @ 26104, but with that Candle Closed Near 26078.✍🏽️
🚀 "WEEKLY Levels" mentioned in BOX format.
🌡️Plot Levels Using 3 Min, 5 Min Time frame in your Chart for Better Analysis
L#1: If the candle crossed & stays above the “Buy Gen”, it is treated / considered as Bullish bias.
L#2: Possibility / Probability of REVERSAL near RLB#1 & UBTgt
L#3: If the candle stays above “Sell Gen” but below “Buy Gen”, it is treated / considered as Sidewise. Aggressive Traders can take Long position near “Sell Gen” either retesting or crossed from Below & vice-versa i.e. can take Short position near “Buy Gen” either retesting or crossed downward from Above.
L#4: If the candle crossed & stays below the “Sell Gen”, it is treated / considered a Bearish bias.
L#5: Possibility / Probability of REVERSAL near RLS#1 & USTgt
HZB (Buy side) & HZS (Sell side) => Hurdle Zone,
*** Specialty of “HZB#1, HZB#2 HZS#1 & HZS#2” is Sidewise (behaviour in Nature)
Rest Plotted and Mentioned on Chart
Color code Used:
Green =. Positive bias.
Red =. Negative bias.
RED in Between Green means Trend Finder / Momentum Change
/ CYCLE Change and Vice Versa.
Notice One thing: HOW LEVELS are Working.
Use any Momentum Indicator / Oscillator or as you "USED to" to Take entry.
⚠️ DISCLAIMER:
The information, views, and ideas shared here are purely for educational and informational purposes only. They are not intended as investment advice or a recommendation to buy, sell, or hold any financial instruments. I am not a SEBI-registered financial adviser.
Trading and investing in the stock market involves risk, and you should do your own research and analysis. You are solely responsible for any decisions made based on this research.
"As HARD EARNED MONEY IS YOUR's, So DECISION SHOULD HAVE TO BE YOUR's".
Do comment if Helpful .
In depth Analysis will be added later (If time Permits)
Short Nifty From 26000 for huge sharp sell offShort Nifty From 26000 for huge sharp sell off. Creating double top pattern with lifetime high, with sharp rally upwards expecting huge orders to sell from 26000 levels. SL is at 1.5% higher to Lifetime high or check the trade plotted on the chart for Entry. SL and target.
This is all for study purpose, dont take trade based on this idea.
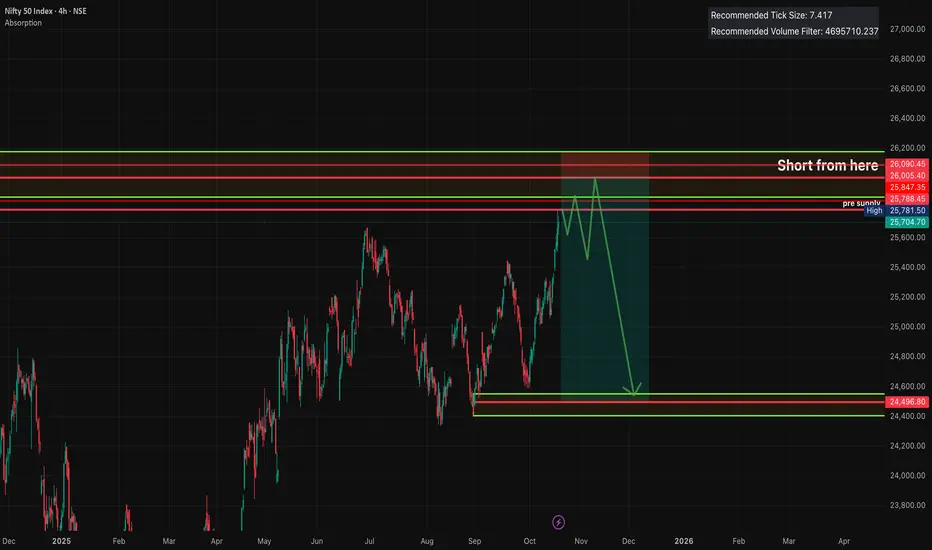
Nifty 50 - Strong Reversal zone - 26200-26850 Nifty 50- Strong Reversal zone - 26200- 26850- watch this zone for profit booking minimum book 80% and hold 20% SL to cost.
Weekly supply zone
Bearish Bat pattern

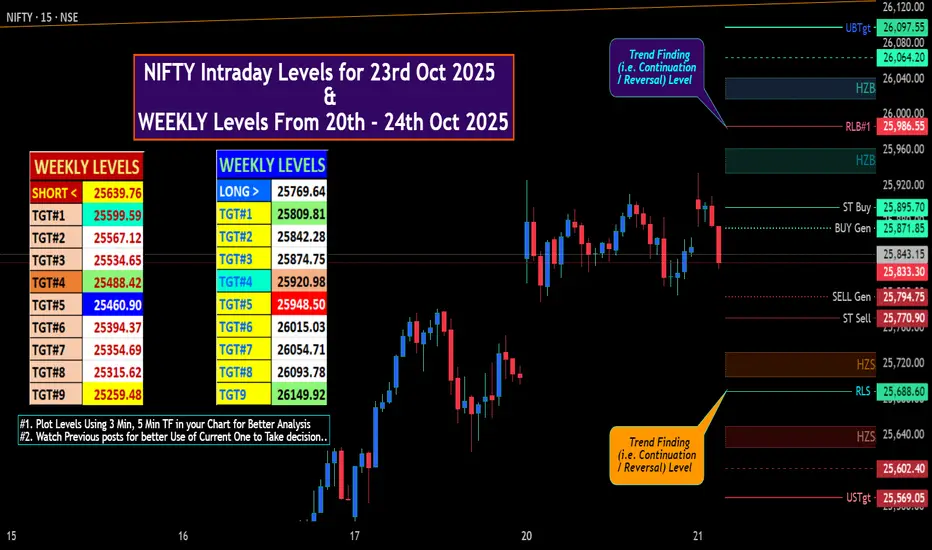
NIFTY Intraday Levels for 23rd Oct 2025🚀 "WEEKLY Levels" mentioned in BOX format.
🌡️Plot Levels Using 3 Min, 5 Min Time frame in your Chart for Better Analysis
L#1: If the candle crossed & stays above the “Buy Gen”, it is treated / considered as Bullish bias.
L#2: Possibility / Probability of REVERSAL near RLB#1 & UBTgt
L#3: If the candle stays above “Sell Gen” but below “Buy Gen”, it is treated / considered as Sidewise. Aggressive Traders can take Long position near “Sell Gen” either retesting or crossed from Below & vice-versa i.e. can take Short position near “Buy Gen” either retesting or crossed downward from Above.
L#4: If the candle crossed & stays below the “Sell Gen”, it is treated / considered a Bearish bias.
L#5: Possibility / Probability of REVERSAL near RLS#1 & USTgt
HZB (Buy side) & HZS (Sell side) => Hurdle Zone,
*** Specialty of “HZB#1, HZB#2 HZS#1 & HZS#2” is Sidewise (behaviour in Nature)
Rest Plotted and Mentioned on Chart
Color code Used:
Green =. Positive bias.
Red =. Negative bias.
RED in Between Green means Trend Finder / Momentum Change
/ CYCLE Change and Vice Versa.
Notice One thing: HOW LEVELS are Working.
Use any Momentum Indicator / Oscillator or as you "USED to" to Take entry.
⚠️ DISCLAIMER:
The information, views, and ideas shared here are purely for educational and informational purposes only. They are not intended as investment advice or a recommendation to buy, sell, or hold any financial instruments. I am not a SEBI-registered financial adviser.
Trading and investing in the stock market involves risk, and you should do your own research and analysis. You are solely responsible for any decisions made based on this research.
"As HARD EARNED MONEY IS YOUR's, So DECISION SHOULD HAVE TO BE YOUR's".
Do comment if Helpful .
In depth Analysis will be added later (If time Permits)
Instruments for Global TradingIntroduction
Global trading plays a pivotal role in shaping the modern economy. It facilitates the exchange of goods, services, and financial assets across borders, integrating economies and enhancing global wealth creation. At the heart of this complex system lie the financial instruments that enable participants—ranging from multinational corporations and institutional investors to individual traders—to invest, hedge risks, and speculate in international markets. These instruments come in various forms, from traditional securities like stocks and bonds to complex derivatives and foreign exchange instruments. Understanding the range and functionality of these instruments is essential to navigating the dynamic global trading landscape.
1. Understanding Global Trading Instruments
In simple terms, global trading instruments are financial tools used to facilitate international investment, speculation, hedging, and trade financing. They allow investors to gain exposure to foreign markets, manage exchange rate risks, and participate in the global flow of capital.
The instruments can broadly be categorized into five main types:
Equity Instruments (Stocks and ETFs)
Debt Instruments (Bonds and Notes)
Derivatives (Futures, Options, Swaps, and Forwards)
Foreign Exchange (Forex) Instruments
Commodity Instruments (Metals, Energy, Agriculture)
Each instrument serves specific purposes and risk profiles, and together they form the foundation of international financial systems.
2. Equity Instruments
a. Stocks
Stocks, or equities, represent ownership in a company. When investors purchase shares of a firm listed on an international exchange—such as the New York Stock Exchange (NYSE), London Stock Exchange (LSE), or Tokyo Stock Exchange (TSE)—they gain partial ownership and a claim on the company’s profits.
Global stock trading allows investors to diversify across regions and sectors. For example, an investor in India might buy shares of Apple Inc. or Toyota Motor Corporation to benefit from their global market presence.
Key benefits include:
Capital appreciation: Profit from stock price increases.
Dividends: Regular income through profit distribution.
Portfolio diversification: Reduced country-specific risk.
However, investing in foreign equities involves exposure to currency risk, political instability, and regulatory differences. Many investors mitigate these through exchange-traded funds (ETFs) or American Depository Receipts (ADRs).
b. Exchange-Traded Funds (ETFs)
ETFs are pooled investment vehicles that track indexes, sectors, or commodities and are traded like stocks on exchanges. Global ETFs—such as those tracking the MSCI World Index or Emerging Markets Index—allow investors to gain exposure to multiple international markets in a single trade.
ETFs combine the liquidity of stocks with the diversification of mutual funds, making them a popular choice for global traders.
3. Debt Instruments
a. Bonds
Bonds are debt securities issued by governments, corporations, or international institutions to raise capital. When investors buy a bond, they are lending money to the issuer in exchange for periodic interest payments and repayment of the principal amount at maturity.
Types of global bonds include:
Sovereign Bonds: Issued by national governments (e.g., U.S. Treasury bonds, Japanese Government Bonds).
Corporate Bonds: Issued by multinational firms (e.g., bonds by Apple or Shell).
Eurobonds: Bonds issued in a currency not native to the country of issuance (e.g., a U.S. dollar bond issued in Europe).
Global Bonds: Offered simultaneously in multiple markets and currencies.
Bond trading enables investors to benefit from fixed income while diversifying across currencies and credit qualities. However, global bond investors must manage interest rate differentials and exchange rate risks.
b. Treasury Bills and Notes
Treasury bills (T-bills) and notes are short- and medium-term government securities, respectively. They are considered low-risk instruments ideal for conservative investors seeking stability in global portfolios. Institutions and central banks frequently trade T-bills as part of foreign reserve management.
4. Derivative Instruments
Derivatives derive their value from an underlying asset—such as a stock, bond, commodity, or currency. These instruments are essential for hedging risk and speculating on market movements in global trading.
a. Futures Contracts
A futures contract is an agreement to buy or sell an asset at a predetermined price on a specific future date. Futures are standardized and traded on exchanges such as the Chicago Mercantile Exchange (CME) or Euronext.
Common examples include:
Currency futures (hedging exchange rate risk)
Commodity futures (oil, gold, wheat)
Index futures (S&P 500, Nikkei 225)
Futures trading allows global investors to manage exposure to price fluctuations. For instance, a Japanese importer might buy U.S. dollar futures to lock in future exchange rates.
b. Options Contracts
Options give traders the right, but not the obligation, to buy or sell an asset at a specified price before expiration.
Call options allow buying the asset.
Put options allow selling the asset.
Options are widely used in global markets to hedge against price volatility and as tools for leveraged speculation.
c. Swaps
Swaps are contracts in which two parties exchange cash flows or financial instruments. The most common types are:
Interest Rate Swaps: Exchange fixed-rate payments for floating-rate ones.
Currency Swaps: Exchange cash flows in different currencies.
Commodity Swaps: Exchange payments based on commodity price movements.
Global corporations use swaps to manage financing costs and currency exposure across multiple markets.
d. Forwards
Forward contracts are customized, over-the-counter (OTC) agreements to buy or sell assets at a future date for a price agreed upon today. Unlike futures, forwards are not standardized and thus offer greater flexibility but higher counterparty risk.
5. Foreign Exchange (Forex) Instruments
The foreign exchange market (Forex or FX) is the world’s largest financial market, with daily trading volumes exceeding $7 trillion. Forex instruments facilitate global trade, investment, and currency risk management.
a. Spot Forex Transactions
The spot market involves the immediate exchange of one currency for another, typically settled within two business days. For instance, a trader might exchange euros for U.S. dollars at the current exchange rate.
b. Forward Forex Contracts
Forward contracts in forex are agreements to exchange currencies at a predetermined rate on a future date. They help corporations and investors hedge against unfavorable currency fluctuations.
c. Currency Futures and Options
Just like other derivatives, currency futures and currency options are standardized contracts traded on exchanges, allowing global traders to speculate or hedge against exchange rate movements.
d. Currency Swaps
In a currency swap, two parties exchange interest payments and principal in different currencies. Central banks often use currency swaps to stabilize exchange rates or provide liquidity.
6. Commodity Instruments
Global commodities trading covers raw materials such as energy (oil, gas), metals (gold, silver, copper), and agriculture (wheat, coffee, sugar). These instruments are vital to world trade, as commodity prices influence inflation, industrial production, and currency movements.
a. Physical Commodity Trading
Involves the direct purchase and sale of physical goods—often between producers, traders, and consumers. Companies like Glencore and Vitol dominate this space.
b. Commodity Futures
Futures contracts on commodities are widely traded on exchanges such as the NYMEX and ICE Futures Europe. They enable both producers and investors to hedge price volatility. For example:
An airline might buy jet fuel futures to hedge against rising oil prices.
A gold trader might short gold futures to profit from anticipated price declines.
c. Commodity ETFs and Derivatives
ETFs tracking commodities (like SPDR Gold Shares) and commodity options offer exposure without the need for physical ownership, simplifying access for retail and institutional investors.
7. Other Instruments in Global Trading
a. Mutual Funds
Global mutual funds pool money from multiple investors to buy a diversified portfolio of international securities. Managed by professional fund managers, these funds are suitable for investors seeking long-term exposure without direct trading.
b. Depository Receipts
American Depository Receipts (ADRs) and Global Depository Receipts (GDRs) allow investors to trade foreign company shares on domestic exchanges. For instance, Infosys ADRs trade on the NYSE, enabling U.S. investors to own Indian stocks easily.
c. Exchange-Traded Notes (ETNs)
ETNs are unsecured debt instruments linked to the performance of an underlying index or asset. They provide access to foreign markets, commodities, or currencies, but carry issuer credit risk.
d. Structured Products
These are complex instruments combining derivatives and traditional assets to offer tailored risk-return profiles. For instance, a principal-protected note guarantees the return of the principal while offering upside linked to an equity index.
8. Role of Technology in Global Trading Instruments
Technological advancements have revolutionized global trading. Online platforms and electronic communication networks (ECNs) have made it possible for traders to access multiple asset classes and markets instantly.
Algorithmic trading, artificial intelligence, and blockchain technology are enhancing efficiency, transparency, and security in cross-border trading. Moreover, tokenized assets—digital representations of securities or commodities—are emerging as new instruments, bridging traditional finance with decentralized markets.
9. Risk Management in Global Trading
While global trading offers diversification and high return potential, it comes with inherent risks:
Exchange rate volatility
Interest rate fluctuations
Political and regulatory instability
Counterparty and liquidity risks
To manage these, investors use derivatives (for hedging), diversify portfolios across geographies, and adopt risk management frameworks such as Value-at-Risk (VaR) and stress testing.
10. Regulatory Environment
Global trading is governed by a complex web of international regulations. Key institutions include:
International Monetary Fund (IMF) – Oversees currency stability.
World Trade Organization (WTO) – Regulates international trade.
Securities and Exchange Commissions (e.g., SEC, FCA, SEBI) – Supervise market integrity.
Basel Committee on Banking Supervision – Sets capital standards for global banks.
Regulations ensure transparency, prevent market abuse, and maintain investor confidence in global markets.
Conclusion
Global trading instruments form the backbone of the interconnected financial world. From equities and bonds to derivatives and currencies, each instrument serves a unique function in enabling capital movement, hedging risk, and promoting global economic growth. With advancing technology, rising cross-border investments, and emerging markets gaining prominence, the range and sophistication of these instruments continue to expand.
In essence, understanding and effectively utilizing global trading instruments empower investors, institutions, and policymakers to participate in the world economy more efficiently—balancing risk and reward in pursuit of sustainable financial growth.
Dip in NIfty - An Opportunity for Value InvestorsSo as we were expecting, profit booking has started after that clean and sharp rally.
Today, NSE:NIFTY fell more than 240 points from the day’s high and formed a bearish snort on the daily chart.
Pivot has now shifted to 25952, making it a crucial point for the index.
If Nifty opens below this level, it could trigger a sharp fall as the PP is only 0.24 — indicating the potential for a strong move.
Support for tomorrow will be at 25750. If the index sustains below this level, we can see a drop toward 25350 in the coming days.
Resistance stands at 26134.
However, short-term momentum still looks healthy, so select sectoral stocks will continue to perform well. The two sectors I remain bullish on are NSE:NIFTY_IND_DEFENCE and NSE:CNXAUTO
In fact, for short- to mid-term traders, this dip will be an excellent opportunity to accumulate value stocks with a TechnoFunda approach.
That’s all for now. I’ll guide further as the market moves.
Take care and have a profitable tomorrow.
📊 Levels at a glance:
Pivot: 25952
Support: 25750 (below = dip toward 25350)
Resistance: 26134
Pivot Percentile: 0.24 (sharp move potential)
Bias: Profit-booking phase, short-term bullish trend intact
Sectors to watch: Defence, Auto Parts
Strategy: Accumulate value stocks on dips (TechnoFunda approach)

Nifty levels - Oct 24, 2025Nifty support and resistance levels are valuable tools for making informed trading decisions, specifically when combined with the analysis of 5-minute timeframe candlesticks and VWAP. By closely monitoring these levels and observing the price movements within this timeframe, traders can enhance the accuracy of their entry and exit points. It is important to bear in mind that support and resistance levels are not fixed, and they can change over time as market conditions evolve.
The dashed lines on the chart indicate the reaction levels, serving as additional points of significance to consider. Furthermore, take note of the response at the levels of the High, Low, and Close values from the day prior.
We hope you find this information beneficial in your trading endeavors.
* If you found the idea appealing, kindly tap the Boost icon located below the chart. We encourage you to share your thoughts and comments regarding it.
Wishing you success in your trading activities!

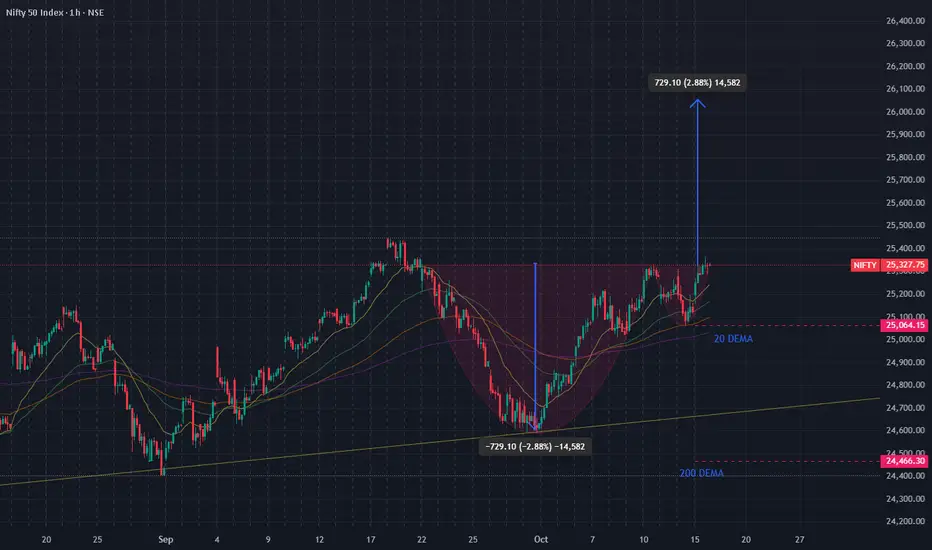
A Cup and Handle is visible in the Nifty 1 hour Chart... Setup - Completion of a Cup and Handle pattern.
Condition for Entry- A decisive break and close above the resistance level (the "rim" of the cup).
This confirms the pattern's breakout.
Entry Price - Enter long (buy) on a confirmed breakout above the rim resistance
(approximately 25,350 to 25,400 based on the chart).
Price Target - The conventional target for a Cup and Handle pattern is measured by
taking the depth of the cup and projecting it upwards from the breakout
point. The chart marks the depth as 775.10. Therefore, the target would
be: Breakout Price + Depth of the Cup. Example: If the breakout is at
25,350, the target is 25,350 + 775 = 26,125.
Stop-Loss (Risk Management) -
Place the stop-loss order below the lowest point of the "handle". This
ensures the trade is cut short if the breakout fails and the price reverses
into a downtrend.
Timeframe - This is an Hourly (1H) chart, so the trade would be suitable for a swing
trader or a short-term position trader, potentially lasting days to a couple
of weeks.
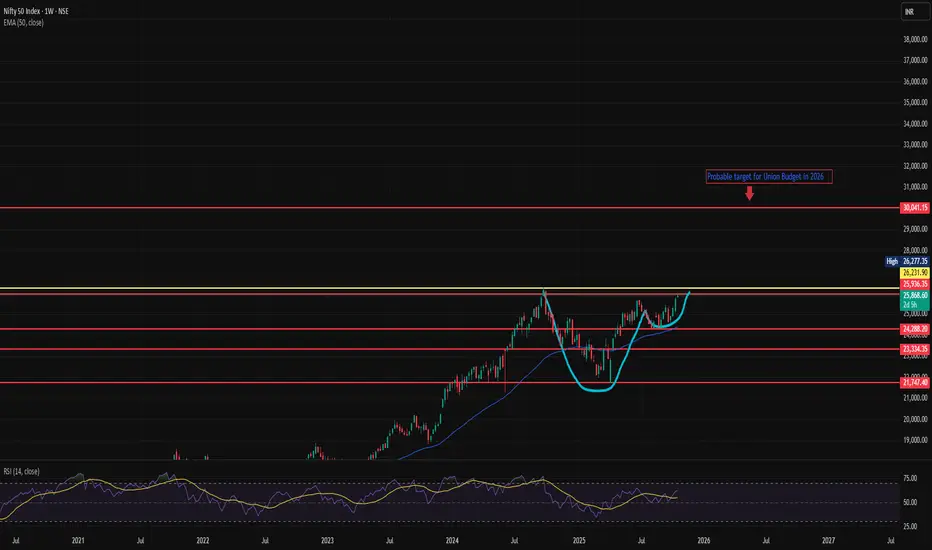
NIFTY - Cup & Handle PatternCurrent Market Structure
Strong higher-lows + basing under resistance behaviour (very bullish).
50-week EMA is cleanly sloping upward — major sign that big money is accumulating, not distributing.
RSI is neither overbought nor weakening → still has room.
Price is pressing against last major supply zone — 25,900 / 26,200 as final resistance before open sky.
Levels That Matter Right Now (Weekly)
Zone Meaning
26,000 – 26,300 Final resistance before breakout
25,200 – 25,400 Strong demand zone → ideal retest buy zone
24,300 First major trend-break warning (only if closed below weekly)
23,300 Trend failure → cycle inversion risk zone
My Forecast — As an Aggressive Objective Weekly Options Trader
Time Horizon Expectation
28 OCT 2025 Weekly Expiry Highly probable expiry above 26,000 unless macro shock.
Sideways grind → bullish bias.
Next Monthly Expiry 26,500 – 27,000 zone achievable if breakout sustains early.
Will we hit 30,000? YES — extremely likely in 2026Q1 if breakout is clean and no
LTC crisis / geopolitical accident.
If 26,300 breaks on a wide-range weekly candle with massive volume, 30,000 can hit even before Union Budget 2026.
Nifty Short & Medium Term Support&Resistance_22-Oct to 23-Oct-25Nifty Short & Medium Term Support&Resistance_22-Oct to 23-Oct-25
Nifty 25868
Long call was given two weeks before, Nifty very decisively crossed the 25000 resitance and moved up 1000 Points in the last week.
Current Short Term Resistance are 26000 and 26269 ( all time high). It need to break the resistance 26269 decisively to move up to 28000 target in med-long term.
Quarterly result started coming out slowly, HDFC Bank posted 10% profit, ICICI Bank posted 5% profit, Reliance posted 10% profit. HDFC AMC, Persistent Systems,Dixon, Waree Energies and Renewables, KEI, Polycab, ICICI Lombard and ICICI Pru posted good results. All these stocks are already gone up and PE is high. Hence the market also moved up last week. Forthcoming results will take the Index further up or down.
Hence the strategy can be shifted to neutral from long.
Overall, the Qtrly Results and Tariffs deal will decide the future path of the Nifty. Since it is a Volatile situation SIP route or buy in multiple parcel route with a goal of 3-5 years will workout.
Recent 100% additional tariff on China got severe effect on US market on Friday, it will affect global other trade markets too on Monday. Mainly due to the uncertainty prevailing over.
However, for India though initial drop market tend to move up to 25670 ( Jun 2025 all time high).
Repo and FD rate reduction by RBI, people mandatorily have to choose Debt/Commodity/Equity as alternate in order to beat the inflation.
Apart from that Low Cost ULIPs (2.5 L Limit per person) as one of the option to save the tax- ICICI & HDFC ULIPs are doing well, ULIPs are simplified and charges are lesser compared to MFs in terms of long term, Various fund option including passive funds are introduced.
GST 2.0 is a reform which can aid in Auto/ FMCG / Home Appliances sales will get a boost due to the festival season.
Since market is volatile, use the dips (Opportunity) and buy through SIP or through multiple parcel in these uncertain times with a goal of 3-5 years.
Nifty Short Term Supports:
1.25200 ( 25154 Aug 2025 high)
2.25350 ( Fibonacci resistance shown )
3.25450 ( 25442 is the Aug 2025 high)
4. 25500 ( 25441 Sep 18th 2025 High )
5. 24700 (Trend Line as shown)
6. 24000-24170 (Fibonacci Retracements Supports- Two Supports in this zone 24116 & 24171 as shown)
Medium Term Support:
1. 23500-23700 (Fibonacci Retracements Supports- Two Supports in this zone 23608 & 23707 as shown)
2. 23000
Resistance ( Multiple Resistances are there between 25000-25650):
1. 25000
2.
Medium Term:
1.25670 ( Jun 2025 High) Should cross this resistance in short term decisively inorder to move up.
2.26269 ( Sep 2024 High)

Trading Crude Oil and the Geopolitical Impact on PricesIntroduction
Crude oil is one of the most strategically significant commodities in the global economy. It fuels transportation, powers industries, and serves as a critical input for countless products ranging from plastics to fertilizers. Because of its universal importance, crude oil trading is not just a financial endeavor—it is a reflection of global political stability, economic growth, and international relations. The price of crude oil is highly sensitive to geopolitical events, including wars, sanctions, alliances, and policy changes. Understanding how geopolitical dynamics affect oil trading and pricing is vital for traders, investors, and policymakers.
1. The Fundamentals of Crude Oil Trading
Crude oil trading involves the buying and selling of oil in various markets, primarily through futures contracts on exchanges such as the New York Mercantile Exchange (NYMEX), Intercontinental Exchange (ICE), and Dubai Mercantile Exchange (DME). These contracts allow traders to speculate on the future price of oil, hedge against risks, or facilitate physical delivery. Two main benchmark grades dominate the market: West Texas Intermediate (WTI) and Brent Crude.
WTI Crude Oil is primarily sourced from the U.S. and traded in dollars per barrel.
Brent Crude Oil is produced in the North Sea and serves as the global benchmark for pricing.
Oil prices are influenced by multiple factors, including supply and demand fundamentals, global economic growth, production levels, inventory data, transportation costs, and geopolitical events. Among these, geopolitical tensions often have the most immediate and dramatic impact.
2. Geopolitics as a Determinant of Oil Prices
The global oil market is uniquely vulnerable to geopolitical developments because a significant portion of reserves and production is concentrated in politically sensitive regions such as the Middle East, North Africa, and Russia. Around 60% of proven oil reserves lie in OPEC (Organization of Petroleum Exporting Countries) member nations, many of which have experienced conflict, sanctions, or regime instability.
Geopolitical risk refers to the potential disruption in oil supply or transportation routes due to international conflicts, political upheaval, or policy decisions. When such risks escalate, traders often bid up oil prices in anticipation of supply shortages—even before any actual disruption occurs.
3. Historical Perspective: Major Geopolitical Events and Oil Prices
a. The 1973 Arab Oil Embargo
One of the earliest and most significant examples of geopolitically driven oil price shocks occurred in 1973 when Arab OPEC members imposed an oil embargo against the United States and other nations supporting Israel during the Yom Kippur War. Oil prices quadrupled within months, leading to inflation, recession, and a global energy crisis. The embargo demonstrated the power of oil as a political weapon and the vulnerability of consumer nations.
b. The Iranian Revolution (1979)
The overthrow of the Shah of Iran and the subsequent decline in Iranian oil production reduced global supply by nearly 5%. This shortage, coupled with the Iran-Iraq War (1980–1988), sent prices soaring again. The resulting volatility highlighted how political instability in a single oil-producing nation could ripple through the entire global economy.
c. The Gulf War (1990–1991)
Iraq’s invasion of Kuwait disrupted nearly 5 million barrels per day of oil production. The U.S.-led coalition’s response and the ensuing war created massive uncertainty in the Middle East, briefly pushing oil prices above $40 per barrel—a significant level for that time.
d. The Iraq War (2003)
The U.S. invasion of Iraq reignited geopolitical fears about supply disruptions. Although global production eventually stabilized, the war contributed to sustained higher oil prices in the early 2000s, further compounded by rapid industrialization in China and India.
e. The Arab Spring (2010–2011)
The wave of protests across the Middle East and North Africa led to regime changes and unrest in key producers such as Libya and Egypt. The civil war in Libya, in particular, cut oil output by over one million barrels per day, causing Brent crude prices to exceed $120 per barrel.
f. Russia-Ukraine Conflict (2014 and 2022)
Russia’s annexation of Crimea in 2014 and its full-scale invasion of Ukraine in 2022 significantly disrupted global energy markets. As one of the world’s largest oil and gas exporters, Russia faced Western sanctions that restricted exports, insurance, and financing. In early 2022, Brent crude spiked above $130 per barrel, reflecting fears of prolonged supply shortages and energy insecurity across Europe.
4. Channels Through Which Geopolitics Impacts Oil Prices
Geopolitical events influence oil prices through several interconnected channels:
a. Supply Disruptions
Conflicts or sanctions can directly reduce oil supply by damaging infrastructure, limiting production, or restricting exports. For example, sanctions on Iran in 2012 and again in 2018 led to significant declines in its oil exports, tightening global supply.
b. Transportation and Shipping Risks
Chokepoints such as the Strait of Hormuz, Suez Canal, and Bab el-Mandeb Strait are vital for global oil transportation. Any military conflict or threat in these areas immediately raises concerns about shipping disruptions, leading to higher prices. Nearly 20% of global oil passes through the Strait of Hormuz daily.
c. Speculative Reactions
Traders and hedge funds respond quickly to geopolitical news, often amplifying price movements. Futures markets price in expected risks, causing volatility even when actual supply remains unaffected.
d. Strategic Reserves and Policy Responses
Nations often release oil from strategic reserves or negotiate production increases through OPEC to stabilize markets. For example, the U.S. and IEA (International Energy Agency) coordinated strategic reserve releases in 2022 to offset supply disruptions caused by the Russia-Ukraine conflict.
e. Currency Movements
Since oil is traded in U.S. dollars, geopolitical tensions that weaken the dollar or create global uncertainty can influence oil prices. A weaker dollar often makes oil cheaper for non-U.S. buyers, boosting demand and raising prices.
5. OPEC and Geopolitical Strategy
The Organization of Petroleum Exporting Countries (OPEC), formed in 1960, and its extended alliance OPEC+, which includes Russia, play a pivotal role in determining oil supply and prices. The organization uses coordinated production quotas to manage global prices, often aligning decisions with geopolitical interests.
For instance:
In 2020, during the COVID-19 pandemic, OPEC+ cut production by nearly 10 million barrels per day to support collapsing prices.
In 2023, Saudi Arabia and Russia announced voluntary cuts to maintain price stability amid slowing demand and Western sanctions.
OPEC’s policies are inherently geopolitical, balancing the economic needs of producers with the political relationships among member states and major consumer nations.
6. Energy Transition and the New Geopolitics of Oil
The growing global emphasis on renewable energy and decarbonization is reshaping the geopolitical landscape of oil trading. As nations transition to cleaner energy, oil-producing countries face the challenge of maintaining revenue while managing political stability.
However, this transition also introduces new geopolitical dependencies—for example, on lithium, cobalt, and rare earth metals used in electric vehicle batteries. While demand for oil may gradually plateau, geopolitical risks remain as nations compete over new energy supply chains.
Additionally, U.S. shale production has transformed the country from a net importer to a major exporter, reducing its vulnerability to Middle Eastern geopolitics but also introducing new market dynamics. Shale producers can ramp up or scale down production relatively quickly, acting as a “shock absorber” to global price swings.
7. The Role of Technology and Market Transparency
Technological advancements in trading—especially algorithmic and data-driven models—have increased market liquidity but also heightened sensitivity to news. Real-time tracking of geopolitical developments via satellites, social media, and analytics platforms allows traders to react instantly.
For example, satellite data showing tanker movements or refinery fires can trigger immediate price adjustments. The intersection of AI, big data, and geopolitics now defines modern oil trading strategies, with traders assessing both quantitative signals and qualitative geopolitical intelligence.
8. Managing Geopolitical Risk in Oil Trading
Professional oil traders and corporations employ various strategies to manage geopolitical risks:
Diversification: Sourcing oil from multiple regions to minimize reliance on unstable producers.
Hedging: Using futures, options, and swaps to lock in prices and reduce exposure to volatility.
Scenario Analysis: Running stress tests based on potential geopolitical outcomes (e.g., war, sanctions, embargoes).
Political Risk Insurance: Protecting investments against losses due to government actions or conflict.
Strategic Reserves: Governments maintain emergency stockpiles to stabilize supply during crises.
In addition, diplomatic engagement and international cooperation—such as IEA coordination or U.N.-mediated negotiations—can help mitigate disruptions and maintain market balance.
9. The Future Outlook: Geopolitics and the Oil Market
As of the mid-2020s, the global oil market faces a new era of geopolitical uncertainty. Key issues shaping the future include:
The U.S.-China rivalry, which may influence energy trade routes and technological access.
Middle Eastern realignments, including normalization of relations between former rivals and shifting alliances.
Climate policy conflicts, as nations balance carbon reduction commitments with economic growth needs.
Sanctions regimes on Russia, Iran, and Venezuela, which continue to restrict global supply flexibility.
The digitalization of trading, which increases speed and transparency but also amplifies volatility.
Although long-term demand growth may slow due to renewable energy adoption, oil will remain a central geopolitical and economic asset for decades. The world’s dependence on energy ensures that geopolitics will continue to shape price trends, investment decisions, and market psychology.
Conclusion
Crude oil trading is not merely a reflection of supply and demand; it is a barometer of global stability and geopolitical tension. From the 1973 oil embargo to the ongoing Russia-Ukraine conflict, political decisions have repeatedly proven capable of reshaping energy markets. For traders and policymakers alike, understanding the geopolitical dimensions of oil is crucial for navigating price volatility and maintaining economic resilience.
As the energy transition accelerates, the nature of geopolitical risk will evolve—but it will not disappear. The intersection of oil, politics, and global economics will continue to define international relations and financial markets, ensuring that crude oil remains one of the world’s most geopolitically sensitive and closely watched commodities.


NIFTY Intraday Levels for 21ST Oct 2025🙏🏼 HAPPY DIWALI 🙏🏼
🕸️ Though Levels does not work properly on just 1 Hour trading, but published levels Due to GLOBAL as well as Domestic Uncertainty.
🚀 "WEEKLY Levels" mentioned in BOX format.
🌡️Plot Levels Using 3 Min, 5 Min Time frame in your Chart for Better Analysis
L#1: If the candle crossed & stays above the “Buy Gen”, it is treated / considered as Bullish bias.
L#2: Possibility / Probability of REVERSAL near RLB#1 & UBTgt
L#3: If the candle stays above “Sell Gen” but below “Buy Gen”, it is treated / considered as Sidewise. Aggressive Traders can take Long position near “Sell Gen” either retesting or crossed from Below & vice-versa i.e. can take Short position near “Buy Gen” either retesting or crossed downward from Above.
L#4: If the candle crossed & stays below the “Sell Gen”, it is treated / considered a Bearish bias.
L#5: Possibility / Probability of REVERSAL near RLS#1 & USTgt
HZB (Buy side) & HZS (Sell side) => Hurdle Zone,
*** Specialty of “HZB#1, HZB#2 HZS#1 & HZS#2” is Sidewise (behaviour in Nature)
Rest Plotted and Mentioned on Chart
Color code Used:
Green =. Positive bias.
Red =. Negative bias.
RED in Between Green means Trend Finder / Momentum Change
/ CYCLE Change and Vice Versa.
Notice One thing: HOW LEVELS are Working.
Use any Momentum Indicator / Oscillator or as you "USED to" to Take entry.
⚠️ DISCLAIMER:
The information, views, and ideas shared here are purely for educational and informational purposes only. They are not intended as investment advice or a recommendation to buy, sell, or hold any financial instruments. I am not a SEBI-registered financial adviser.
Trading and investing in the stock market involves risk, and you should do your own research and analysis. You are solely responsible for any decisions made based on this research.
"As HARD EARNED MONEY IS YOUR's, So DECISION SHOULD HAVE TO BE YOUR's".
Do comment if Helpful .
In depth Analysis will be added later (If time Permits)

Market Analysis: NIFTY50NSE:NIFTY
At present, the market is trading within a tight intraday range, reflecting a phase of consolidation under resistance after a sharp upward recovery move. The structure shows that price is currently hovering near the Resistance/Sharp Fall zone between 25,714 – 25,704, which has acted as a key barrier over the last few sessions.
This area has consistently triggered profit booking and short-term selling, making it a critical region to monitor. The Major Resistance at 25,731.50 remains the ceiling for the current move, and as long as the market continues to trade below this level, the short-term bias remains cautious to mildly bearish. Any repeated rejection here could trigger a corrective phase back toward lower supports.
On the downside, 25,668.65 stands as the 1st Support, providing the immediate buffer zone for intraday pullbacks. A sustained break below this level could accelerate momentum toward the Next Support at 25,611.55, which aligns with a structural base formed during the previous impulsive leg. If this support also gives way, the market may extend its decline toward the Major Low support at 25,566.10, which serves as a key level where buyers might attempt to absorb selling pressure.
From a broader structural view, Nifty currently appears to be forming a short-term distribution zone between 25,705 – 25,668, suggesting indecision after testing upper resistances. A decisive breakout above 25,731 would invalidate this range and potentially invite a fresh upward move, while failure to hold above 25,668 could confirm weakness and initiate a corrective leg toward 25,611 and 25,566 respectively.
🧭 Summary:
Major Resistance: 25,731.50
Resistance / Sharp Fall Zone: 25,714.75 – 25,704.70
1st Support: 25,668.65
Next Support: 25,611.55
Low / Major Support: 25,566.10
Market Tone: Neutral-to-bearish; rangebound consolidation under key resistance.
Bias: Bearish below 25,705; potential recovery only if price reclaims and sustains above 25,731.
Key Focus: Watching how price behaves within the 25,668 – 25,714 band — a breakout or breakdown from this zone will define the next short-term directional leg.

NIFTY IS READY TO EXTEND ( mother of bull market)Nifty has completed 4th wave succesfully by correcting 16% and taking more than a year of time , Now its ready for its 5th wave.
observations made in the chart ,
1) wave 1 = wave 3
2) wave counts
When wave1 = wave3
wave 5 will be extended of 1.62%
so we get target of 37,500 for last wave ( 5th) .
As per time cycle 5 th wave will end by mid 2028 to mid 2029.
we are going to witness one of the strongest of strongest bull market.

Diwali Setup: Long on Hope, Short on Doubt.Wishing you and your loved ones a Diwali filled with light, laughter, and new beginnings.
May this festival bring clarity to your path, warmth to your heart, and prosperity to your home.
🪔✨ Happy Diwali
This festive season, I’m charting more than markets—I’m charting renewal.
May your trades be guided by clarity, your risk managed with wisdom, and your journey lit with purpose.
🪔📈 #DiwaliSetup #TradingViewIndia #CandlesOfClarity #TechnicalAnalysis #FestivalOfLights
