NIFTY50.....Where are the targets?Hello Traders,
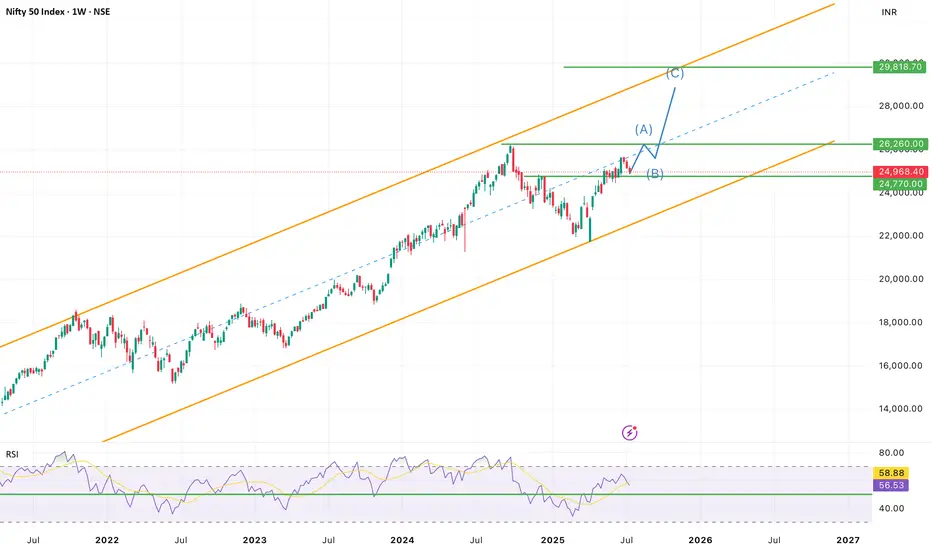
The NFTY50 failed to make new high's, but has achieved my long-term target @25577 points.
It also broke below the trend-line, connecting the high's of 25116 to 25222. This is a bearish sign!
I have labelled the chart as a w-x-y pattern, that could also morph into an a-b-c!
But what to expect for the coming sessions?
Chart analysis.
The weakness at chart is not done to my view!
In normal, a corrective move, here a possible wave ((iv)), pink, will return to a wave 4 of lower degree. So we should expect a target range at or around the 24000 points! If so to come, this would be potentially buy_area! A break to the upside is not in (my) the cards. Too much overlapping waves, buy and immediately sell-orders..... This is not how an impulse look like!
Of course; a wave iv correction can morph into a w-x-y pattern. And if so, the price would extend to an 2.618 Fibo after it was complete!
Again. The correction look like not complete, and it will be interesting how markets will answer on Monday.
So, that's it for today!
Have a great weekend.....
Ruebennnase
Please ask or comment as appropriate.
Trade on this analysis at your own risk.
Trade ideas

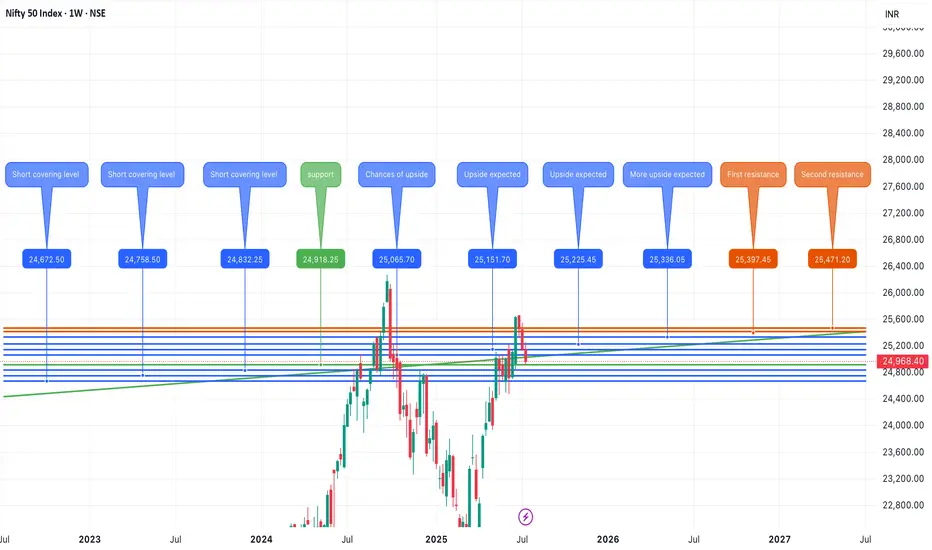
Nifty July 4th Week Analysis Nifty trend is looking unclear and closing is certainly not in favor of bulls, downside would be open upto 24700 if nifty breaches important support of 24900-830. To resume its upside momentum nifty must cross and sustain above 25150-200.
All levels are marked in the chart posted.
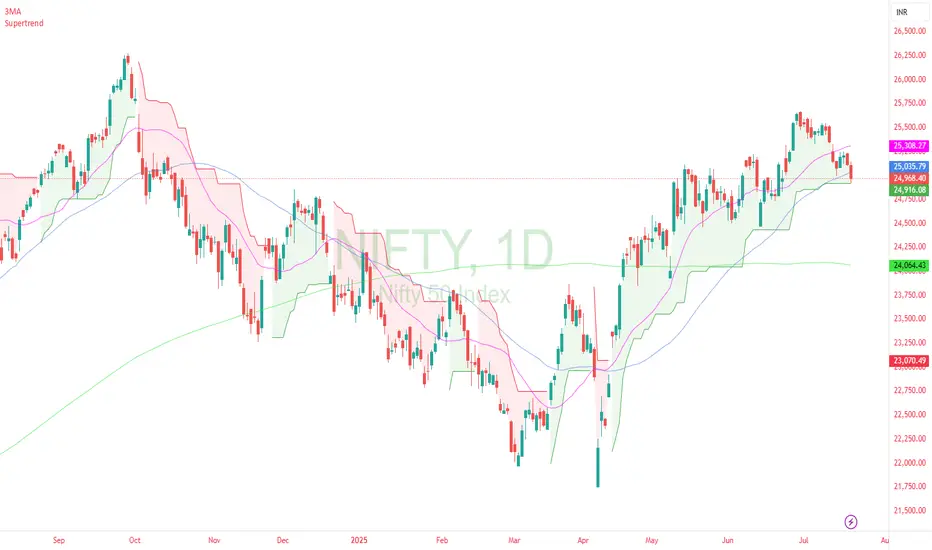
nifty dailyThis is great chart . Price is at Supertrend support on daily chart. Lowest risk in going long. Best technical chart in while .
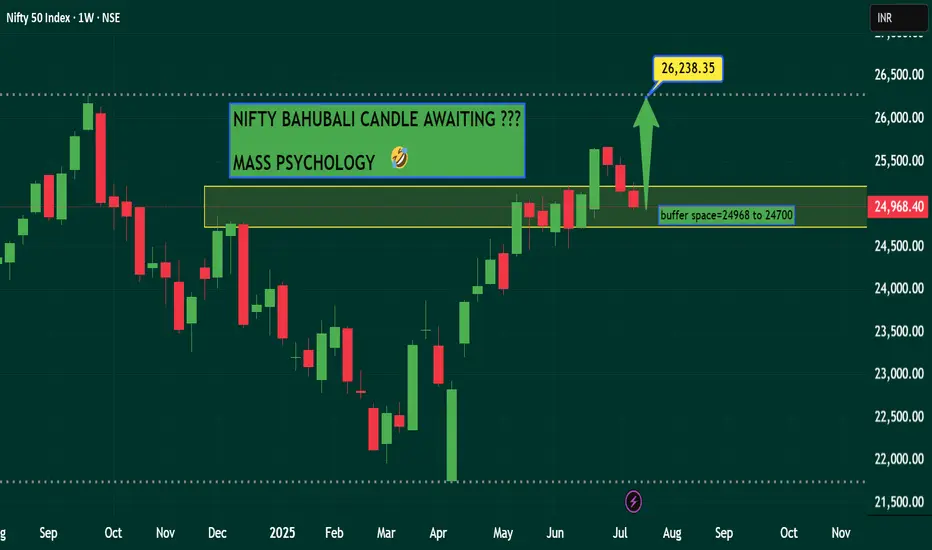
NIFTY - NEW HIGH SOON...NSE:NIFTY Weekly chart showing negative closing from last three weeks, but undertone of the market showing something big to come on price. Rsi giving positive divergence on intraday timeframes.
nifty 50 on strong momentumgood momentum seen over nifty , also on good support minor bounce can convert in to a good reversal which can lead it to supply zone or above.
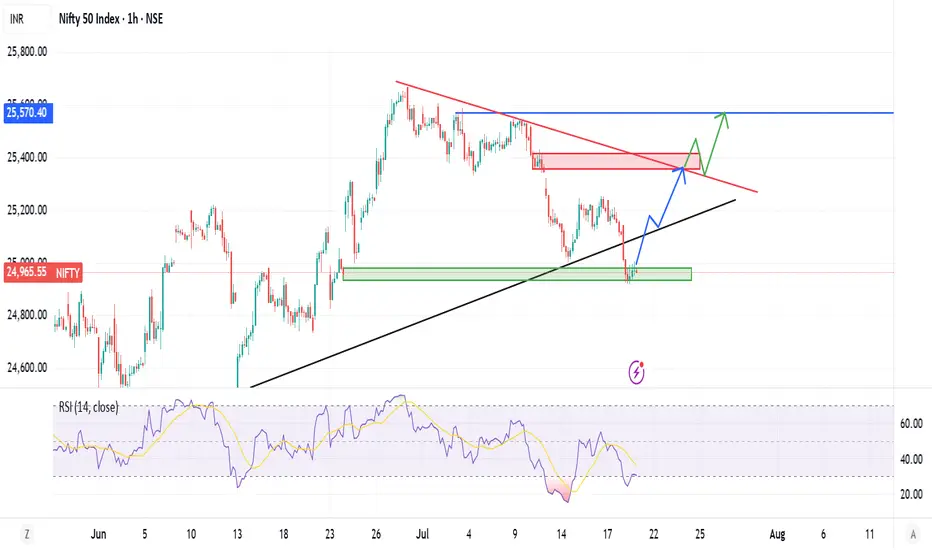
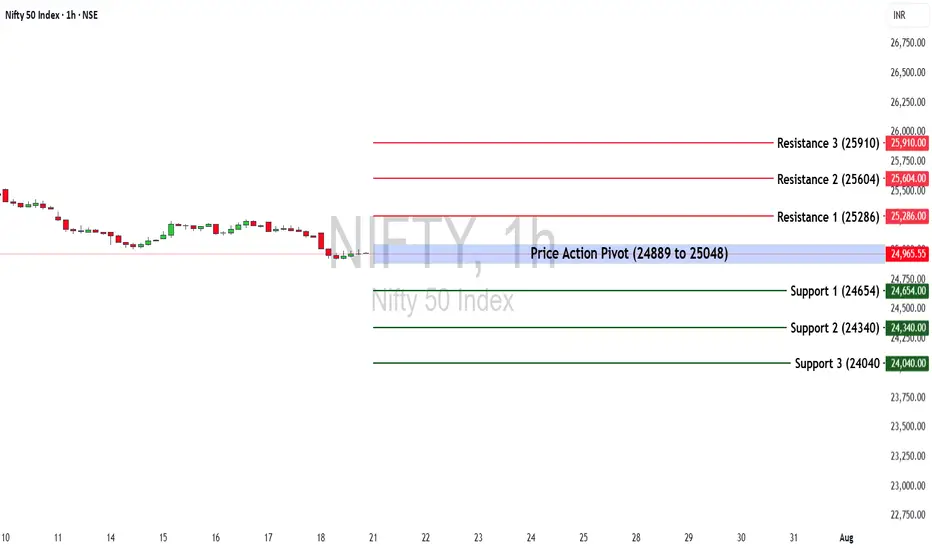
Nifty 50 at a Turning Point? Key Levels & Market Outlook AheadThe Nifty 50 ended the week at 25,149.85, posting a loss of -1.22%.
🔹 Key Levels for the Upcoming Week
📌 Price Action Pivot Zone:
24,889 to 25,048 – This is a crucial range to monitor for potential trend reversals or continuation. A breakout or breakdown from this zone can set the tone for the week.
🔻 Support Levels:
S1: 24,654
S2: 24,340
S3: 24,040
🔺 Resistance Levels:
R1: 25,286
R2: 25,604
R3: 25,910
📈 Market Outlook
✅ Bullish Scenario:
A sustained move above 25,048 (top of the pivot zone) may invite buying interest. If momentum continues, the index could test R1 (25,286) and possibly extend towards R2 (25,604) and R3 (25,910).
❌ Bearish Scenario:
Failure to hold the pivot zone and a breakdown below 24,889 could trigger further downside. The index may slide towards S1 (24,654) and deeper supports at S2 (24,340) and S3 (24,040).
Disclaimer: lnkd.in
Nifty Closes Below 25,000 — What Lies Ahead?The Indian market's recent uptrend appears to be losing momentum, as the benchmark Nifty index extended its decline for the third consecutive week, ending just below the important 25,000 mark.
This pullback has been largely driven by weakness in the Financial and IT sectors, with major players like NSE:TCS , NSE:HCLTECH , and NSE:AXISBANK posting disappointing earnings.
From a technical perspective, the index is now approaching a key support zone near 24,900. A decisive break below this level could open the door for a further slide towards 24,500.
Open Interest (OI) data reinforces this view, with the 25,000–24,900 zone seeing the highest put writing, marking it as an immediate support area. On the upside, strong call writing at 25,100 and 25,200 on Friday suggests these levels will act as immediate resistance.
Given the current structure, the outlook for the coming week remains neutral to bearish.
Traders are advised to stay cautious, manage risk effectively, and keep a close watch on these crucial levels.

nifty support levelSupport is the level at which demand is strong enough to stop the index from falling any further
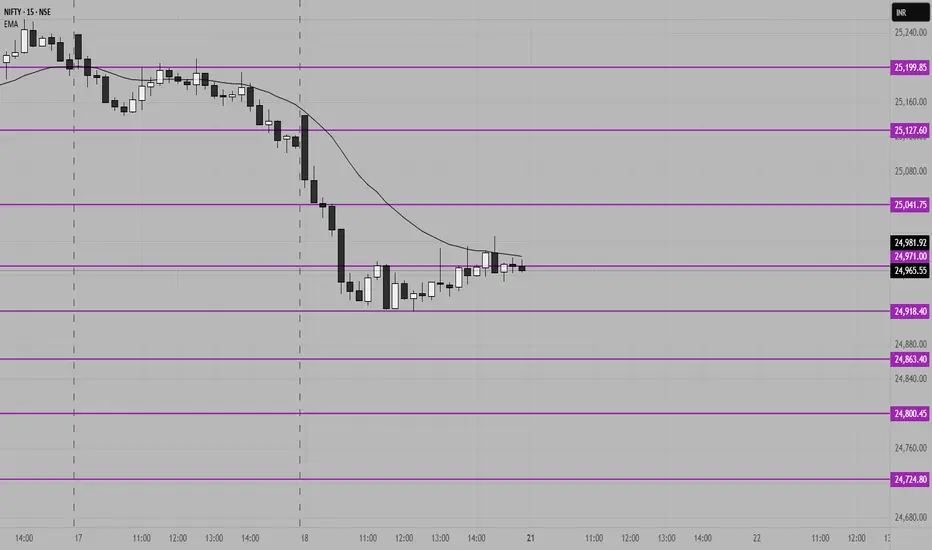
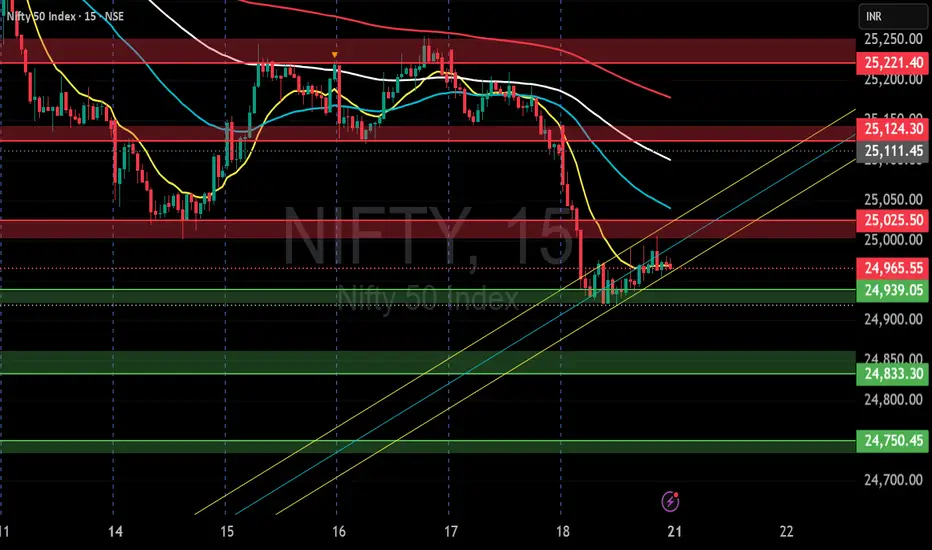
Nifty key Support and resistance levels for 21st July 2025NIFTY Key Support & Resistance for July 21st
Chart Overview:
NIFTY might consolidate after a sharp fall, currently trading around the 24,918–24,965 zone on the 15-minute chart. The price is hovering below the EMA, indicating weak momentum and hesitation in recovery.
Key Levels:
Major Resistance:
25,200 – Strong resistance zone; multiple rejections expected if tested. Watch for possible reversals or fake breakouts near this level.
Other Resistances:
* 25,127
* 25,041
Immediate Supports:
* 24,918
* 24,863
* 24,724
Outlook for July 21st:
* Failure to sustain above 24,970 could invite fresh selling toward 24,724.
* Range-bound action likely between 25,041 and 24,863 unless a strong breakout occurs.
---
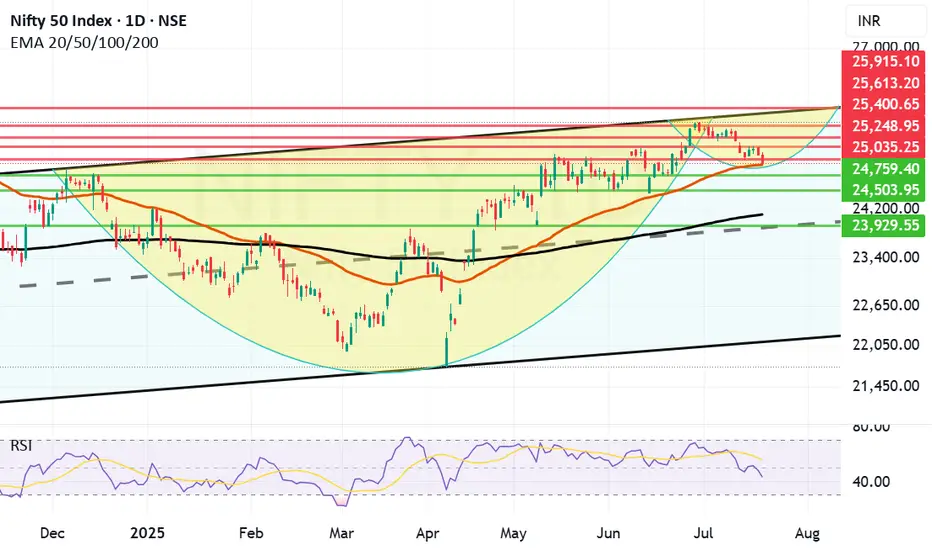
Can Reliance and Banks turn Nifty around? do or die Monday. Nifty as of now has taken support at Mother line in daily chart. As expected in my Yesterday's message. So Hopefully if Big Banks Results are in line tomorrow we might see Nifty going upwards from Monday.
Mota Bhai just announced the results. EBITDA is slightly less than expected but Net Profit and Revenue is much better than Market expectation. In my view market should react positively to this result.
Supports For Nifty remain at 24932 (Mother line), 24759, 24503. As indicated earlier if we get a closing below 24503 we may see a Fall towards 24106 or 23929 (In unlikely circumstances).
Nifty Resistances remain at: 25035, 25248, 25400 and 25613 (Channel top Resistance).
Results for tomorrow
HDFC BANK
ICICIBANK
AUSMALL BANK
RBL BANK
UNION BANK
YES BANK
CENTR BANK
PUNJA BANK
CENTR BANK
So it seems like a Do or Die Monday on cards. Shadow of the candle looks neutral as of now.
Disclaimer: The above information is provided for educational purpose, analysis and paper trading only. Please don't treat this as a buy or sell recommendation for the stock or index. The Techno-Funda analysis is based on data that is more than 3 months old. Supports and Resistances are determined by historic past peaks and Valley in the chart. Many other indicators and patterns like EMA, RSI, MACD, Volumes, Fibonacci, parallel channel etc. use historic data which is 3 months or older cyclical points. There is no guarantee they will work in future as markets are highly volatile and swings in prices are also due to macro and micro factors based on actions taken by the company as well as region and global events. Equity investment is subject to risks. I or my clients or family members might have positions in the stocks that we mention in our educational posts. We will not be responsible for any Profit or loss that may occur due to any financial decision taken based on any data provided in this message. Do consult your investment advisor before taking any financial decisions. Stop losses should be an important part of any investment in equity.
Nifty Analysis EOD – July 18, 2025 – Friday🟢 Nifty Analysis EOD – July 18, 2025 – Friday 🔴
“Deep Dive Below 25K – Bounce or Breakdown Ahead?”
As we discussed yesterday, a big move was on the cards — and Nifty delivered.
The index started flat to negative, and from the opening tick, sellers took firm control. It sharply broke through multiple key supports: PDC, PDL, S1, the important 25,080–25,060 support zone, swing low, 25,000–24,980, and even 24,965.
Buyers finally showed up near 24,920, a crucial level, and pulled off a modest 86-point recovery. The session ended at 24,968.40, still below the psychological 25,000 mark and the fractal swing low of July 14.
🕯 5 Min Time Frame Chart with Intraday Levels
🔍 Mixed Signals:
✅ Positive: Today’s low aligns with the 0.618 Fib retracement from the June 13 low to June 30 high — potential support zone.
✅ Positive: RSI(3 of 3) shows bullish divergence — early reversal sign?
❌ Negative: Closed below July 14 swing low — weak structural signal.
❌ Negative: Below 25,000 — psychological breakdown.
❓Now the big question: Will this bearish move continue, or is it a fakeout before reversal?
You're still bullish on the overall daily trend, but tactically bearish for intraday until a close above 25,125 confirms strength.
🕯 Daily Time Frame Chart For Additional View
🕯 Daily Time Frame Chart with Intraday Levels
🕯 Daily Candle Breakdown
Open: 25,108.55
High: 25,144.60
Low: 24,918.65
Close: 24,968.40
Change: −143.05 (−0.57%)
📊 Candle Structure Breakdown
Real Body: 140.15 pts → Large red bearish body
Upper Wick: 36.05 pts → rejection near early highs
Lower Wick: 49.75 pts → dip buying near 24,920
🔍 Interpretation
Mildly negative open with early strength attempt near 25,140
Sharp decline through major support zones
Buyers stepped in at 24,920, but recovery lacked follow-through
Close below 25K and key swing low confirms steady intraday selling pressure
🕯 Candle Type
Strong Bearish Candle with both wicks — sellers dominated, but not without some resistance from buyers at the lows.
📌 Key Insight
Short-term bearish momentum confirmed
24,920–24,890 is next critical support; breakdown may extend to 24,882–24,825
Bulls need to close above 25,125+ to reclaim control
🛡 5 Min Intraday Chart
⚔️ Gladiator Strategy Update
ATR: 181.56
IB Range: 126.45 → Medium IB
Market Structure: 🔴 Imbalanced
🟢 Trades Triggered:
09:42 AM – Short Trade → ✅ Trailed SL Hit Profit (R:R = 1 : 3.87)
📌 Support & Resistance Levels
Resistance Levels:
24,980 ~ 25,000
25,080 ~ 25,060
25,125
25,168
25,180 ~ 25,212
Support Levels:
24,965
24,894 ~ 24,882
24,825
24,800 ~ 24,768
💭 Final Thoughts
“Sometimes markets fall not to reverse, but to recharge.”
Today’s drop pierced major support zones, but the bounce from 0.618 Fib hints at possible resilience.
Structure needs clarity — Monday’s session will reveal whether this was a trap or fuel for bears.
✏️ Disclaimer
This is just my personal viewpoint. Always consult your financial advisor before taking any action.

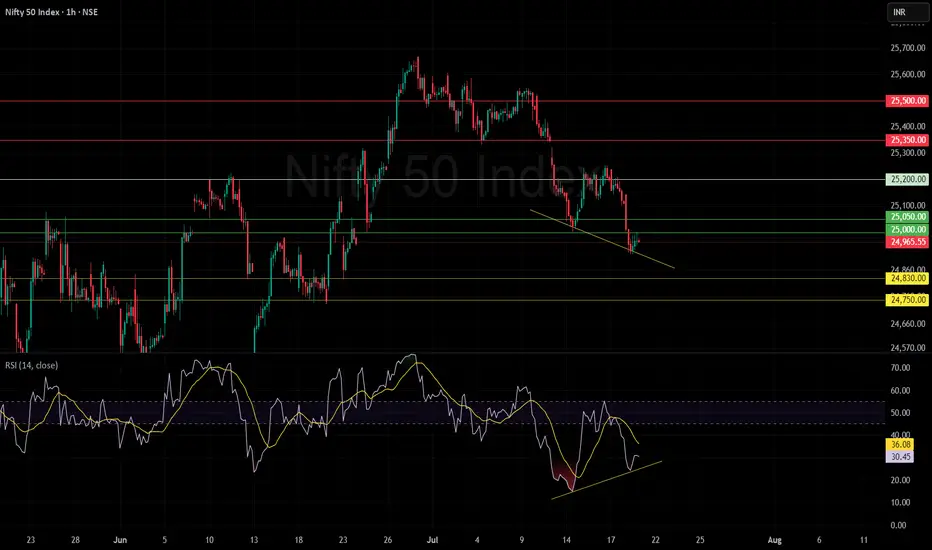
Nifty in an important/cautious zoneNIFTY 50
25,000 is the Consensus Key Level:
Most market participants are watching 25,000 as a critical psychological and technical zone. Sustaining above this keeps the market in a neutral range; a strong close above 25,200 is required for any momentum shift toward 25,350 and 25,500.
Bearish Liquidity Trap Likely:
Due to widespread focus on 25,000, a brief dip below it for 1–2 days wouldn't be surprising—this would trigger stop-losses, sweep liquidity, and potentially set up a sharp reversal if key supports like 24,830 hold.
Immediate Support and Downside Risk:
If the index sustains below 25,000, watch 24,830 first, then 24,750 and 24,500 as possible downside levels. Failure to defend these could extend the correction, but oversold RSI and positive divergence are early signals for a relief bounce.
Momentum Indicators:
RSI is near oversold (30.45) and forming bullish divergence versus price—lower lows in price but higher lows in RSI—signaling selling exhaustion and bounce potential.
Action Plan:
Stay cautious on initial dips below 25,000; this area can act as a bear trap.
Look for confirmed reversal signals (strong bullish candles, RSI upturn) especially if the price swiftly reclaims 25,000+ after liquidity grabs.
Sustained close above 25,200 = bullish setup for 25,350/25,500 targets.
Sustained trade below 24,830 signals further weakness.
Summary:
NIFTY 50 is at a make-or-break level around 25,000. Expect possible stop-loss sweeps below this area, but also be prepared for a sharp reversal if key supports and positive divergences play out. Confirmation above 25,200 flips the bias bullish; below 24,830, further slide likely
NIFTY S/R for 21/7/25Support and Resistance Levels:
Support Levels: These are price points (green line/shade) where a downward trend may be halted due to a concentration of buying interest. Imagine them as a safety net where buyers step in, preventing further decline.
Resistance Levels: Conversely, resistance levels (red line/shade) are where upward trends might stall due to increased selling interest. They act like a ceiling where sellers come in to push prices down.
Breakouts:
Bullish Breakout: When the price moves above resistance, it often indicates strong buying interest and the potential for a continued uptrend. Traders may view this as a signal to buy or hold.
Bearish Breakout: When the price falls below support, it can signal strong selling interest and the potential for a continued downtrend. Traders might see this as a cue to sell or avoid buying.
MA Ribbon (EMA 20, EMA 50, EMA 100, EMA 200) :
Above EMA: If the stock price is above the EMA, it suggests a potential uptrend or bullish momentum.
Below EMA: If the stock price is below the EMA, it indicates a potential downtrend or bearish momentum.
Trendline: A trendline is a straight line drawn on a chart to represent the general direction of a data point set.
Uptrend Line: Drawn by connecting the lows in an upward trend. Indicates that the price is moving higher over time. Acts as a support level, where prices tend to bounce upward.
Downtrend Line: Drawn by connecting the highs in a downward trend. Indicates that the price is moving lower over time. It acts as a resistance level, where prices tend to drop.
Disclaimer:
I am not a SEBI registered. The information provided here is for learning purposes only and should not be interpreted as financial advice. Consider the broader market context and consult with a qualified financial advisor before making investment decisions.
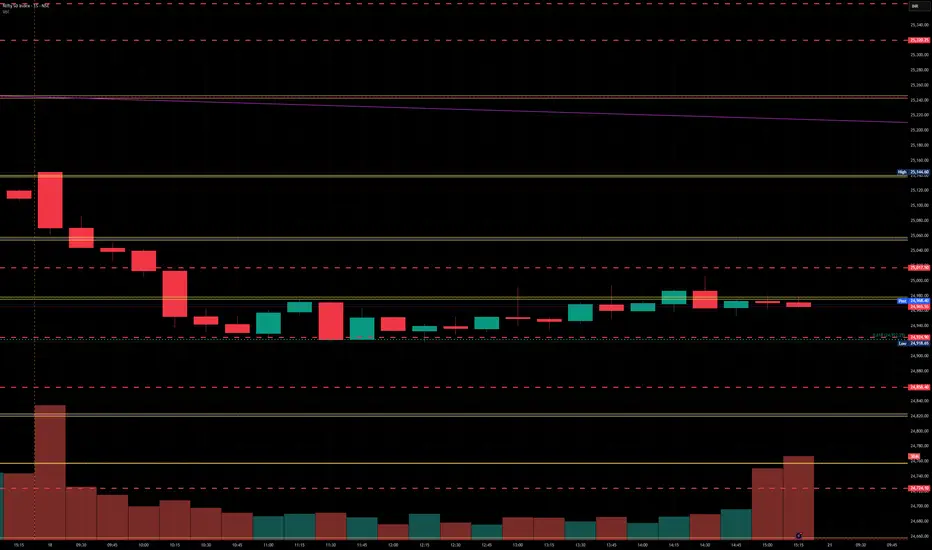
Nifty levels - Jul 21, 2025Nifty support and resistance levels are valuable tools for making informed trading decisions, specifically when combined with the analysis of 5-minute timeframe candlesticks and VWAP. By closely monitoring these levels and observing the price movements within this timeframe, traders can enhance the accuracy of their entry and exit points. It is important to bear in mind that support and resistance levels are not fixed, and they can change over time as market conditions evolve.
The dashed lines on the chart indicate the reaction levels, serving as additional points of significance to consider. Furthermore, take note of the response at the levels of the High, Low, and Close values from the day prior.
We hope you find this information beneficial in your trading endeavors.
* If you found the idea appealing, kindly tap the Boost icon located below the chart. We encourage you to share your thoughts and comments regarding it.
Wishing you success in your trading activities!
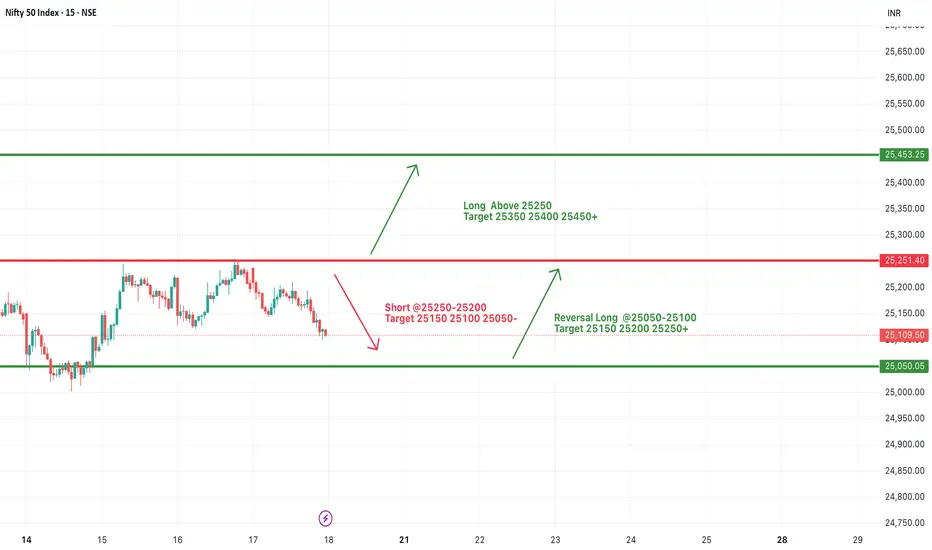
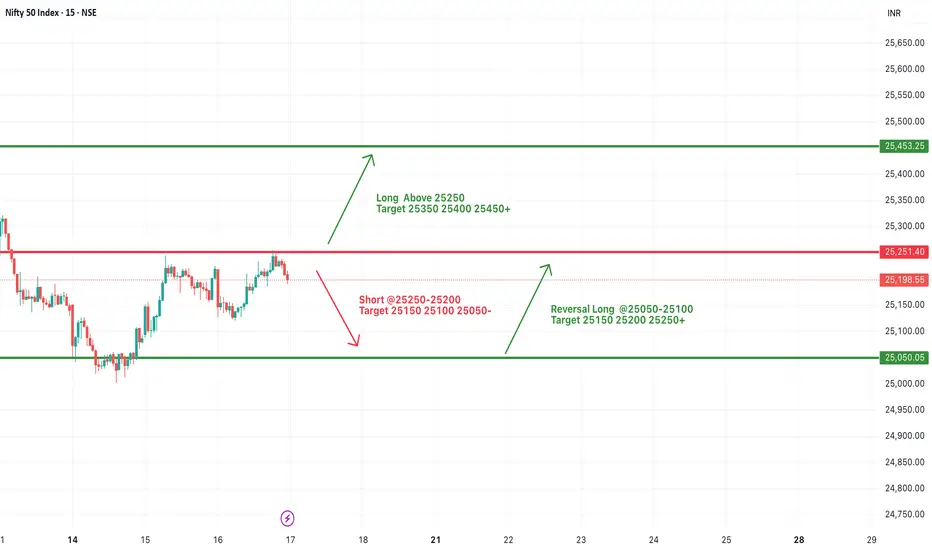
#NIFTY Intraday Support and Resistance Levels - 18/07/2025Nifty is likely to open slightly gap-up today near the 25100–25150 zone. There are no major changes from yesterday’s levels, so the same trading levels remain in focus for today’s session. If Nifty sustains above the 25250 level, we can expect an upside move toward 25350, 25400, and even 25450+ levels. This area remains a crucial resistance zone for potential bullish continuation.
On the downside, if Nifty fails to cross and sustain above 25250 and breaks below the 25200–25250 zone, we may witness a downward move with possible targets at 25150, 25100, and 25050.
A reversal long opportunity may arise in the 25050–25100 support zone if the market finds buying interest after a dip. From this level, we can expect targets around 25150, 25200, and 25250+.
The index is trading in a tight range with no fresh cues. Avoid aggressive entries and stick to level-based trades with strict stop-loss and partial profit booking.
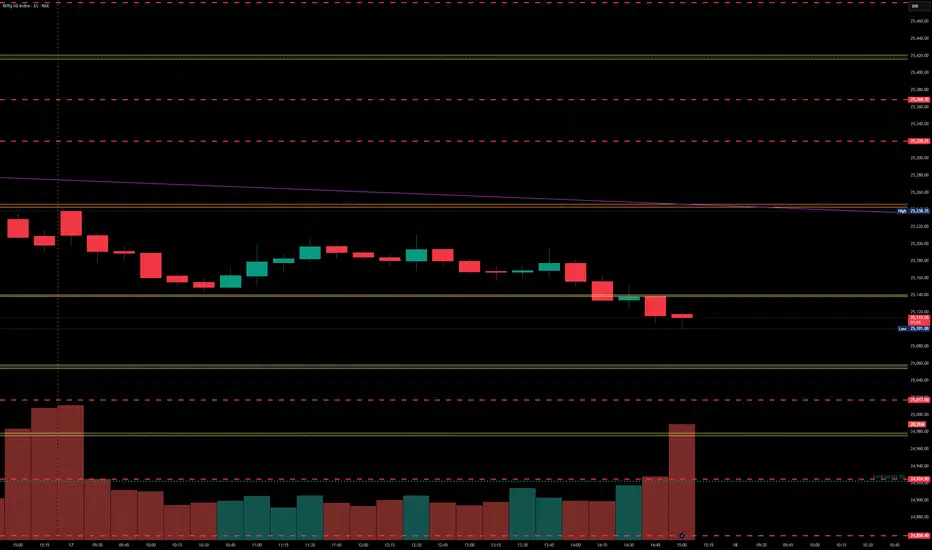
Nifty Analysis EOD – July 17, 2025 – Thursday🟢 Nifty Analysis EOD – July 17, 2025 – Thursday 🔴
📉 Sellers Grip Expiry Day — Big Move Loading?
Nifty started again with an OH (Open = High) formation and slipped down 94 points before 10:30 AM, marking the day’s low at 25,144. During this fall, it broke the support zone of 25,212 ~ 25,180. Although a retracement followed, it couldn’t sustain above the mean and eventually broke below the previous day’s low (PDL), closing at 25,111.45.
The weekly expiry was wild and volatile — especially from 12:30 to 2:30 PM. Interestingly, if we consider the total range of the last three sessions, it is just 166 points — well below average. This suggests a phase of consolidation. A significant move may emerge once Nifty decisively breaks the broader zone of 25,000 to 25,255.
🕯 5 Min Time Frame Chart with Intraday Levels
🕯 Daily Time Frame Chart with Intraday Levels
📊 Daily Candle Breakdown
Open: 25,230.75
High: 25,238.35
Low: 25,101.00
Close: 25,111.45
Change: −100.60 (−0.40%)
Candle structure breakdown:
Real body:
Red candle (Close < Open): 25,230.75 − 25,111.45 = 119.30 points → Decent-sized bearish body
Upper wick:
25,238.35 − 25,230.75 = 7.60 points → Very small
Lower wick:
25,111.45 − 25,101.00 = 10.45 points → Small
Interpretation:
Nifty opened slightly lower, made a weak attempt upward, then saw consistent selling throughout the day, closing near the session’s low. The negligible wicks indicate that sellers were in full control, and buyers had little room to fight back.
Candle Type:
A strong bearish candle (almost Marubozu) with very small wicks → Clear dominance by sellers.
Key Insight:
The test of the 25,100 zone again shows weakening bullish strength.
If the next session breaks below 25,100, the fall may extend toward 25,000–25,050.
For bulls to regain short-term momentum, a close above 25,200–25,220 is necessary.
🛡 5 Min Intraday Chart
⚔️ Gladiator Strategy Update
ATR: 176.62
IB Range: 60.85 → Medium IB
Market Structure: Balanced
Trades Triggered:
🕒 10:53 AM – Long Trade → Trailed SL Hit Profit (R:R = 1:0.42)
🧭 What’s Next? / Bias Direction
The market is coiling within a narrow range across multiple sessions, hinting at a potential breakout move.
📌 Watch Zone: 25,000 to 25,255
🔻 A break below 25,000 may open 24,950–24,900
🔺 A close above 25,260 could drive price toward 25,350+
Bias remains neutral-to-bearish unless bulls reclaim 25,220 decisively.
🧱 Support & Resistance Levels
Resistance Levels
25,168
25,180 ~ 25,212
25,260
25,295 ~ 25,315
Support Levels
25,125
25,080 ~ 25,060
25,000 ~ 24,980
24,965
🧠 Final Thoughts
"Structure is key. When levels work, respect them. When they break, adapt."
Three sessions of compression hint at expansion soon — stay alert and trade level-to-level with discipline.
✏️ Disclaimer
This is just my personal viewpoint. Always consult your financial advisor before taking any action.

If Mother Line Support will hold, we might see a C&H formation. Although we saw a negative closing today, the chart suggests that if Mother line support will hold we might see a reversal and a Cup and Handle Formation in the near future. Cup and Handle formation is a great pattern which can help us reach the previous high and surpass it. If it happens or not only time can tell.
Supports For Nifty right now remain at: 25035, 24930 (Important Mother Line Support of Daily chart), 24759 and 24503. If 24503 is broken then there will be overall weakness in the market and we can see Nifty plummeting to 24097 (Father Line Support of Daily chart). Just below 24907 there will also be the mid channel support of 23929. (Just in case we reach there).
Resistances For Nifty Remain at: 25248, 25400, 25613 and 25915 seems to be the channel top as of now.
Nifty is delicately placed and the support of 24930 and Resistance of 25248 are the key levels to be watched. Above 25248 Bulls become strong. Below 24930 Bears become strong. Right now we are in no man's land with shadow of the candle slightly negative. If we see a bounce tomorrow or from the Mother line the shadow will has potential to turn positive later in the day tomorrow or next week.
Short term Outlook: Neutral to negative.
Medium Term Outlook: Neutral to Positive.
Long Term Outlook: Positive.
Disclaimer: The above information is provided for educational purpose, analysis and paper trading only. Please don't treat this as a buy or sell recommendation for the stock or index. The Techno-Funda analysis is based on data that is more than 3 months old. Supports and Resistances are determined by historic past peaks and Valley in the chart. Many other indicators and patterns like EMA, RSI, MACD, Volumes, Fibonacci, parallel channel etc. use historic data which is 3 months or older cyclical points. There is no guarantee they will work in future as markets are highly volatile and swings in prices are also due to macro and micro factors based on actions taken by the company as well as region and global events. Equity investment is subject to risks. I or my clients or family members might have positions in the stocks that we mention in our educational posts. We will not be responsible for any Profit or loss that may occur due to any financial decision taken based on any data provided in this message. Do consult your investment advisor before taking any financial decisions. Stop losses should be an important part of any investment in equity.

Nifty levels - Jul 18, 2025Nifty support and resistance levels are valuable tools for making informed trading decisions, specifically when combined with the analysis of 5-minute timeframe candlesticks and VWAP. By closely monitoring these levels and observing the price movements within this timeframe, traders can enhance the accuracy of their entry and exit points. It is important to bear in mind that support and resistance levels are not fixed, and they can change over time as market conditions evolve.
The dashed lines on the chart indicate the reaction levels, serving as additional points of significance to consider. Furthermore, take note of the response at the levels of the High, Low, and Close values from the day prior.
We hope you find this information beneficial in your trading endeavors.
* If you found the idea appealing, kindly tap the Boost icon located below the chart. We encourage you to share your thoughts and comments regarding it.
Wishing you success in your trading activities!
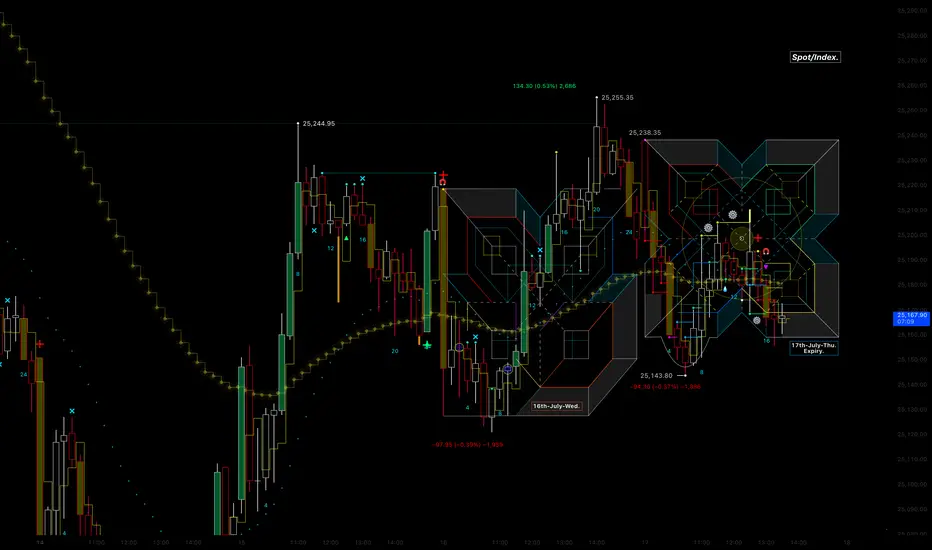
17th-July-Thu. Expiry day projection Hello Everyone
This is the projection Grid for the Expiry day Index chart/Spot (not futures)
as you can see the day started with morning drive for hour and half
good price action ,yesterday i got steamrolled and stop hit
then after 1/4 day @10:45 it put in the low and we played the reversal back up
note there was a fake news about Trumph firing Jerome powel FeD chair
turned out to be fake however needed a catalyst to take all the stops on daily timeframe
and pick it back up in to fairvalue after they take everybody out with fake news
its the game they like to play as "they" want to buy low and sell high.
little late to publish
enjoy the grid and safety first
#NIFTY Intraday Support and Resistance Levels - 17/07/2025Opening Expectation: Slight Gap-Up Around 25200
Nifty is likely to open slightly gap-up near the 25200 level, showing early signs of strength. If the index manages to sustain above the 25250 level, we may see a continuation of the upward momentum with targets around 25350, 25400, and 25450+. This zone marks the upper resistance, and a breakout with strong volume could push prices into a bullish trend for the session.
On the other hand, if Nifty faces rejection around 25250–25200 and begins to slide, a short opportunity opens up with downside targets at 25150, 25100, and 25050. Sustained weakness below these levels could intensify selling pressure. However, in case the index reverses and bounces from the 25050–25100 zone, a quick intraday long trade can be considered toward 25150, 25200, and 25250+.
Today’s bias remains slightly positive, but the session may remain volatile between key levels. Traders should focus on price action around the 25250 resistance and use trailing stop losses with strict risk control.
#Nifty directions and levels for July 17thGood morning, Friends! 🌞
Here are the market directions and levels for July 17th:
There have been no major changes in the global market; it continues to maintain a moderately bearish sentiment.
Meanwhile, our local market is showing a moderately bullish tone on the lower time frame. Today, Gift Nifty is indicating a neutral to slightly gap-up start.
So, what can we expect today?
In the previous session, both Nifty and Bank Nifty moved with ups and downs. Structurally, the sentiment still remains the same.
Even if the market opens with a gap-up, we can expect some rejection near immediate resistance.
So, my expectation is that the market may behave similarly to the previous session.
If it starts with a pullback, we may see rejection afterward.
On the other hand, if it starts with a decline, we can expect a pullback later.
The key point to note is that clear directional moves are likely only if a strong candle forms after consolidation.

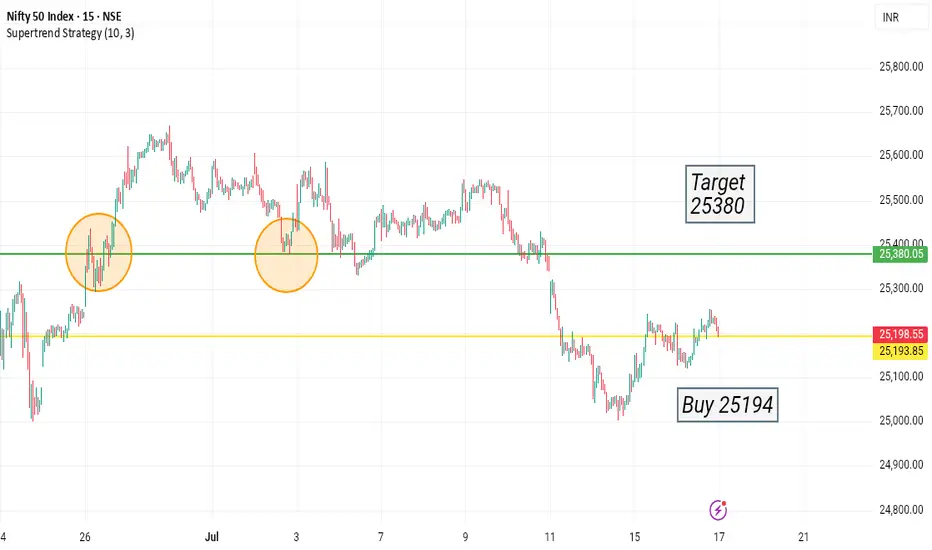
Target range 25380 to 25390carefully entry 25194 crucial resistance and also support trend line
current market price -25212
stoploss your choice
I am not sebi register
is own idea only
Nifty Analysis EOD – July 16, 2025 – Wednesday🟢 Nifty Analysis EOD – July 16, 2025 – Wednesday 🔴
"Bounce Back with Caution: Bulls Show Up, But Still Not in Full Control"
Nifty started the day on a flat note, but the opening candle turned out to be the day’s high, and from there, it quickly lost 91 points, marking the day’s low at 25,121 within the first hour. The early pressure gave a bearish opening tone, but bulls gradually stepped in.
Around 11:45 AM, Nifty broke above the VWAP–Day Low range, crossed the CPR zone, and then pushed toward PDH. It did make one attempt to break PDH, but failed, resulting in a slow drift downward toward VWAP and CPR into the close. The day ended at 25,212.05, nearly at CPR — a zone of indecision.
📉 The structure shows sharp reversal from the lows, but also clear hesitation near resistance zones. The session was volatile, forming a typical pre-expiry pattern with mixed sentiment. Bulls must take charge tomorrow by crossing the 25,250–25,260 zone to regain strength.
🕯 5 Min Time Frame Chart with Intraday Levels
🕯 Daily Time Frame Chart with Intraday Levels
🕯 Daily Candle Breakdown
Open: 25,196.60
High: 25,255.30
Low: 25,121.05
Close: 25,212.05
Change: +16.25 (+0.06%)
📊 Candle Structure Breakdown
Real Body: 15.45 points → small green body
Upper Wick: 43.25 points
Lower Wick: 75.55 points → significant downside recovery
🔍 Interpretation
Market opened flat, dropped quickly to test 25,120 zone
Strong buying emerged after initial fall
Buyers lifted the index above CPR, but failed to hold breakout above PDH
Candle closes with long lower wick → buyers defended dip, but lacked closing dominance
🕯 Candle TypeSpinning Top with Long Lower Wick — often a neutral to mildly bullish candle, suggesting buying interest at lower levels, but with uncertain momentum.
📌 Key Insight
Bulls clearly defended the 25,120–25,125 support zone
Momentum will only resume above 25,250–25,260, leading to targets around 25,300–25,315
Failure to hold 25,120 could reopen downside toward 25,000–25,050
🛡 5 Min Intraday Chart
⚔️ Gladiator Strategy Update
ATR: 180.99
IB Range: 91.20 → Medium IB
Market Structure: 🟡 Balanced
Trades Triggered
11:34 AM – Long Trade → ✅ Target Achieved, Trailed SL Hit (R:R 1:2.42)
📌 Support & Resistance Zones
Resistance Levels
25,168
25,180 ~ 25,212
25,260
25,295 ~ 25,315
Support Levels
25,125
25,080 ~ 25,060
25,000 ~ 24,980
24,965
💭 Final Thoughts
“Structure is forming — but conviction is lacking. Let expiry day bring clarity. Above 25,260 we fly, below 25,120 we fall.”
✏️ Disclaimer
This is just my personal viewpoint. Always consult your financial advisor before taking any action.
