Nifty updateNifty Update (16 July 2025) 📈
Nifty is range bounded after a rebound from the support zone of 25,000–25,050 and closed positively ✅
It crossed above the initial target of 25,200 and approached the resistance zone near 25,350
🔹 Support: 25,000–25,050 (key for dip-buying opportunities)
🔹 Resistance: 25,350 (next immediate hurdle)
Trade ideas
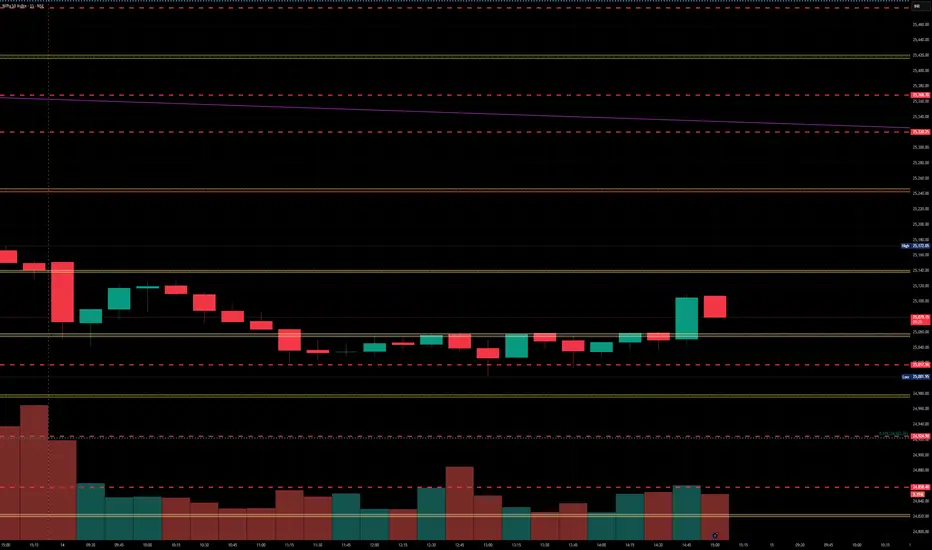
Nifty levels - Jul 17, 2025Nifty support and resistance levels are valuable tools for making informed trading decisions, specifically when combined with the analysis of 5-minute timeframe candlesticks and VWAP. By closely monitoring these levels and observing the price movements within this timeframe, traders can enhance the accuracy of their entry and exit points. It is important to bear in mind that support and resistance levels are not fixed, and they can change over time as market conditions evolve.
The dashed lines on the chart indicate the reaction levels, serving as additional points of significance to consider. Furthermore, take note of the response at the levels of the High, Low, and Close values from the day prior.
We hope you find this information beneficial in your trading endeavors.
* If you found the idea appealing, kindly tap the Boost icon located below the chart. We encourage you to share your thoughts and comments regarding it.
Wishing you success in your trading activities!
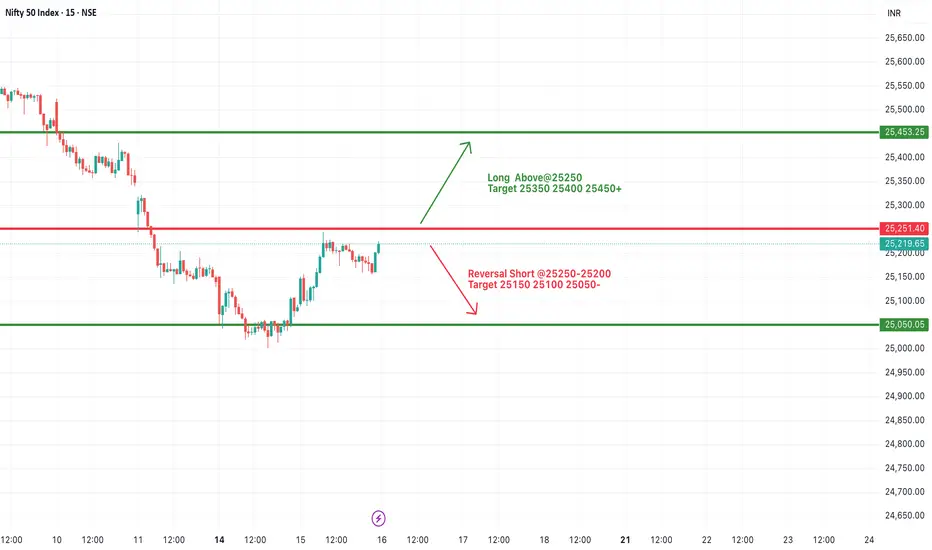
#NIFTY Intraday Support and Resistance Levels - 16/07/2025Nifty is likely to open flat near the 25200 mark, with the index currently hovering just below a key resistance zone of 25250. A decisive breakout above 25250 may provide momentum for a further upside rally toward 25350, 25400, and possibly 25450+. This level has acted as resistance in the past, so sustaining above it will be crucial for any bullish continuation.
On the flip side, 25250–25200 is also a potential reversal zone. If Nifty fails to break and sustain above it, then sellers may take control, and the index could see a pullback toward the immediate support levels of 25150, 25100, and 25050.
Since the index is near a crucial breakout/rejection point, early session price action will determine the direction.
Nifty Analysis EOD – July 15, 2025 – Tuesday🟢 Nifty Analysis EOD – July 15, 2025 – Tuesday 🔴
"Buyers Step Back with Conviction, Reclaim Lost Ground"
Nifty began the session with a flat-to-positive tone, and the first 5-minute candle confidently added 60 points, pushing the index toward 25,150 – aligning with the Previous Day High (PDH). However, the level couldn't hold on the first attempt and Nifty slipped back to the day's open. After a brief consolidation, bulls made a strong comeback.
The second push broke through the PDH, Day High, and the resistance zone of 25,180–25,212, and extended the move up to mark the day’s high at 25,245.20. Post that, the index hovered above the breakout zone and closed solidly at 25,195.80, showing strength and follow-through.
📈 The day’s structure was clean and directional — a healthy bounce and hold above critical levels, reinforcing the idea that buyers are regaining control after last week’s consolidation and weakness.
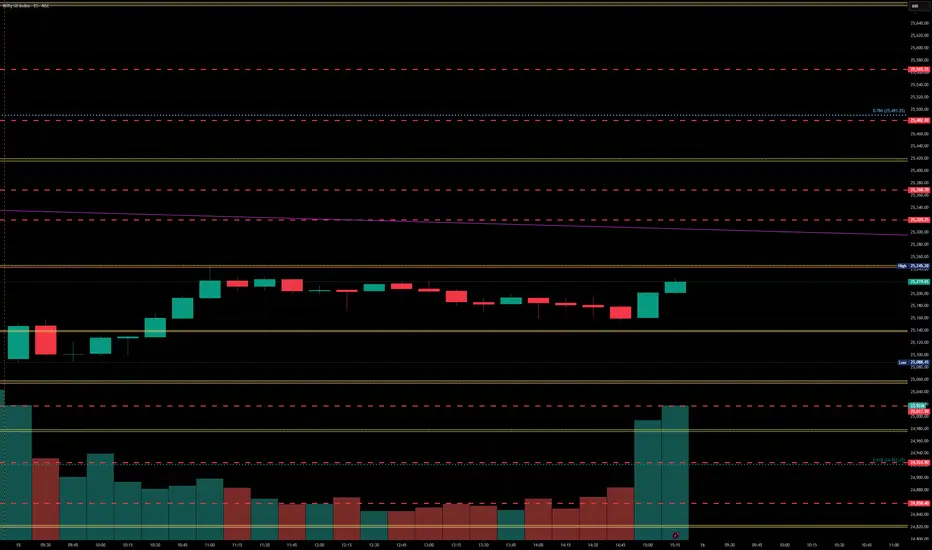
🕯 5 Min Time Frame Chart with Intraday Levels
🕯 Daily Time Frame Chart with Intraday Levels
🕯 Daily Candle Breakdown
Open: 25,089.50
High: 25,245.20
Low: 25,088.45
Close: 25,195.80
Change: +113.50 (+0.45%)
📊 Candle Structure Breakdown
Real Body: 106.30 points – strong green bullish body
Upper Wick: 49.40 points – profit-taking or resistance at highs
Lower Wick: 1.05 points – negligible dip from open
🔍 Interpretation
Opened flat and quickly built momentum.
Temporary pullback in first 15 minutes was bought into strongly.
Closed with a clean green body, showing clear intraday bullish intent.
Holding above the 25,180–25,212 zone is a big win for bulls.
🕯 Candle Type
Bullish Marubozu-like (strong green body with minimal lower wick) — shows conviction and potential start of a new upswing post recent chop.
📌 Key Insight
25,080–25,100 is now a key base and must be protected.
If Nifty can break and hold above 25,240–25,250, a move toward 25,295–25,315 looks likely.
Failure to hold above 25,180 would be first sign of hesitation.
🛡 5 Min Intraday Chart
⚔️ Gladiator Strategy Update
ATR: 186.18
IB Range: 67.35 → Medium IB
Market Structure: 🟢 Balanced
Trades Triggered
10:30 AM – Long Trade → ✅ Target Achieved, Trailed SL (R:R 1:2.48)
📌 Support & Resistance Zones
Resistance Levels
25,168
25,180 ~ 25,212
25,260
25,295 ~ 25,315
Support Levels
25,125
25,080 ~ 25,060
25,000 ~ 24,980
24,965
💭 Final Thoughts
"Trend is nothing without follow-through — today buyers showed up, but tomorrow they must push past 25,250 to prove it wasn't just a bounce."
✏️ Disclaimer
This is just my personal viewpoint. Always consult your financial advisor before taking any action.

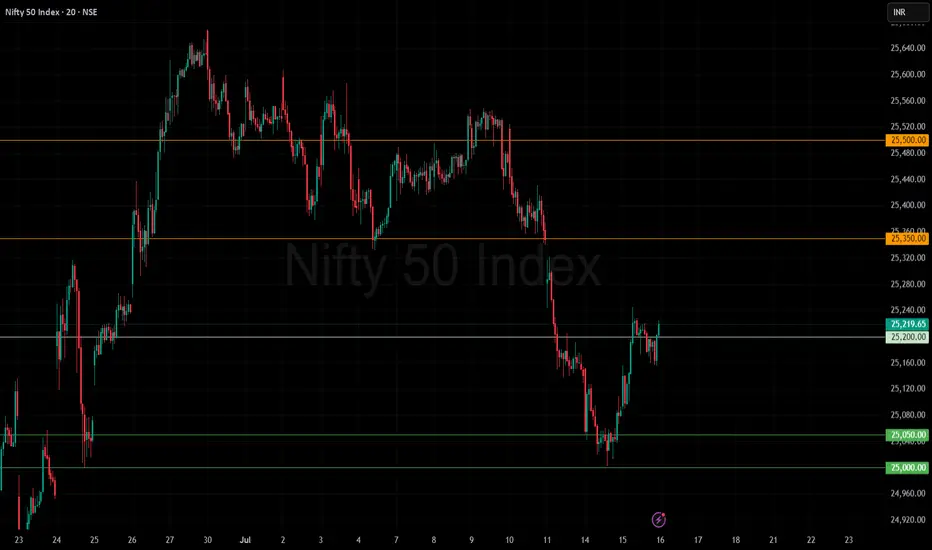
Nifty bounced from support and looking in some momentumNifty Update (15 July 2025) 📈
Nifty bounced back from yesterday’s support zone 25,000 and closed in green ✅
Crossed above the first target and finished near the resistance zone of 25,200
🔹 Support: 25,000–25,050 (watch this zone for dip-buying opportunities)
🔹 Resistance: 25,200 (current hurdle)
🚀 If Nifty sustains above 25,200:
Next upside targets 👉 25,350
Further upside: 25,500
ℹ️ On the downside: 25,000–25,050 remains the key support. Breaking below could lead to more weakness.
Stay alert, keep stop-losses in place, and watch for a breakout above 25,200 to catch momentum!
👉 Follow Navonnati Market Insights (@navonnatimarket) on X for more updates and analysis!
Moving Average Moving average has only one principle, solve the problem, earn money,Do not take the trade until the moving averages converge

Nifty levels - Jul 16, 2025Nifty support and resistance levels are valuable tools for making informed trading decisions, specifically when combined with the analysis of 5-minute timeframe candlesticks and VWAP. By closely monitoring these levels and observing the price movements within this timeframe, traders can enhance the accuracy of their entry and exit points. It is important to bear in mind that support and resistance levels are not fixed, and they can change over time as market conditions evolve.
The dashed lines on the chart indicate the reaction levels, serving as additional points of significance to consider. Furthermore, take note of the response at the levels of the High, Low, and Close values from the day prior.
We hope you find this information beneficial in your trading endeavors.
* If you found the idea appealing, kindly tap the Boost icon located below the chart. We encourage you to share your thoughts and comments regarding it.
Wishing you success in your trading activities!
NIFTY S/R for 16/7/25Support and Resistance Levels:
Support Levels: These are price points (green line/shade) where a downward trend may be halted due to a concentration of buying interest. Imagine them as a safety net where buyers step in, preventing further decline.
Resistance Levels: Conversely, resistance levels (red line/shade) are where upward trends might stall due to increased selling interest. They act like a ceiling where sellers come in to push prices down.
Breakouts:
Bullish Breakout: When the price moves above resistance, it often indicates strong buying interest and the potential for a continued uptrend. Traders may view this as a signal to buy or hold.
Bearish Breakout: When the price falls below support, it can signal strong selling interest and the potential for a continued downtrend. Traders might see this as a cue to sell or avoid buying.
MA Ribbon (EMA 20, EMA 50, EMA 100, EMA 200) :
Above EMA: If the stock price is above the EMA, it suggests a potential uptrend or bullish momentum.
Below EMA: If the stock price is below the EMA, it indicates a potential downtrend or bearish momentum.
Trendline: A trendline is a straight line drawn on a chart to represent the general direction of a data point set.
Uptrend Line: Drawn by connecting the lows in an upward trend. Indicates that the price is moving higher over time. Acts as a support level, where prices tend to bounce upward.
Downtrend Line: Drawn by connecting the highs in a downward trend. Indicates that the price is moving lower over time. It acts as a resistance level, where prices tend to drop.
Disclaimer:
I am not a SEBI registered. The information provided here is for learning purposes only and should not be interpreted as financial advice. Consider the broader market context and consult with a qualified financial advisor before making investment decisions.

Technical Analysis Forecast for NIFTY50 (25,191) (UTC+4) 1:11PM
1. Candlestick Patterns
Recent Structure:
If NIFTY50 closed near 25,191 with a long upper wick (shooting star/gravestone doji), it signals rejection at higher levels → bearish reversal potential.
A bullish engulfing/marubozu candle would indicate strength → upside continuation.
Key Observation: Watch for confirmation candles. A close below 25,000 invalidates bullishness.
2. Harmonic Patterns
Potential Setups:
Bullish Bat Pattern: If 25,191 aligns with the 0.886 retracement of a prior up-move (e.g., 24,800 → 25,191), it suggests a reversal zone for longs.
Bearish Crab: If 25,191 is the 1.618 extension of a prior swing, expect resistance → pullback to 24,900-25,000.
Action: Validate with Fibonacci levels. Break above 25,250 negates bearish harmonics.
3. Elliott Wave Theory
Wave Count:
Scenario 1 (Bullish): If in Wave 3 (impulse), 25,191 could extend to 25,500 (Wave 3 = 1.618x Wave 1).
Scenario 2 (Bearish): If in Wave B (corrective), 25,191 may peak → Wave C drop to 24,600 (Wave A = Wave C).
Confirmation: A break below 24,950 supports Wave C; hold above 25,100 favors Wave 3.
4. Wyckoff Method
Phase Analysis:
Distribution?: If volume spiked at 25,191 without further upside, it suggests "upthrust" (smart money exiting) → downside to 24,700 (accumulation zone).
Re-accumulation?: If consolidating near 25,191 on low volume, expect breakout toward 25,400.
Key Sign: Watch for springs (false breakdowns) or upthrusts (false breakouts).
5. W.D. Gann Theory
Price & Time Squaring:
25,191 is near 25,200 (a Gann square number). Close above 25,200 opens 25,500 (next resistance).
Time Cycle: July 15–20 is a potential turning window (watch for reversals).
Gann Angle: Trade above 1x1 angle (e.g., 45° from June low) = bullish momentum.
6. Indicator Synthesis (RSI + BB + VWAP)
RSI (14-period):
>70: Overbought → pullback likely if diverging (e.g., price highs ↑, RSI ↓).
<50: Loss of momentum → risk of deeper correction.
Bollinger Bands (20,2):
Price near upper band → overextended → mean-reversion to middle band (25,000) possible.
"Squeeze" (narrow bands) → impending volatility breakout.
VWAP (Daily):
Price above VWAP = intraday bullish bias. A dip to VWAP (~24,950) is a buy opportunity.
Price below VWAP = bearish control → sell rallies.
Intraday/Swing Outlook
Bullish Case (Hold above 25,100):
Target: 25,400 (Elliott Wave 3 + Gann resistance).
Trigger: Bullish candle close + RSI holding 60.
Bearish Case (Break below 25,000):
Target: 24,700 (Wyckoff accumulation + BB lower band).
Trigger: Bearish harmonic confirmation + RSI divergence.
Key Levels
Type Level Significance
Support 25,000 Psychological + BB middle band
24,700 Wyckoff accumulation zone
Resistance 25,191-25,200 Current price + Gann square
25,400 Elliott Wave 3 target
Trading Strategy
Intraday:
Long if holds 25,050-25,100 with RSI >50. Stop loss: 24,950. Target: 25,250.
Short if breaks 25,000 on high volume. Stop loss: 25,150. Target: 24,800.
Swing:
Wait for daily close above 25,200 (bullish) or below 24,950 (bearish).
Hedge with options: Buy 25,200 Calls + 25,000 Puts for volatility breakout.
Conclusion
25,191 is a pivotal level. The confluence of:
Harmonic resistance + Gann square at 25,200,
RSI near overbought territory,
Price testing BB upper band,
suggests short-term consolidation/pullback is likely. However, a daily close above 25,200 ignites bullish momentum toward 25,500. Trade the breakout/breakdown with confirmation.
*Disclaimer: This analysis is time-sensitive (as of July 15, 2025). Monitor real-time volume/price action for validation.*
For those interested in further developing their trading skills based on these types of analyses, consider exploring the mentoring program offered by Shunya Trade.
I welcome your feedback on this analysis, as it will inform and enhance my future work.
Regards,
Shunya Trade
⚠️ Disclaimer: This post is educational content and does not constitute investment advice, financial advice, or trading recommendations. The views expressed here are based on technical analysis and are shared solely for informational purposes. The stock market is subject to risks, including capital loss, and readers should exercise due diligence before investing. We do not take responsibility for decisions made based on this content. Consult a certified financial advisor for personalized guidance.

NIFTY 2HNifty is currently trading around the 25,200 level and has formed a symmetrical triangle pattern on the chart, which typically indicates a period of consolidation before a major move. This pattern reflects a balance between buyers and sellers, with price making lower highs and higher lows, gradually converging towards the apex. A breakout from this triangle, especially with strong volume, signals the potential start of a new trend. In this case, if the breakout sustains and is followed by a successful retest of the breakout zone as support, it strengthens the bullish outlook. Based on technical projections, there is a strong possibility that Nifty could rally towards the 28,000 level, marking a significant upside move from the current range. However, traders should monitor volume and price action closely to confirm the breakout's strength.
Disclaimer: The information provided is for educational and informational purposes only and should not be considered as financial advice. Investing in the stock market involves risk, and past performance is not indicative of future results. Please consult with a certified financial advisor or conduct your own research before making any investment decisions. We are not responsible for any losses incurred as a result of using this information. Stock market investments are subject to market risks; read all related documents carefully.

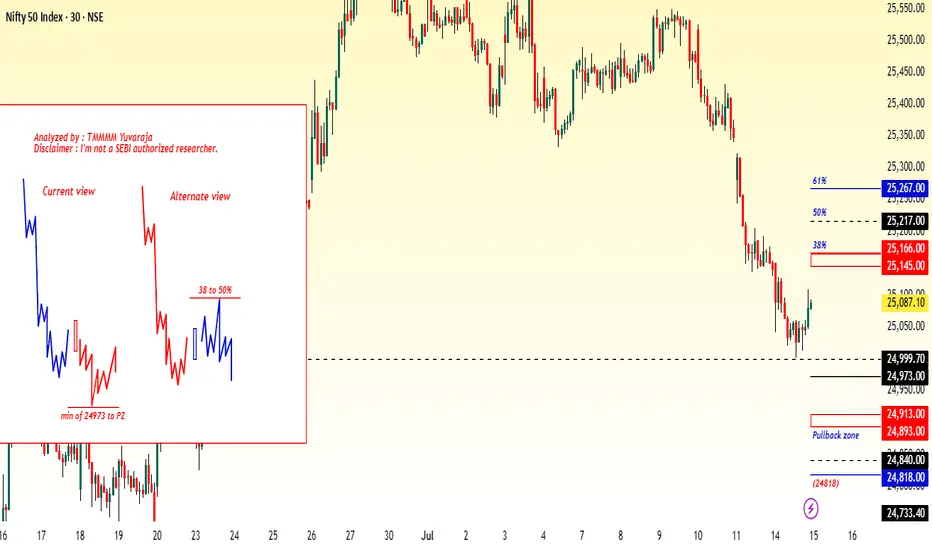
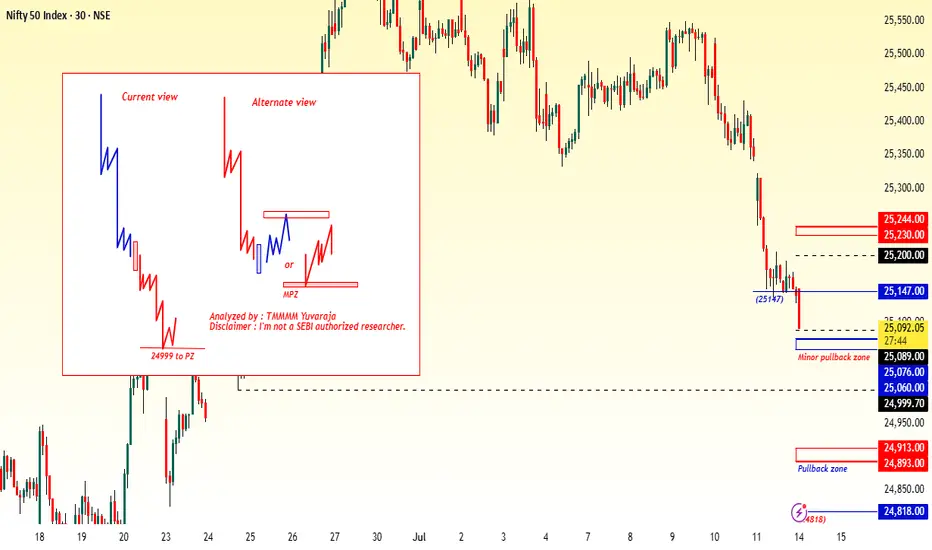
#Nifty directions and levels for July 15th:Good morning, Friends! 🌞
Here are the market directions and levels for July 15th:
There have been no major changes in the global market; it continues to maintain a moderately bearish sentiment, and our local market is also reflecting the same tone. Today, Gift Nifty is indicating a neutral to slightly gap-up start.
So, what can we expect today?
Current View:
Structurally, we are still in a minor downtrend. So, if the market fails to sustain the neutral start, we can expect a minor correction in the initial stage.
if the correction comes with a solid structure or the price consolidates around the immediate support, then the correction is likely to continue.
On the other hand, if the correction reaches the support with gradual moves, then the support may hold, and we can expect a minor pullback with a bearish bias.
Alternate View:
If the market takes a pullback, we can expect a maximum of 38% to 50% retracement on the upside. However, since we are still in a downtrend, once the pullback starts correcting again, we may expect a range-bound market or further correction, similar to what we saw in the last session.
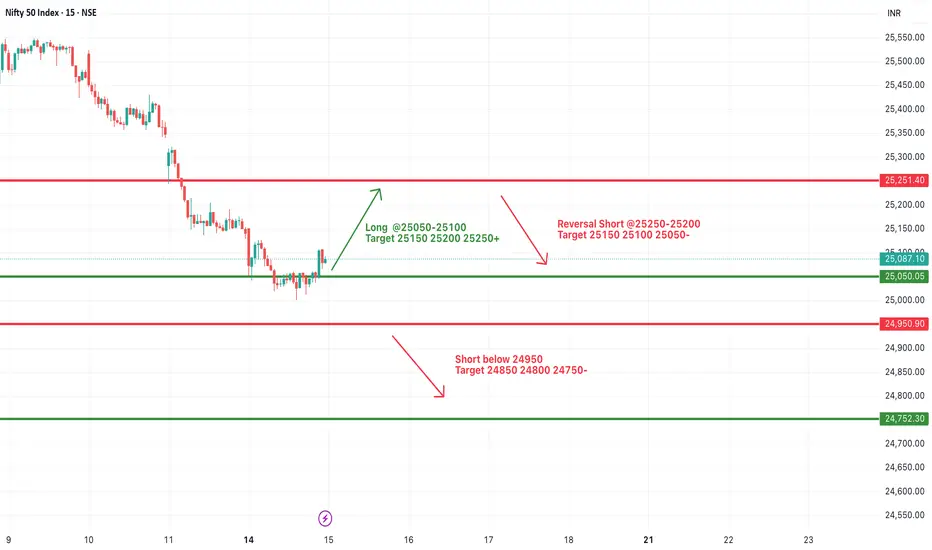
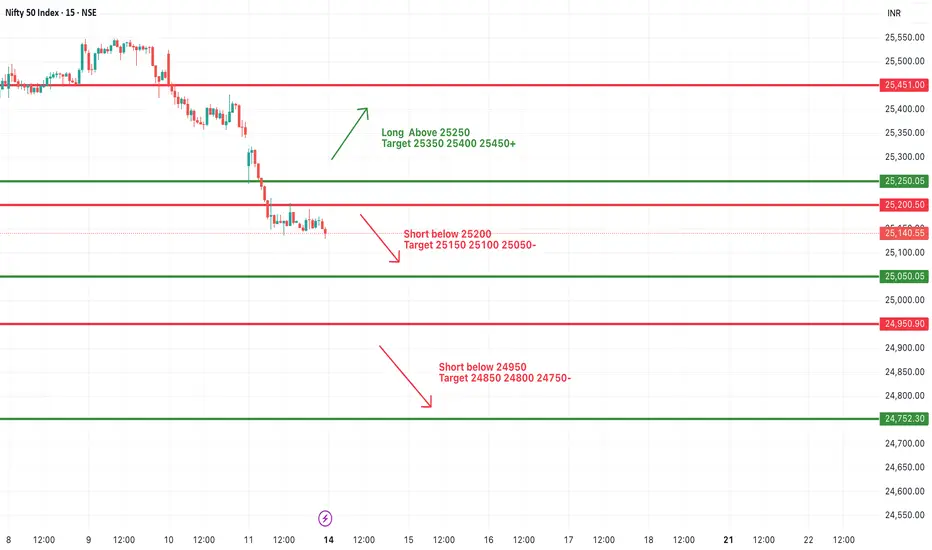
#NIFTY Intraday Support and Resistance Levels - 15/07/2025Nifty is expected to open with a gap-up today near the 25050–25100 zone. If the index sustains above this level after the opening, bullish momentum could follow with potential upside targets of 25150, 25200, and 25250+. This zone will act as the key intraday support-turned-demand area.
However, if Nifty struggles to hold above 25200–25250 and shows signs of reversal from this zone, we might witness selling pressure. A rejection from this region could lead to a pullback toward 25150, 25100, and 25050 levels.
On the downside, a breakdown below 24950 will signal further weakness. If that level is breached decisively, it can lead to sharp downside movements toward 24850, 24800, and even 24750. This would indicate a reversal of early bullish sentiment.
Today’s session could remain volatile around key levels. It’s advisable to watch price action around the 25050–25250 range for intraday confirmation before taking directional trades.
Nifty Analysis EOD – July 14, 2025 – Monday🟢 Nifty Analysis EOD – July 14, 2025 – Monday 🔴
"Broken Support, Fought Resistance – Tug of War in Play"
Nifty began the day with a classic Open = High (OH) setup, instantly rejecting any bullish intent. The crucial support zone of 25,080–25,060 was taken out early, and the market went on to mark the day's low at 25,001.95, a level that quickly turned into a decisive battleground.
After a bounce from the low, 25,125 emerged as a stiff resistance that pushed the index back below the broken support zone. For most of the session, the same support zone turned into resistance — a textbook polarity flip. However, in the final hour, Nifty showed resilience and finally closed back above 25,080, ending the session at 25,082.30.
🔄 The structure was full of failed intraday breakouts, signaling confusion and conflict — likely fueled by a wider CPR, imbalanced market structure, and medium IB of 109 pts. It was a low-volatility session, but packed with psychological tests.
🕯 5 Min Time Frame Chart with Intraday Levels
🕯 Daily Time Frame Chart with Intraday Levels
🕯 Daily Candle Breakdown
Open: 25,149.50
High: 25,151.10
Low: 25,001.95
Close: 25,082.30
Change: −67.55 (−0.27%)
📊 Candle Structure Breakdown
Real Body: 67.20 points – small to moderate bearish body
Upper Wick: 1.60 points – negligible upside attempt
Lower Wick: 80.35 points – strong defense from day’s low
🔍 Interpretation
Opened higher but got instantly rejected (OH formation).
Sellers took charge early but failed to hold momentum all the way.
The long lower wick reflects buyer presence at key 25,000 zone.
The close below open but above reclaimed support suggests tug of war — with bulls slightly redeeming themselves by EOD.
🕯 Candle Type
Hammer-like red candle — while bearish on close, the long lower shadow indicates potential exhaustion of selling and hints at reversal if follow-through buying emerges next session.
📌 Key Insight
25,000–25,020 has emerged as crucial near-term support.
A strong open or close above 25,150–25,180 may confirm a bullish reversal setup.
Breakdown below 25,000 opens the door for a fall toward 24,950 or lower.
🛡 5 Min Intraday Chart
⚔️ Gladiator Strategy Update
ATR: 188.77
IB Range: 109.20 → Medium IB
Market Structure: 🔴 Imbalanced
Trades Triggered
09:50 AM – Long Trade → ❌ SL Hit
01:05 PM – Short Trade → ❌ SL Hit
📉 Tough day for directional trades — false breakouts dominated.
📌 Support & Resistance Zones
Resistance Levels
25,125
25,168
25,180 ~ 25,212
25,260
25,295 ~ 25,315
Support Levels
25,080 ~ 25,060
25,000 ~ 24,980
24,965
💭 Final Thoughts
“Reclaimed ground doesn’t mean victory – yet. Watch the next move. Rejection below 25,000 ends the bulls' narrative; a strong move above 25,180 rewrites it.”
✏️ Disclaimer
This is just my personal viewpoint. Always consult your financial advisor before taking any action.

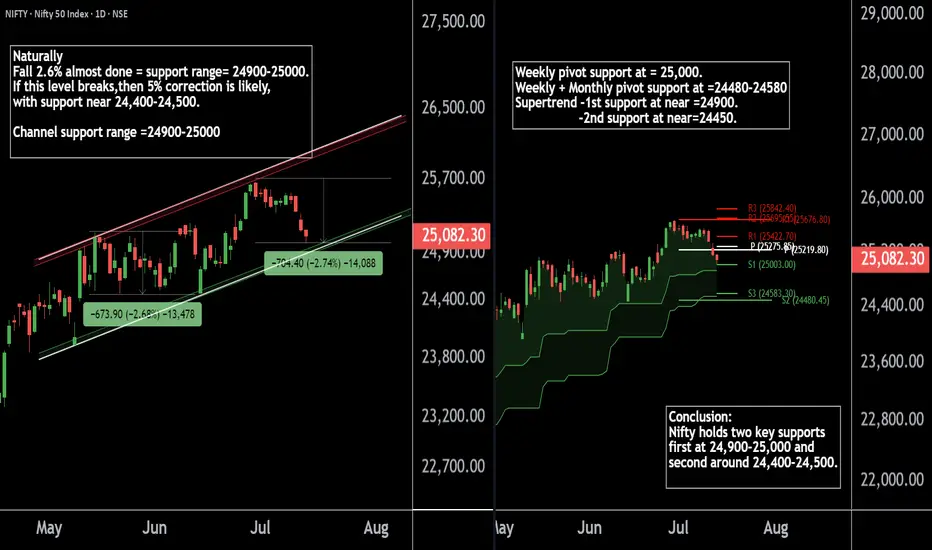
Nifty50's Key Level !! Keep an eye on these levels.Here are two Nifty charts, both on the daily timeframe.
Current Correction:
Nifty has naturally corrected by 2.7%, currently trading in the 24,900-25,000 range.
Weekly Pivot:
The weekly pivot support is positioned at 25,000, providing immediate support.
Support Levels:
First Support: 24,900-25,000 zone.
Second Support: If this level breaks, Nifty may see a 5% correction, with the next support around 24,400-24,500.
If this level sustain we may see higher prices in Nifty 50.
Thank You !!
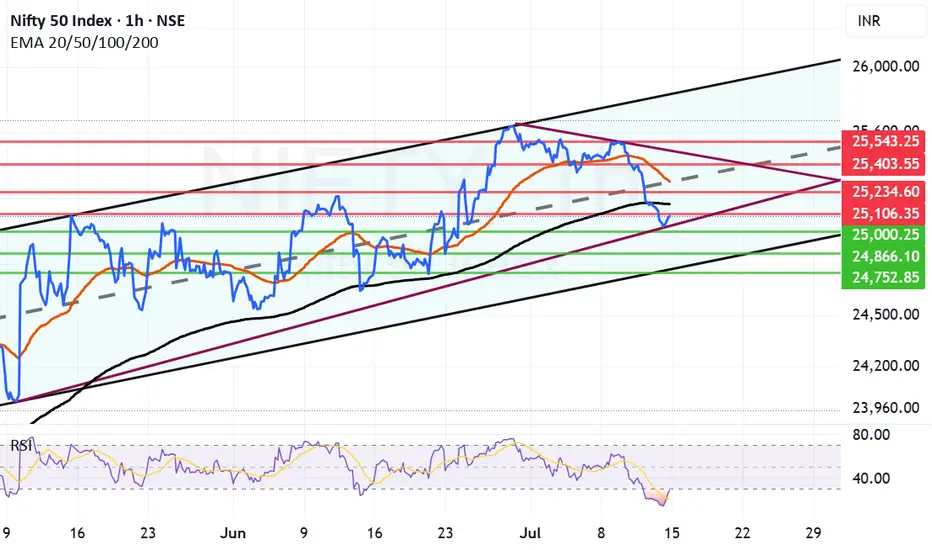
Nifty has taken support at 25K but can the support hold?Nifty today took a meaningful support at 25001 and bounced close to 25082. However ending the was in the negative by 67.55 points. RSI today went as low as 13.52 indication of oversold market. IT was a major drag after result that market did not like.
Now the resistances in front of Nifty are at 25106, Father Line Resistance at 25106, 25234, Mother Line Resistance at 25297, 25403 and finally 25543. Supports for Nifty remain at 25K, 24866 Chanel Bottom support and finally 24752. Below 24752 Bears can totally take control of the market if we reach there.
Things are in balance right now with Mid-cap, Small-cap starting to see some buying. If IT can hold the levels we will see growth from here. If IT index further caves in and other indices do not support we can see a down side. Shadow of the candle right now is neutral to negative.
Disclaimer: The above information is provided for educational purpose, analysis and paper trading only. Please don't treat this as a buy or sell recommendation for the stock or index. The Techno-Funda analysis is based on data that is more than 3 months old. Supports and Resistances are determined by historic past peaks and Valley in the chart. Many other indicators and patterns like EMA, RSI, MACD, Volumes, Fibonacci, parallel channel etc. use historic data which is 3 months or older cyclical points. There is no guarantee they will work in future as markets are highly volatile and swings in prices are also due to macro and micro factors based on actions taken by the company as well as region and global events. Equity investment is subject to risks. I or my clients or family members might have positions in the stocks that we mention in our educational posts. We will not be responsible for any Profit or loss that may occur due to any financial decision taken based on any data provided in this message. Do consult your investment advisor before taking any financial decisions. Stop losses should be an important part of any investment in equity.
NIFTY50.....Are you crazy?Hello Traders,
with an "over-night" delay (for which I apologize), here is a brand-new analysis for NIFTY50!
The N50 has dropped, 'caused by the announced Tariffs for the "BRICS" countries.
The "Orange-man" who took residential at Pennsylvania Avenue at DC announced again tariffs at a record high for the BRICS-countries! Anyway! One step forward, one step back! This is clown's business!
The chart analysis:
N50 dropped to a low @ 25001.95 this morning. Here, a buy-signal occurred that would be activated @ 25109 points. Stop-loss must be set @25100!
The multi-week target, I have announced some weeks ago, are still valid.
While price break below the rising trend-line, connecting the high @25116 and 25222 a first target would be exactly at the level of 25350 (+/-) depending on when and if it will be touched!
In fact, the wave pattern could be also a wave 2, difficult to count, but still possible.
It needs a decline below 23246 points to eliminate this count!
While markets are unpredictable, 'caused by the US tariffs politics, it is very difficult to forecast the moves.
Probably one got argument would be, to pause the trading and wait til markets get less volatile.
That's it for today.
Have a great week.....
Ruebennase
Please ask or comment as appropriate.
Trade on this analysis at your own risk.

Nifty holds important support zone.Nifty Analysis:
Support and Upside Targets
Market Recap
- Opening: Nifty opened flat, showing little directional bias at the start.
- Intraday Move: The index was dragged down towards the important support zone of 25,050–25,000
- Bounce: From this support zone, Nifty rebounded and managed to close above 25,080.
Technical Outlook:
Key Support Zone
- Support Range: 25,050–25,000
Significance: This zone has acted as a strong support, with buyers stepping in to defend it.
- Implication: As long as Nifty sustains above this zone, the short-term trend remains positive.
Upside Targets
If Nifty holds above the support:
- Immediate Targets: 25,200 and 25,300 are the next levels to watch for upward momentum.
- Long-Term Targets: 25,500 and 25,700 remain the key targets if the bullish momentum continues.
Summary
- Bullish View: Sustaining above 25,000–25,050 support zone keeps the index in a positive bias.
- Bearish Risk: A decisive break below 25,000 could lead to further downside.
- Strategy: Traders may consider staying long as long as Nifty holds above the support zone, watching for the mentioned targets.
Note: Always use appropriate risk management and monitor for any changes in market sentiment or global cues that may impact index movement.

Nifty levels - Jul 15, 2025Nifty support and resistance levels are valuable tools for making informed trading decisions, specifically when combined with the analysis of 5-minute timeframe candlesticks and VWAP. By closely monitoring these levels and observing the price movements within this timeframe, traders can enhance the accuracy of their entry and exit points. It is important to bear in mind that support and resistance levels are not fixed, and they can change over time as market conditions evolve.
The dashed lines on the chart indicate the reaction levels, serving as additional points of significance to consider. Furthermore, take note of the response at the levels of the High, Low, and Close values from the day prior.
We hope you find this information beneficial in your trading endeavors.
* If you found the idea appealing, kindly tap the Boost icon located below the chart. We encourage you to share your thoughts and comments regarding it.
Wishing you success in your trading activities!
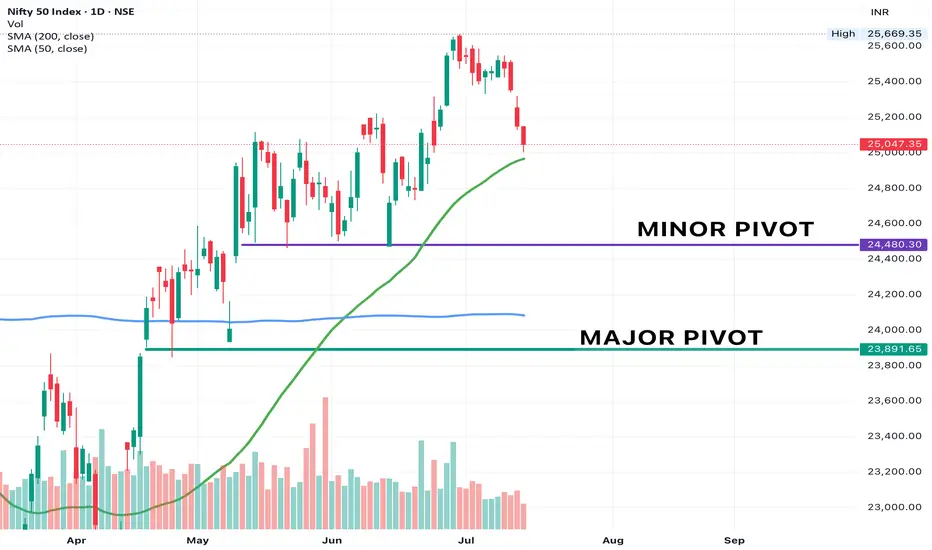
NIFTY Quick update - We are less than 3% away from the ATH. This is a healthy market pullback. 50 DMA is above 200 DMA and is trending up.
This could be a short term pivot and we can touch (or slightly undercut 50 DMA) and continue moving up. My portfolio is infact rising during this pullback - this implies the strongest stocks are actually still leading, there is no profit booking yet.
Use this time to cut out your underperforming stocks and add to your winners. Strongest Pockets in the markets - Finance, Banks, Capital Markets, Pharma, Infra/Realty.
Some pockets that are setting up - Metals, IT, Auto (dont expect outperformance here, markets have moved up while these are still setting up, so its a good chance they move in line with the markets, not much alpha here)

#Nifty directions and levels for July 14th:Good morning, Friends! 🌞
Here are the market directions and levels for July 14th:
The global market continues to maintain a moderately bearish sentiment, and our local market is also reflecting the same tone.
So, what can we expect today?
Current View:
Structurally, there has been strong selling pressure. So, if the market consolidates or breaks the support with a solid candle, we can expect the correction to continue.
Alternate View:
On the other hand, if the market finds support near the immediate support level or if the initial move takes a pullback, we can expect a maximum 38% to 50% pullback in the minor swing.
Even if that happens, the trend may still remain bearish in the lower time frame. So, if the market starts to reject around the 38% Fibonacci level on the upside, we can expect the downtrend to resume.
In simple terms, if a pullback occurs, we may see a range-bound market.
#NIFTY Intraday Support and Resistance Levels - 14/07/2025Nifty is expected to open slightly gap-down after consistent bearish momentum in the previous sessions. The index is hovering near 25140, and immediate support lies around the 25200 level. A breakdown below this level could lead to further downside pressure, with key support targets at 25150, 25100, and 25050.
If the index breaks and sustains below 24950, it may trigger a deeper correction toward the next support levels at 24850, 24800, and 24750. These zones should be watched closely for potential reversals or continuation of bearish momentum.
On the upside, any recovery and sustained move above the 25250 level may lead to a pullback rally. In that scenario, immediate resistance levels to watch would be 25350, 25400, and 25450+.
Intraday structure remains weak unless Nifty reclaims the 25250+ zone with strength. Price action near the 25200–25050 support range will be crucial in deciding the direction of the day.
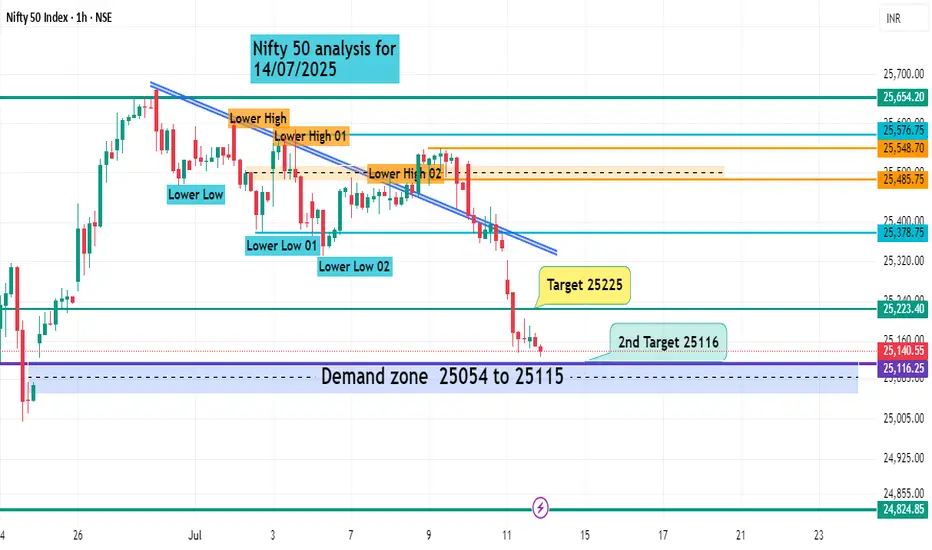
Nifty 50 analysisYou can see that after June 30, the market is trending downwards, creating lower lows on the 1-hour chart. Our first target of 25225 has been achieved in the market. The second target will be 25116. There is a support zone visible in the market from 25056 to 25115. The market will attempt to reverse from here. If the market tries to fill the gap created on June 24, it may also try to fill the gap from June 23. Then our target liquidity zone will be 24824.