#NIFTY Co-relating with Global indices can do a bigger CRASH!!!NSE:NIFTY Could join the global indices if a huge sell off is triggered, We see Global indices all at all time high and at a over bought zone suggesting huge sell off lickely. If this sell off can happen then the Nifty may correct big time in the form of FLAT falling 8% from curretnt market. However we dont recommend selling,. this is a caution ahead call.
Trade ideas

Nifty 50 : Clearing resistances one after another Nifty 50: Clearing resistances one after another. 25700 level cleared , next one is the all time high which 26277.
( Not a Buy / Sell Recommendation
Do your own due diligence ,Market is subject to risks, This is my own view and for learning only .)

Nifty levels - Oct 21, 2025Nifty support and resistance levels are valuable tools for making informed trading decisions, specifically when combined with the analysis of 5-minute timeframe candlesticks and VWAP. By closely monitoring these levels and observing the price movements within this timeframe, traders can enhance the accuracy of their entry and exit points. It is important to bear in mind that support and resistance levels are not fixed, and they can change over time as market conditions evolve.
The dashed lines on the chart indicate the reaction levels, serving as additional points of significance to consider. Furthermore, take note of the response at the levels of the High, Low, and Close values from the day prior.
We hope you find this information beneficial in your trading endeavors.
* If you found the idea appealing, kindly tap the Boost icon located below the chart. We encourage you to share your thoughts and comments regarding it.
Wishing you success in your trading activities!

Pre-Diwali Cheer on Dalal Street! Nifty Hits Fresh Yearly HighIndian markets extended their rally for a third straight session on Friday, October 17, with the Nifty hitting fresh one-year highs, spreading early Diwali cheer across Dalal Street.
With this surge, the Nifty 50 is now just 2.16% away from its all-time high of 26,277, reached in September 2024. October has been particularly strong, with the index closing most sessions in the green and posting month-to-date gains of 4.46%, its best performance since March 2025.
Key Drivers of the Rally
● Consumption Stocks Lead the Charge – FMCG and other consumption-oriented stocks gained as investors anticipate improved volume growth.
● Banking Sector Strength – A strong start to the earnings season, led by Axis Bank, boosted confidence with better-than-expected margins and improving asset quality. Nifty Bank NSE:BANKNIFTY even hit a fresh all-time high in the last session.
● Foreign Investor Support – FPIs turned net buyers, helping fuel the rally.
● Positive Macroeconomic Signals – Hopes of an India-U.S. trade deal and falling crude oil prices added to market optimism.
● Geopolitical Stability – Easing tensions in the Middle East reduced risk sentiment, supporting equities.
● Earnings Recovery Expectations – Investors expect H2 FY26 to see stronger earnings, aided by GST rate cuts and the RBI’s cumulative 100-basis-point repo rate reduction, boosting domestic consumption.
Technical Observations
Nifty has broken past the trendline resistance near its previous high of 25,670, signaling continued bullish momentum.
● Immediate support: 25,400–25,500
● Strong support: 25,000
● Resistance zone: 25,850–26,000
Outlook
Next week may stay muted as market holidays on October 21 and 22 could limit major moves. Nifty is likely to remain sideways with a slight bullish bias. Muhurat trading on Tuesday, October 21 (1:45 PM–2:45 PM) will serve as an early indicator of market momentum post-Diwali.

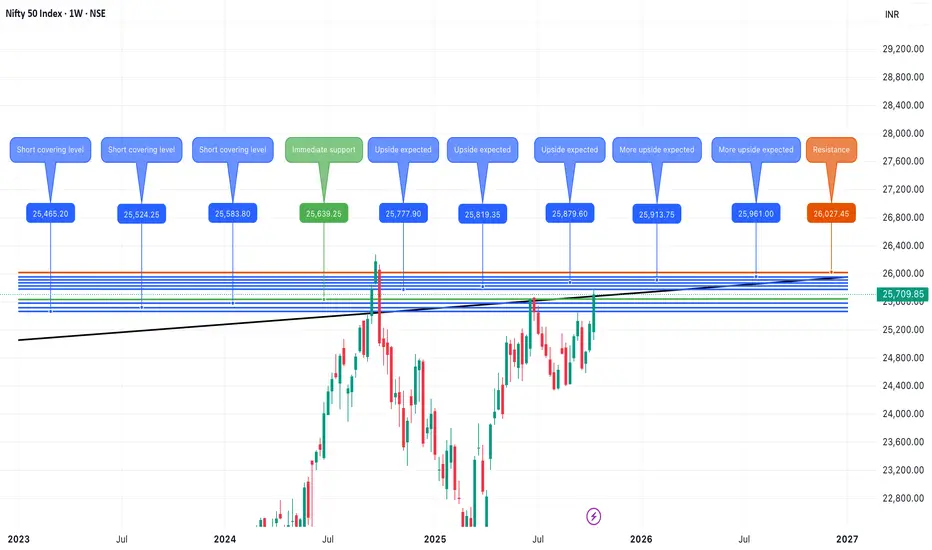
Nifty October 3rd Week Analysis Nifty closing at 25700 is giving hope for further upside momentum , but upside would be more promising once Nifty crosses and sustains above 25820. Otherwise, we can expect a sell on rise if 25820 is rejected. But if Nifty successfully sustains above 25820, then we can expect a rally to continue close to 26000-26100. On the downside, the max downside is limited to 25465.
All levels are marked in the chart posted .
Nifty 50Nifty 50 Chart Analysis..... 16/10/2025
Our long side target in Nifty has been achieved. Now if we get a gap up opening on Diwali day, then I will go positional short in Nifty whose target will be below 25000 (24935) level or stop-loss will be 26000 closing basis or above the Diwali high closing basis.
Note : This is my chart analysis which is for educational purposes only and it may be wrong.

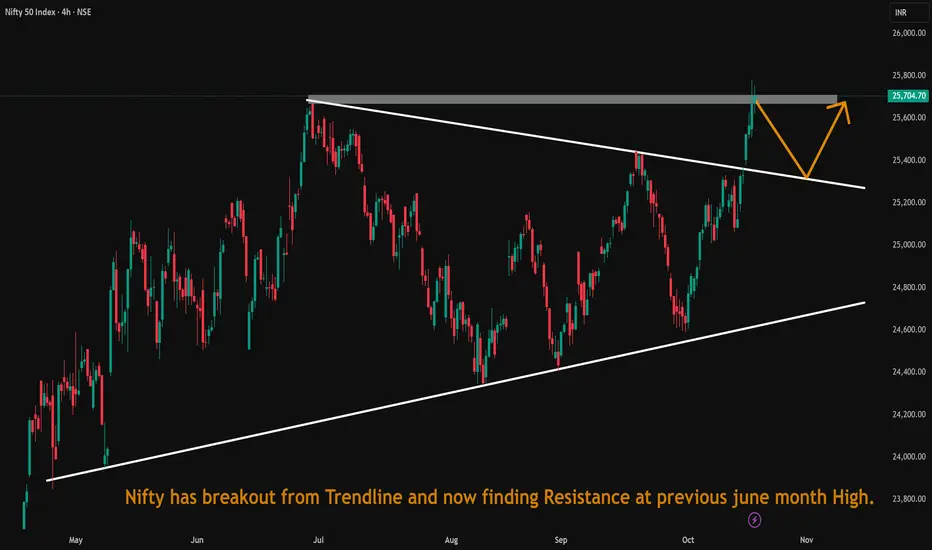
Nifty has breakout from Trendline and now finding Resistance.Nifty has breakout from Trendline and now finding Resistance at previous june month High.
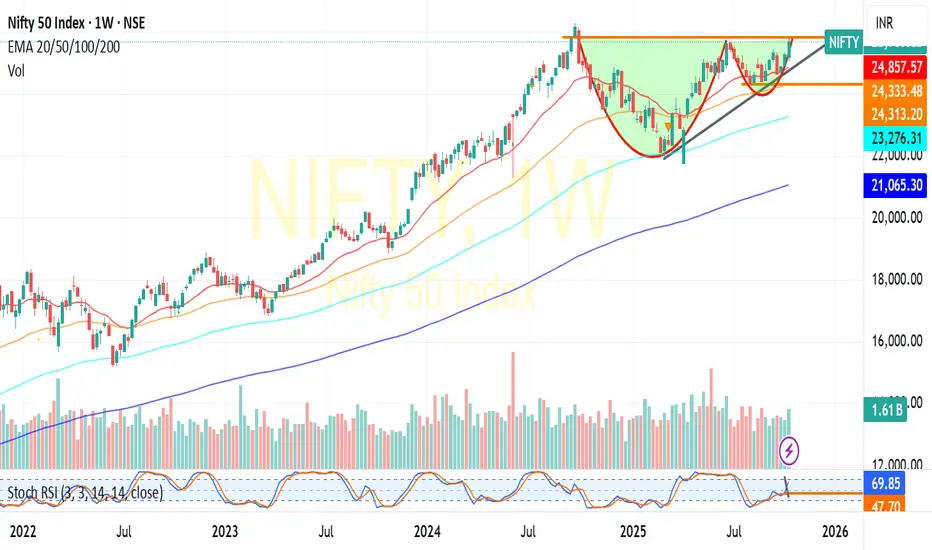
NIFTY:Cup&Handle Break Out-Bull RunNIFTY : Trading at 25700+ Levels.
Trading above all its critical moving averages even in weekly charts(20/50/100/200) showing the momentum
Has formed Cup&Handle formation in weekly chart indicating a possible upside of another 800-1000 Points .Daily chart also confirms the momentum by formation of Inverted Head &shhoulder pattern.
Seems any reasonable dip is likely to be bought .23400 shall be considered as the major support point for any trend reversal.(For educational purpose only)
Nifty Analysis EOD – October 31, 2025 – Friday🟢 Nifty Analysis EOD – October 31, 2025 – Friday 🔴
Bulls Trapped Early — Bears Closed the Week with Authority!
🗞 Nifty Summary
Nifty opened flat to mildly negative, but the sentiment quickly turned bearish as the index slipped 63 points within the first minute, breaking below the Previous Day’s Low (PDL). Just as the tone seemed set for a full bearish day, a sudden aggressive recovery spike flipped the momentum — Nifty rallied 131 points from the day’s low, crossing CDO, CDH, and even the CPR zone.
However, the 25950 resistance zone halted this unexpected surge. The CPR tried to hold as support but eventually failed, leading to a sharp fall below PDL, CDL, and S1. The index finally found a pause around the 25790 support, staying range-bound between 25830 ~ 25760 for most of the session.
In the final minutes (around 2:50 PM), Nifty broke the
consolidation and tested the key 25715 ~ 25725 support zone, closing the day at 25731.90, almost at the day’s low.
The first 20 minutes trapped the bulls, and the bears rode comfortably through the rest of the session. Today’s close erased the past 9 trading days of gains, also finishing below last week’s low, signaling clear selling pressure between 25800 ~ 26,000.
Heading into Monday, sustaining below 25725 ~ 25715 could open the door to the next support zone of 25580 ~ 25550. Bulls need to reclaim 25790 quickly to avoid deeper retracement.
🛡 5 Min Intraday Chart with Levels
🛡 Intraday Walk
Flat-to-weak open quickly turned bearish, breaking PDL.
A surprise 131-point spike trapped early bulls.
Resistance at 25950 and CPR rejection flipped momentum back to bears.
Sharp fall below S1; support emerged at 25790.
Long sideways phase around 25800, followed by a late sell-off to 25725.
Closed near the day’s low — bears in firm control.
📉 Daily Time Frame Chart with Intraday Levels
🕯 Daily Candle Breakdown
Open: 25,863.80
High: 25,953.75
Low: 25,711.20
Close: 25,722.10
Change: −155.75 (−0.60%)
🏗️ Structure Breakdown
Type: Bearish candle with long upper wick, close near day’s low.
Range (High–Low): 242.55 points → wide and volatile.
Body: ≈ 141.70 points → decisive selling pressure.
Upper Wick: ≈ 89.95 points → strong rejection from highs.
Lower Wick: ≈ 10.90 points → weak recovery near close.
📚 Interpretation
Despite a volatile start, the bears dominated throughout. The session’s failed recovery and close near the lows reflect an exhaustion of buying power. The long upper shadow signals repeated rejections at resistance, confirming that sellers continue to defend higher levels strongly.
🕯Candle Type
A Bearish Continuation Candle, extending Thursday’s weakness. The upper shadow rejection shows that bulls’ attempts to reclaim ground were quickly overpowered by sellers.
🛡 5 Min Intraday Chart
⚔️ Gladiator Strategy Update
ATR: 206.86
IB Range: 131.65 → Medium
Market Structure: Imbalanced (Bearish Bias)
Trade Highlights:
9:53 – Short Trade → Target Achieved (R:R 1:2.89)
10:26 – Short Trade → Trailing SL Hit
13:37 – Short Trade → Trailing SL Hit
📌 What’s Next? / Bias Direction
The October expiry week ended with a decisive bearish tone.
If Monday opens below 25715 and fails to reclaim 25790, expect a slide toward 25580 ~ 25550 in the short term.
Conversely, only a close above 25880 can ease selling pressure and hint at a relief bounce.
For now, bearish momentum remains dominant — trade light, stay objective, and let the structure confirm before committing.
📌 Support & Resistance Levels
Resistance Zones:
25790
25865 ~ 25880
25920 ~ 25944
Support Zones:
25635 ~ 25615
25585
25550
25510
25460 ~ 25440
💡 Final Thoughts
“When the market traps the impatient, it rewards the disciplined. Let structure—not emotion—guide your trades.”
✏️ Disclaimer
This is just my personal viewpoint. Always consult your financial advisor before taking any action.

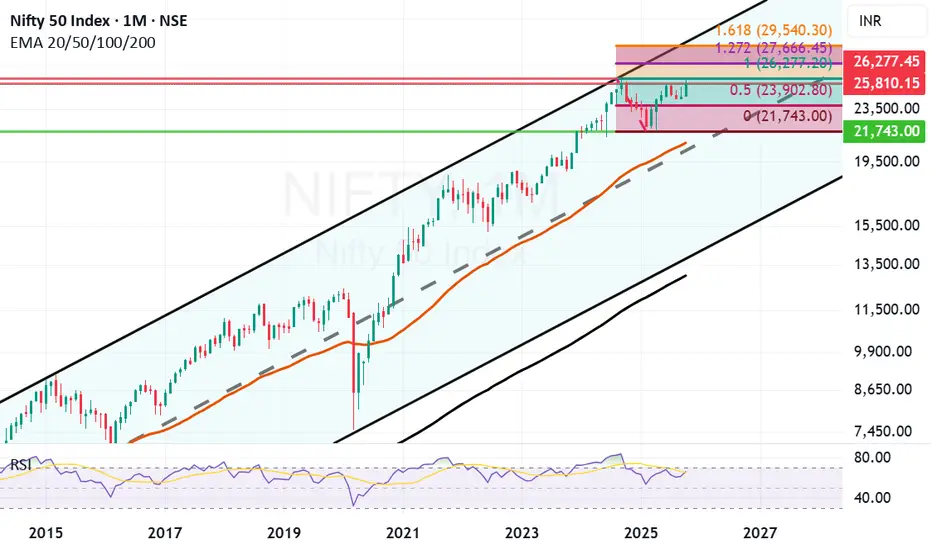
Negative closing today but it was a good monthly closing candle.Despite negative closing for last 2 days of the month it was an overall good monthly candle for Nifty. Previous highest Monthly closing for Nifty was 25810 in September 2024. This month we got a closing slightly below the same at 25722 in October 2025. Once we get a closing above previous all time high in the next month or 2 on in few months time the doors for Next Fibonacci level opens. The next Fibonacci resistance level after we get a closing above previous ATH of 26277 will be at 27666. Golden Fibonacci ratio target in few years time will be 29540.
Very strong Fibonacci support now remains at 23902. Next Fibonacci level support in case of a catastrophic event will be at 21743. Mother line of 50 Months EMA remains at 20853 which is very close to mid-channel support in case there are multiple global or regional situations creating instability.
As of now the shadow of the candle seems positive however there is a chance of little bottom testing for Nifty before we get a new all time high. Sectoral rotations and reshuffling of portfolios of HNIs, MFs and FIIs might also be on card depending on the trade deals and newly emerging tariff scenarios.
Selective stocks which have been giving good results year on year and Quarter on Quarter from Consumption, Defense, Auto, Infrastructure, Banking and Capital Goods sectors including the PSUs themes look good for long term investment currently. While previous superstars of IT, Pharma, Services and other few sectors which lead the previous rally can tend to remain laggard and sideways, specially if the trade deal agreement remain unresolved. If the trade deals with EU and US, specially US goes through even these sectors will fight back and tend to perform.
Overall it was a good month of recovery where Nifty made a comeback from the lows of 24605 to reach 26104 gaining almost 1499 points at one point. Yet it was little disappointing to close below 26K at 25722. Still the positive is that we gained 1117 points this month which is not a bad show at all. Hoping that we get a monthly closing above 26K or previous ATH soon so that doors for next phase of Bull rally can commence swiftly.
Disclaimer: The above information is provided for educational purpose, analysis and paper trading only. Please don't treat this as a buy or sell recommendation for the stock or index. The Techno-Funda analysis is based on data that is more than 3 months old. Supports and Resistances are determined by historic past peaks and Valley in the chart. Many other indicators and patterns like EMA, RSI, MACD, Volumes, Fibonacci, parallel channel etc. use historic data which is 3 months or older cyclical points. There is no guarantee they will work in future as markets are highly volatile and swings in prices are also due to macro and micro factors based on actions taken by the company as well as region and global events. Equity investment is subject to risks. I or my clients or family members might have positions in the stocks that we mention in our educational posts. We will not be responsible for any Profit or loss that may occur due to any financial decision taken based on any data provided in this message. Do consult your investment advisor before taking any financial decisions. Stop losses should be an important part of any investment in equity.
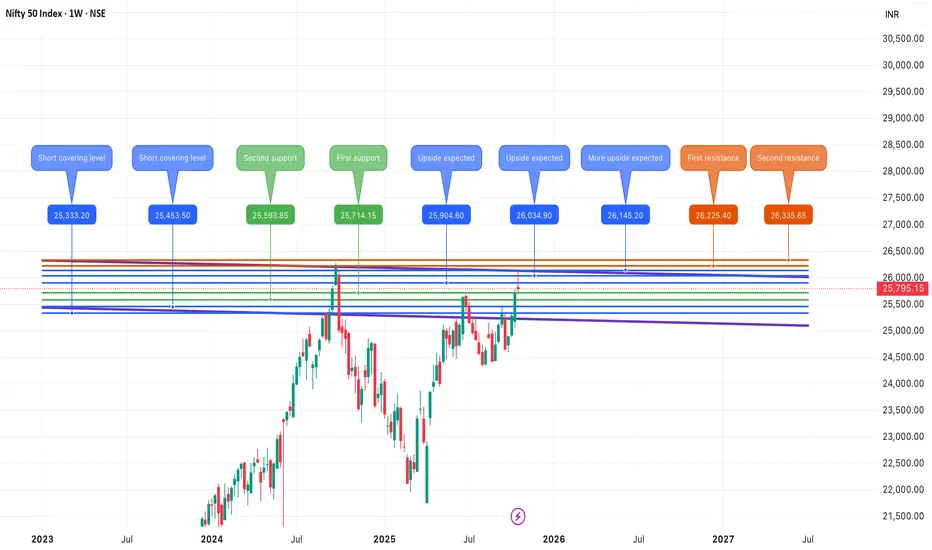
Nifty Short & Medium Term Support&Resistance_30-Oct to 7-Nov-25Nifty Short & Medium Term Support&Resistance_30-Oct to 7-Nov-25
Nifty 25909
Long call ( Buy) was given three weeks before at 24896, Nifty crossed 26000 last week and this week.
Recently china was announced 100% additional tarrif for rare earth restriction by china, but after meeting XI, trump reduced current tarrif from 57% to 47%
Quarterly results of company released so far are average expecting GST 2.0 and festive sale to boost in Q3, HDFC Bank posted 10% profit, ICICI Bank posted 5% profit, Reliance posted 10% profit.
HDFC AMC, Persistent Systems,Dixon, Waaree Energies, Waaree Renewables, KEI, Polycab, Havells, Indian Renewable, NMDC, Bank of Mah, ICICI Lombard and ICICI Pru posted good results. Few stocks are already gone up and PE is high.
Overall, the Qtrly Results and Tariffs deal will decide the future path of the Nifty. Since it is a Volatile situation SIP route or buy in multiple parcel route with a goal of 3-5 years will workout.
Pending Qtrly results and Tarriff Deal ill take the Index Further.
Hence the strategy can be shifted to long considering medium to long and use the opportunity to buy on dips similar to SIP.
Current Short Term Resistance are 26000 and 26269 ( all time high). It need to break the resistance 26269 decisively to move up to 27000 target in med-long term.
Nifty Short Term Supports ( Multiple Supports are there between 25000-25670):
1.25900 ( Trend line support)
2. 25670 ( Jun 2025 High) Should cross this resistance in short term decisively inorder to move up.
3. 25500 ( 25441 Sep 18th 2025 High )
4.25450 ( 25442 is the Aug 2025 high)
5.25350 ( Fibonacci resistance shown )
6.25200 ( 25154 Aug 2025 high)
7.25000 ( Milestone)
Short Term Resistance
1.26098 ( Recent last week high)
2.26269 ( All time High)
Medium Term Support:
1.24700 (Trend Line as shown)
2. 24000-24170 (Fibonacci Retracements Supports- Two Supports in this zone 24116 & 24171 as shown)
3. 23500-23700 (Fibonacci Retracements Supports- Two Supports in this zone 23608 & 23707 as shown)
2. 23000
Medium Term Resistance:
1.27000 ( Need to decisively break 26269 all time high) This resistance is based on Fibonacci resistance at 27034
Long term resistance:
1.28000 ( Need to decisively break and move up 27000)This resistance is based on Fibonacci resistance at 28106
Long Term Support
1.22700-23000 ( Trend line and Mar 2024 High)
2.Big support at 20000 (Sep 2023 high)

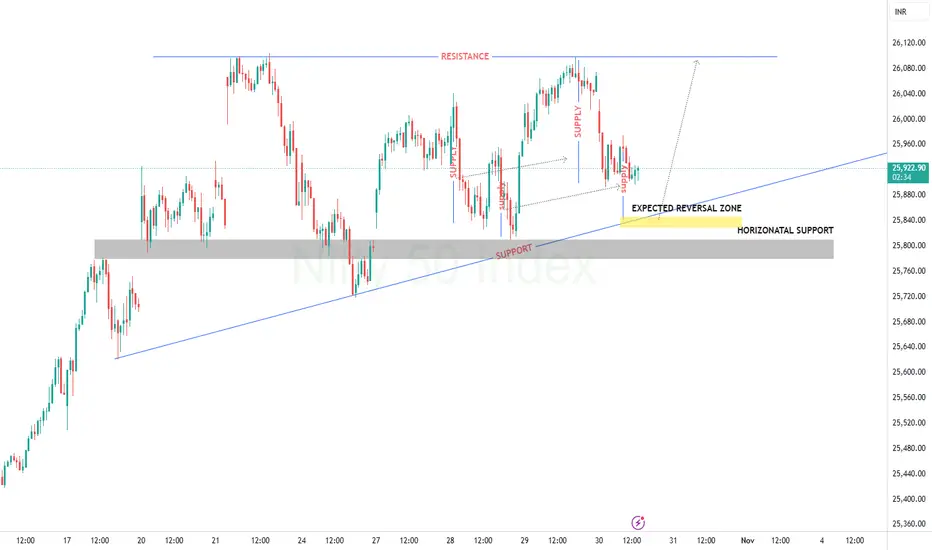
NIFTY FRESHVIEW FOR 30TH OCTDEMAND SUPPLY WORKED CLEARLY.
also showing ascending triangle formation for bulls
upside upcoming move from expected reversal area will act as key point for nifty today.
Nifty Analysis EOD – October 29, 2025 – Wednesday🟢 Nifty Analysis EOD – October 29, 2025 – Wednesday 🔴
Bulls fight back, but 26,100 still guards the gate to new highs
🗞 Nifty Summary
Nifty opened 22 points higher at 25,982 and immediately tested the 26010 ~ 26020 resistance zone within the first 5 minutes. This zone once again acted as a strong supply area, forcing an early rejection and filling the opening gap.
Despite multiple attempts, Nifty couldn’t break through in the first hour. During this phase, a symmetrical triangle pattern took shape, and its breakout finally triggered a sharp move upward, pushing the index beyond both the 26010 ~ 26020 zone and the PDH level.
However, the bulls failed to hold above PDH, slipping back below where the same zone flipped into support. From there, with persistent effort, Nifty managed to reclaim the PDH and mark a new intraday high near 26085 ~ 26100, the next key resistance zone.
Around 1:10–1:15 PM, heavy volume spikes were noted — particularly on ITM option strikes — signaling a fierce tug-of-war between buyers and sellers. Price consolidated in this area and created a false breakout, eventually sliding back to retest PDH and the 26010 ~ 26020 zone.
By the closing bell, Nifty settled at 26,068.30, posting a 102.90-point gain — a healthy positive finish despite intraday turbulence.
Yesterday’s note had warned about false breakouts, which proved useful today. Up to 13:40, Nifty moved cleanly along a trendline, but once it broke, bias turned unclear — signaling traders to step back. Those who detached after the early profit phase likely preserved gains and avoided the afternoon whipsaws.
Going ahead, 26010 ~ 26020 must hold as support to keep bullish momentum intact. A breakout above 26,100 could open the door toward 26,220, 26,280, and possibly a new all-time high (ATH) soon.
🛡 5 Min Intraday Chart with Levels
🛡 Intraday Walk
Gap-up open of 22 pts → early rejection at 26010 ~ 26020.
Gap filled → forms symmetrical triangle.
Breakout triggers sharp rally → crosses PDH, hits 26085 ~ 26100.
Fakeout at highs → slides back below PDH to support.
Afternoon session volatile, strong volumes between 1:00–1:15 PM.
Index rebounds again, closes strong near 26068.
📉 Daily Time Frame Chart with Intraday Levels
🕯 Daily Candle Breakdown
Open: 25,982.00
High: 26,097.85
Low: 25,960.30
Close: 26,053.90
Change: +117.70 (+0.45%)
🏗️ Structure Breakdown
Type: Bullish candle with small lower shadow and moderate upper wick.
Range (High–Low): 137.55 pts → steady intraday movement.
Body: ≈ 71.9 pts → consistent buying strength.
Upper Wick: ≈ 43.95 pts
Lower Wick: ≈ 21.70 pts
📚 Interpretation
The session opened flat, briefly dipped below 25,960, and then trended higher. Buyers maintained firm control through the day, though some supply was visible near 26,100. The close near the upper end of the range confirms bullish continuation.
🕯Candle Type
Bullish Continuation Candle (Rising Marubozu variant)
Indicates renewed buying interest following a brief pause in momentum (after previous spinning top).
🛡 5 Min Intraday Chart
⚔️ Gladiator Strategy Update
ATR: 202.26
IB Range: 64.75 → Medium
Market Structure: Balanced
Trade Highlights:
10:10 – Long Trade → Target Achieved (R:R 1:2.45)
12:10 – Long Trade → Target Achieved (R:R 1:1.36)
13:30 – Long Trade → SL Hit
📌 What’s Next? / Bias Direction
Bias: Bullish continuation with cautious optimism.
Holding 26,010–26,020 keeps the trend intact;
break above 26,100 can extend the rally toward 26,220+.
📌 Support & Resistance Levels
Resistance Zones:
25996
26010 ~ 26020
26085 ~ 26100
Support Zones:
25865
25828
25790
25725 ~ 25715
💡 Final Thoughts
“Momentum rewards patience — not prediction.”
Nifty is showing healthy consolidation beneath resistance, and the strength of the last two sessions indicates buyers are still in charge. One decisive breakout above 26,100 could set the tone for the next leg higher.
✏️ Disclaimer
This is just my personal viewpoint. Always consult your financial advisor before taking any action.

Nifty Analysis EOD – October 28, 2025 – Tuesday🟢 Nifty Analysis EOD – October 28, 2025 – Tuesday 🔴
Volatility takes the driver’s seat — indecision candle hints at short-term pause
🗞 Nifty Summary
Nifty opened 44 points gap down at 25,930 and immediately formed OL (Open = Low), sparking an upward run that filled the gap and even crossed the previous day’s high, breaching the critical resistance zone of 26,010 ~ 26,020.
However, the breakout turned false, as Nifty failed to hold above and slipped sharply below the open, creating a fake PDH breakout scenario. Post-IB breakdown, the index found footing around S1 and the 25,865 support zone, but the bounce stalled near 25,900, which flipped into resistance and pushed Nifty down toward the PDL.
At the PDL, a double-bottom pattern emerged, triggering a strong rally toward 25,944–25,955. Yet, this zone, previously a support area, turned into resistance (polarity flip), and multiple failed breakout attempts forced bulls to retreat once more.
The last hour turned chaotic — a volatile battle around PDL with several fakeouts kept traders guessing. Around 2:50 PM, sudden expiry adjustments or short covering lifted Nifty sharply back above the day’s consolidation zone, closing near the PDC.
It was a wild roller-coaster session full of opportunities, but the volatility tested traders’ discipline. The long shadows on the 5-min candles perfectly captured the tug-of-war between buyers and sellers.
Despite the action, the day ended marginally negative, forming an indecisive structure where both sides remain active. The next session will be decisive — a breakout and sustainability on either side will dictate direction; otherwise, expect range-bound consolidation.
Today’s candle engulfed the previous day’s range, often a prelude to fake breakouts, so caution is key for breakout traders.
🛡 5 Min Intraday Chart with Levels
🛡 Intraday Walk
Gap-down open (44 pts) at 25,930 → forms OL and surges upward.
Fills the gap and crosses PDH → false breakout above 26,020.
Sharp reversal → IB and open-level breakdown.
Finds support near 25,865 (S1) → bounces to 25,900, flips to resistance.
Tests PDL, forms double bottom → rally to 25,944–25,955.
Multiple fake breakouts → bulls fade.
Wild expiry adjustment lifts price near PDC into the close.
📉 Daily Time Frame Chart with Intraday Levels
🕯 Daily Candle Breakdown
Open: 25,939.95
High: 26,041.70
Low: 25,810.05
Close: 25,936.20
Change: −29.85 (−0.11%)
🏗️ Structure Breakdown
Type: Small red candle with long wicks on both sides.
Range (High–Low): 231.65 pts → wide volatility.
Body: 3.75 pts → nearly neutral body.
Upper Wick: ~105.50 pts
Lower Wick: ~126.15 pts
📚 Interpretation
Market opened below Monday’s close → tested 26,041 (fresh high) but failed to hold.
Sharp selloff followed by a rebound → indecision throughout the day.
Closing near open = tug-of-war between bulls & bears → neutral sentiment.
🕯Candle Type
Spinning Top / Neutral Doji-like
Appears after a strong bullish run → hints at short-term exhaustion or consolidation phase.
🛡 5 Min Intraday Chart
⚔️ Gladiator Strategy Update
ATR: 206.77
IB Range: 112.05 → Medium
Market Structure: Balanced
Trade Highlights:
09:45 – Short Trade → Target Achieved (R:R 1:2.17)
10:05 – Short Trade → Target Achieved (R:R 1:1.49)
12:15 – Long Trade → Target Achieved (R:R 1:2.67)
📌 What’s Next? / Bias Direction
Bias: Neutral → Awaiting breakout
Expect volatility to persist within 25,800–26,050.
Break and sustain above 26,050 = bullish continuation;
Drop below 25,800 = short-term pullback likely.
📌 Support & Resistance Levels
Resistance Zones:
25996
26010 ~ 26020
26085 ~ 26100
Support Zones:
25865
25828
25790
25725 ~ 25715
💡 Final Thoughts
“Indecision is not weakness — it’s the market’s way of asking who’s more patient.”
After a strong run, Nifty pauses for breath. The next session will reveal whether this was just a pit stop or the start of a new short-term consolidation phase.
✏️ Disclaimer
This is just my personal viewpoint. Always consult your financial advisor before taking any action.

ESG and the Sustainable Investing Revolution1. Understanding ESG Investing
ESG investing is the practice of incorporating environmental, social, and governance factors into investment decisions, alongside traditional financial metrics. The idea is that companies that are responsible stewards of resources, communities, and governance are more likely to deliver sustainable returns over time.
Environmental factors examine how a company impacts nature — such as its carbon footprint, energy efficiency, waste management, and use of renewable resources.
Social factors focus on human capital issues like employee welfare, diversity, community engagement, and respect for human rights.
Governance factors assess corporate ethics, leadership structure, executive pay, transparency, and shareholder rights.
ESG investing doesn’t reject profitability; instead, it broadens the definition of value creation. It recognizes that environmental degradation, social inequality, and poor governance can ultimately undermine financial performance. Hence, ESG acts as a risk management framework that identifies both threats and opportunities.
2. The Historical Evolution of Sustainable Investing
The roots of sustainable investing can be traced back centuries, when religious and ethical groups avoided investing in “sin stocks” such as tobacco, alcohol, or weapons. However, modern ESG investing began to take shape in the 1960s and 1970s, coinciding with rising environmental awareness and civil rights movements.
The Socially Responsible Investing (SRI) movement of the 1980s and 1990s laid the foundation for ESG, as investors began screening out companies with unethical practices. The 21st century saw the formalization of ESG frameworks, with key milestones such as:
2004: The United Nations launched the “Who Cares Wins” initiative, coining the term ESG.
2006: The UN Principles for Responsible Investment (UN PRI) were established, encouraging investors to integrate ESG principles.
2015: The Paris Agreement and UN Sustainable Development Goals (SDGs) set global sustainability targets.
2020s: ESG became mainstream, with trillions of dollars flowing into sustainable funds.
Today, ESG investing is no longer optional; it is an expectation from institutional investors, regulators, and consumers alike.
3. The Drivers Behind the ESG Revolution
Several powerful forces have propelled the ESG revolution forward:
a. Climate Change and Environmental Risks
The increasing frequency of extreme weather events, global warming, and biodiversity loss have made climate risks financially material. Companies that fail to adapt to environmental realities face supply chain disruptions, regulatory fines, and reputational damage. Investors now view climate resilience as a critical factor in long-term valuation.
b. Regulatory and Policy Changes
Governments and financial regulators worldwide have introduced sustainability disclosure requirements. The European Union’s Sustainable Finance Disclosure Regulation (SFDR), India’s Business Responsibility and Sustainability Reporting (BRSR) framework, and U.S. SEC’s climate risk proposals compel companies and funds to be transparent about their ESG performance.
c. Changing Consumer and Investor Preferences
Millennials and Gen Z investors, who prioritize social and environmental impact, are driving demand for ESG products. Similarly, consumers are favoring brands that demonstrate corporate responsibility, pushing companies toward sustainable practices.
d. Technological Advancements
Big data, artificial intelligence, and blockchain technologies have improved ESG measurement, reporting, and transparency. For instance, satellite imagery helps track deforestation, while blockchain verifies supply chain ethics.
e. Corporate Accountability
The rise of shareholder activism and public scrutiny has made it harder for corporations to ignore ESG concerns. Shareholders are voting for climate resolutions, demanding diversity on boards, and insisting on ethical governance.
4. ESG Investment Strategies
ESG investing is not a single approach but a spectrum of strategies tailored to investor goals and risk appetite. The main strategies include:
a. Negative Screening
Excluding industries or companies that fail ESG criteria — such as fossil fuels, weapons, or tobacco — from portfolios. This traditional SRI approach aligns investments with ethical principles.
b. Positive Screening
Selecting companies that perform better than peers on ESG metrics. For example, choosing renewable energy firms over oil producers.
c. ESG Integration
Embedding ESG considerations into fundamental analysis alongside financial data. This approach seeks to identify ESG risks and opportunities that may affect long-term returns.
d. Thematic Investing
Focusing on specific sustainability themes, such as clean energy, electric vehicles, gender equality, or water conservation.
e. Impact Investing
Investing directly in projects or enterprises that generate measurable social and environmental benefits, alongside financial returns — such as microfinance, green bonds, or sustainable infrastructure.
f. Shareholder Advocacy
Using ownership rights to influence corporate behavior through voting, dialogue, and engagement.
5. ESG Metrics and Reporting Challenges
While ESG investing has grown rapidly, one major challenge remains: standardization. There is no single global framework for ESG reporting, leading to inconsistencies and “greenwashing.”
Several frameworks attempt to address this issue:
Global Reporting Initiative (GRI)
Sustainability Accounting Standards Board (SASB)
Task Force on Climate-related Financial Disclosures (TCFD)
International Sustainability Standards Board (ISSB)
Despite progress, ESG ratings can still vary widely between providers. A company rated “AAA” by one agency might receive a lower rating from another, reflecting different methodologies. Investors must therefore exercise due diligence and avoid overreliance on a single rating source.
6. ESG Performance and Returns
A persistent myth surrounding ESG investing is that it sacrifices financial returns. However, multiple studies have shown the opposite. Companies with strong ESG profiles often demonstrate:
Lower cost of capital
Greater operational efficiency
Stronger risk management
Better long-term profitability
During the COVID-19 pandemic, ESG funds outperformed traditional funds, underscoring their resilience. Sustainable businesses tend to attract loyal customers, committed employees, and long-term investors — all of which enhance financial stability.
7. The Rise of Green Finance and Innovation
The ESG revolution has spurred innovation across financial markets. Green finance — encompassing green bonds, sustainability-linked loans, and ESG ETFs — is now a multi-trillion-dollar industry.
Green Bonds: Used to finance environmentally friendly projects like renewable energy, energy-efficient buildings, and sustainable transportation.
Sustainability-linked Loans: Offer lower interest rates to borrowers who meet ESG performance targets.
ESG ETFs: Provide diversified exposure to companies with high ESG scores, democratizing sustainable investing for retail investors.
Additionally, carbon trading, renewable energy funds, and social impact bonds are transforming how capital flows toward sustainability goals.
8. Regional Perspectives on ESG Investing
a. United States
The U.S. ESG market is driven by institutional investors and corporate disclosure requirements. While political debates occasionally challenge ESG mandates, major asset managers like BlackRock and Vanguard continue to advocate for sustainability integration.
b. Europe
Europe leads the ESG revolution with stringent regulations, sustainability benchmarks, and investor awareness. The EU Taxonomy defines what qualifies as sustainable, ensuring clarity and preventing greenwashing.
c. Asia-Pacific
In Asia, ESG adoption is rapidly accelerating. Countries like Japan, Singapore, and India have launched ESG funds and mandatory disclosure frameworks. India’s BRSR mandate for top-listed companies is a key milestone in corporate sustainability reporting.
d. Emerging Markets
ESG investing is unlocking opportunities in developing countries through clean energy transitions, inclusive finance, and social impact projects. However, challenges include data quality and regulatory gaps.
9. The Role of Technology in ESG Advancement
Technology has become a game-changer for sustainable investing.
Artificial Intelligence (AI) analyzes massive ESG datasets for insights.
Blockchain enhances transparency in supply chains and ESG reporting.
Fintech platforms allow investors to track the real-world impact of their portfolios.
Smart grids and IoT enable efficient energy usage and carbon tracking.
These innovations empower investors to make data-driven sustainability decisions, enhancing accountability and trust.
10. Challenges and Criticisms of ESG Investing
Despite its popularity, ESG investing faces several criticisms:
a. Greenwashing
Some companies exaggerate their sustainability credentials to attract investors, leading to misleading claims.
b. Data Inconsistency
Different ESG rating systems and lack of standardization create confusion.
c. Short-Termism
Investors may focus on ESG scores rather than long-term impact.
d. Political Backlash
In certain regions, ESG is seen as politically motivated, sparking debates about the role of capitalism in social change.
e. Implementation Complexity
Integrating ESG into traditional investment frameworks requires expertise, reliable data, and alignment with financial objectives.
11. The Future of ESG and Sustainable Investing
The future of ESG investing lies in greater integration, standardization, and impact measurement. Key trends include:
Mandatory ESG disclosures across global markets.
AI-driven ESG analytics for precision and transparency.
Integration with the circular economy, emphasizing resource reuse and waste reduction.
Focus on social equity, including gender inclusion, human rights, and diversity.
Alignment with global net-zero targets by 2050.
As capital continues to flow into sustainable investments, ESG will reshape not only financial markets but also the broader global economy.
12. Conclusion: A New Era of Responsible Capitalism
The ESG and Sustainable Investing Revolution marks the dawn of a new era — one where profit and purpose coexist. It challenges the outdated notion that financial success must come at the expense of the environment or society. Instead, it promotes responsible capitalism, where investors, corporations, and governments collaborate to create a resilient and inclusive economy.
In the coming decades, ESG will not merely be an investment trend but a core determinant of global economic stability. The revolution has already begun — and those who embrace sustainability today will be the market leaders of tomorrow.
The future of finance is not just about earning returns; it’s about earning them responsibly — ensuring that growth today does not compromise the prosperity of future generations.

Global Property SurgeUnderstanding the Boom in Real Estate Markets Worldwide
Over the past decade, the world has witnessed an extraordinary surge in property prices across both developed and emerging economies. This global property surge has reshaped housing markets, altered wealth distribution, and prompted major policy responses from governments and central banks. The phenomenon is driven by a complex interplay of economic, demographic, and geopolitical factors — including low interest rates, pandemic-era shifts, urbanization, foreign investments, and the evolving role of real estate as an asset class. In this comprehensive analysis, we explore the causes, characteristics, impacts, and potential future trajectories of the global property surge in approximately 1500 words.
1. Historical Context: From Stability to Surge
Historically, property markets tended to move in relatively predictable cycles driven by local demand, income growth, and credit conditions. However, since the early 2010s, global real estate has transformed into a highly interconnected financial asset class. Following the 2008 global financial crisis, central banks worldwide adopted ultra-low interest rates and quantitative easing to stimulate growth. These measures made borrowing cheaper than ever, encouraging both households and investors to pour money into real estate.
The 2020–2022 COVID-19 pandemic further accelerated this surge. As economies locked down and stock markets turned volatile, real estate emerged as a safe and tangible store of value. Work-from-home trends reshaped living preferences, boosting demand for suburban and rural properties. The combination of limited supply, cheap money, and changing lifestyles ignited property booms from Sydney to Toronto, from London to Mumbai.
2. Key Drivers of the Global Property Surge
a. Ultra-Low Interest Rates
Central banks like the U.S. Federal Reserve, the European Central Bank, and the Bank of Japan slashed interest rates to near zero. Low borrowing costs reduced mortgage repayments, allowing buyers to afford higher-priced homes. Simultaneously, investors searching for yield turned to real estate for better returns than traditional savings or bonds.
b. Limited Supply and Urbanization
Global population growth and rapid urbanization intensified housing shortages. In cities like Hong Kong, London, and San Francisco, land scarcity and restrictive zoning regulations created supply bottlenecks. The imbalance between supply and demand pushed property values higher year after year.
c. Foreign and Institutional Investment
Real estate has increasingly attracted foreign and institutional investors. Sovereign wealth funds, private equity firms, and pension funds view property as a stable, inflation-resistant asset. Foreign capital inflows into major cities — especially from China, the Middle East, and Europe — have inflated prices, sometimes pricing out local buyers.
d. Inflation Hedge and Store of Value
Real estate serves as a traditional hedge against inflation. As currencies depreciate and costs rise, tangible assets like land and housing tend to maintain or increase in value. With rising inflation in the 2020s, investors flocked to property markets as a defensive strategy.
e. Digitalization and Real Estate Technology
Technological innovation in property transactions, data analytics, and financing platforms has made global real estate more accessible. PropTech companies, blockchain-based land registries, and digital marketplaces have simplified international investment, leading to greater capital mobility.
3. Regional Dynamics of the Surge
a. North America
The U.S. and Canadian housing markets have experienced dramatic growth. In the U.S., cities such as Austin, Miami, and Phoenix saw price increases of over 30–40% between 2020 and 2023. Cheap mortgages, limited inventory, and migration from urban to suburban areas fueled this boom. In Canada, markets like Toronto and Vancouver reached record highs, supported by foreign investments and immigration.
b. Europe
European property markets saw uneven growth. While Southern Europe (Spain, Italy, Greece) recovered slowly post-crisis, Northern and Western Europe — especially Germany, the Netherlands, and the U.K. — saw soaring prices. London and Berlin became magnets for global investors, though affordability concerns led to regulatory crackdowns, including rent caps and foreign buyer taxes.
c. Asia-Pacific
Asia witnessed one of the strongest property surges. In China, years of urban expansion and speculative investment drove housing prices to unsustainable levels, prompting government intervention. Australia and New Zealand saw housing affordability crisis levels, leading to tax reforms and stricter lending standards. Meanwhile, India’s urban centers — Mumbai, Bengaluru, Delhi — witnessed a post-pandemic revival driven by economic recovery and infrastructure growth.
d. Middle East and Africa
The Middle East, particularly Dubai, experienced a renewed boom as foreign investors sought tax advantages and luxury developments. Dubai’s property market rebounded sharply after 2020, supported by economic diversification and visa reforms. In Africa, cities like Nairobi, Lagos, and Cape Town saw increasing investment, driven by rapid urbanization and diaspora capital.
e. Latin America
Latin American real estate saw mixed trends. Countries with political instability or currency devaluation, like Argentina and Venezuela, struggled to attract stable investments. However, Mexico, Brazil, and Chile benefited from growing middle-class demand and tourism-driven development.
4. Socioeconomic Impacts of the Property Boom
a. Widening Wealth Inequality
Property ownership has become a key determinant of wealth. Rising prices have benefited asset owners while excluding younger generations and lower-income groups. In many cities, housing affordability has deteriorated, creating “generation rent” — people who can afford only to rent, not buy.
b. Rising Rent and Living Costs
As housing becomes scarce and expensive, rents have risen significantly, putting pressure on household budgets. This has fueled social and political debates over housing as a human right versus a financial asset.
c. Urban Sprawl and Environmental Strain
The search for affordable housing has pushed development to suburban and rural areas, leading to urban sprawl, deforestation, and increased commuting times. The construction boom has also raised concerns over sustainability and carbon emissions.
d. Financial Risks and Market Speculation
Rapid price escalation often breeds speculative behavior. Investors purchasing properties solely for price appreciation can inflate bubbles. If interest rates rise or economies slow, property markets risk sharp corrections. China’s Evergrande crisis exemplifies how overleveraged real estate sectors can threaten financial stability.
5. Government and Policy Responses
To control overheating housing markets, many governments have introduced a range of policy measures:
Monetary Tightening: Central banks, including the U.S. Federal Reserve and European Central Bank, began raising interest rates in 2022–2023 to curb inflation. This cooled some markets, but prices in high-demand areas remain resilient.
Macroprudential Regulations: Countries like Canada and New Zealand imposed stricter mortgage rules, such as higher down payments and limits on investor loans, to prevent excessive speculation.
Foreign Buyer Restrictions: Governments in Australia, Canada, and Singapore restricted foreign property purchases to protect local affordability.
Affordable Housing Initiatives: Some nations launched large-scale housing projects, rent control laws, and subsidies for first-time buyers to restore balance.
Property Taxes: Higher property or vacancy taxes were introduced in major cities to discourage speculative holdings and vacant investment properties.
6. Post-Pandemic Adjustments and Interest Rate Shifts
As the global economy emerged from the pandemic, inflation surged due to supply chain disruptions and energy price shocks. Central banks responded by hiking interest rates aggressively. This marked a turning point for global property markets.
In the U.S., mortgage rates more than doubled from their 2021 lows, cooling demand and leading to slight price corrections in overheated markets. Europe saw similar slowdowns, while Asia-Pacific remained more mixed. Despite short-term adjustments, structural shortages and urban migration continued to support long-term price growth.
7. The Rise of Alternative Real Estate Segments
The property surge also extended beyond residential housing:
Commercial Real Estate: While traditional office spaces suffered from remote work trends, logistics and warehousing boomed due to e-commerce expansion.
Luxury and Vacation Homes: Wealthy investors turned to luxury villas, second homes, and resort properties in scenic destinations like Bali, Dubai, and the Mediterranean.
Green and Smart Buildings: Sustainability-focused real estate gained prominence as investors prioritized energy efficiency, green certifications, and smart technologies.
Co-living and Co-working Spaces: Urban millennials increasingly preferred flexible living and working arrangements, fostering a new sub-sector of real estate innovation.
8. Long-Term Outlook: Boom, Plateau, or Correction?
The question remains: Is the global property surge sustainable? Analysts offer varying views.
a. Optimistic Scenario
Proponents argue that global housing demand remains structurally strong due to urbanization, migration, and demographic growth. Limited land supply and construction delays will continue to support prices. Moreover, real estate remains a hedge against inflation and currency depreciation.
b. Pessimistic Scenario
Skeptics warn of overvaluation and the potential for price corrections, particularly in overheated markets like Canada, Australia, and parts of Asia. Rising borrowing costs and declining affordability could lead to reduced demand, defaults, and even mini-bubbles bursting.
c. Moderate Scenario
The most likely outcome may be a gradual stabilization. Prices could plateau as rising interest rates cool demand while long-term fundamentals like population growth and supply shortages sustain a baseline of value. Governments will play a crucial role in balancing affordability with market stability.
9. Future Trends in Global Real Estate
Looking ahead, several transformative trends will define the next phase of the global property market:
Sustainability and Green Development: Energy-efficient and carbon-neutral buildings will dominate future construction.
Digital Real Estate and Tokenization: Blockchain-based property ownership and fractional investment models will democratize access to global assets.
Remote Work and Hybrid Cities: The reshaping of cities will continue as flexible work arrangements reduce the need for dense office districts.
Demographic Shifts: Aging populations in developed nations and youth-driven demand in emerging economies will create divergent regional patterns.
Governmental Regulation: More countries will adopt policies to cool speculative demand and promote affordable housing.
Conclusion
The global property surge is more than a housing trend — it is a reflection of broader economic transformations, technological advancements, and societal changes. While property markets have delivered immense wealth to owners and investors, they have also deepened inequality and raised pressing policy challenges.
As the world navigates a new era of higher interest rates, inflationary pressures, and climate imperatives, real estate must evolve beyond speculation and luxury toward sustainability, inclusivity, and affordability. The future of global property lies in balancing financial opportunity with social responsibility — ensuring that homes are not just investments but foundations of human stability and progress.

Nifty 50Nifty 50 Chart Analysis 28/10/2025..........
If the price sustains above the 26006 level without crossing the 25918 level, then the final target of this swing can be 26147......
Enjoy !


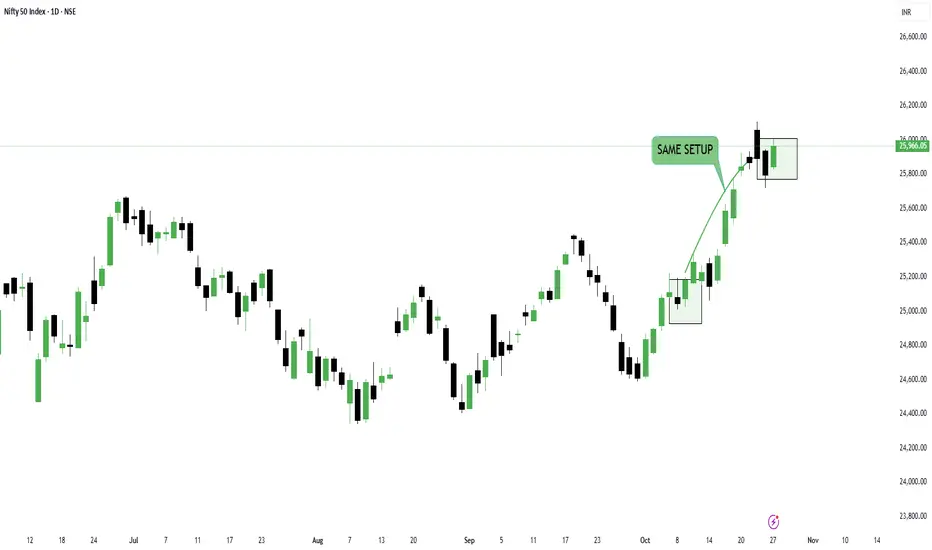
Buyers dominating Nifty ready to break all time high?Friday’s candle was a shakeout, and today that shakeout got completely absorbed.
This is the same combination we caught on October 8-9.
But note this — the recent five candles have continuously been signaling profit-booking levels, meaning the index could give a dip anytime.
Also, the October 9 candle had a clear pivot low, which today’s candle doesn’t have — that’s worth noticing.
However, the short-term undertone still remains bullish. Institutions are buying every dip, and that’s why we aren’t seeing any sharp pullback.
Today, buyers’ volume in #Nifty was higher by nearly 50 million compared to sellers, which should reflect tomorrow.
The PP is tight, which means the upcoming move will be sharp.
Which direction? That will depend on which level breaks first.
For tomorrow, resistance will be 26135 and support will be 25900.
Now, if we talk about market breadth — the ratio stands at 1.08, which clearly shows that buildup has started in the broader market.
That means the stocks in your portfolio should start moving now.
If they’re still not performing, it’s time to replace the inactive ones.
Dump the laggards and ride the trend.
On the sectoral front, the strongest momentum is visible in Auto Parts and Finance.
Overall, the market looks positive for tomorrow, but risk management remains equally important.
---
Levels at a glance:📊
Pivot: Tight (sharp move expected)
Support: 25900
Resistance: 26135
Market Breadth Ratio: 1.08 (broader buildup visible)
Bias: Short-term bullish, institutions buying dips
Sectors to watch: Auto Parts, Finance
Strategy: Replace inactive stocks and ride the trend
That’s all for today. Take care and have a profitable tomorrow.
Nifty October 4th week View ( Monthly Expiry )Nifty is expected to remain highly volatile in the upcoming week. On the downside, if Nifty breaches the downside support range of 25700-25593, then we can expect further retracment. For upside, Nifty must sustain and cross the 25900-950 range for upside momentum.
All levels are marked in the chart posted.
Bearish wedge formation is formed
Rising Wedge Pattern Spotted – Bearish Reversal Watch
A clear rising wedge pattern has developed on this chart, characterized by converging upward trendlines containing higher highs and higher lows. Volume has shown a slight decline as the wedge progresses, suggesting waning bullish momentum.
**Pattern Details:**
- Both trendlines slope upward, but the lower trendline is steeper.
- Volume tapers off, typical for this pattern.
- If the price breaks below the lower trendline, it may confirm a bearish reversal.
**Key Points to Watch:**
- Wait for a decisive breakdown below support with increased volume for confirmation.
- Potential price target can be projected by measuring the height of the wedge and subtracting it from the breakout point.
- Pattern reliability improves if the breakdown is accompanied by selling volume.
Not trading advice—monitor price action closely as the pattern approaches the apex. Rising wedge patterns often signal trend exhaustion and can provide valuable insight for risk management.

Nifty 500 points upside due in 5 days ??Pattern Type:
The structure is a Diametric pattern (7 legs) labeled A-B-C-D-E-F-G, currently expecting Wave G to unfold.
✅ Wave Details Noted on Chart:
Wave A: Took 5 days and moved ~500 points.
Wave B to E: Forming the characteristic bow-tie shape of a Diametric.
Wave F: Seems to have just completed or is near completion.
Wave G (Forecasted): Expected to mirror Wave A in both price and time (5 days / 500 points), suggesting a potential upward move from current levels.
🧭 Trendline Insights:
A red resistance trendline connects tops (Wave C to Wave E).
A black support trendline spans from the origin to Wave D and likely acts as support for Wave F.
Price is currently near the lower boundary, hinting at a possible reversal point.
💬 Annotations Highlight:
"Nifty ABC: selling target is almost completed" → suggests bearish move has played out.
"Wave G will replicate both price and time" → implies a measured bullish move is anticipated.
The substructure inside E-F is detailed as A1-B1-C1-D1-E1-F1-G1, possibly hinting at an internal smaller diametric or triangle.
🔮 Projection:
A bullish reversal (Wave G) is expected next.
Potential upside: ~500 points over 5 days (same as Wave A).
Support at the trendline and structure suggests this is a critical zone for bounce.
✅ Summary in One Line:
Nifty appears to be completing a Diametric (7-leg) corrective pattern, with Wave G projected next — likely an upward move matching Wave A’s time and magnitude (~500 pts / 5 days), assuming Wave F is now done.

Trendline Breakout and 1year high for NiftyNifty is at 1 year high at 25709 after making an yearly high of 25781.50. The trendline breakout has been achieved. All that we need for Nifty to grow from here is that the breakout should sustain. Also no negative news on Tariff front or any Geopolitical issue will be required for Nifty to forge its way ahead.
Supports For Nifty: Supports for Nifty are at 25378 (Important Fibonacci support), 24865 and 24333 (Strong Mother line support of 52 weeks.)
Resistances for Nifty are at: 25843, 26044 (Important Fibonacci resistance), 26277 (Previous All time high), 26529 (Fibonacci Golden ratio strong resistance) and finally 27470. After closing above 27470 doors for 28K will open directly.
To know more about Fibonacci retracement, Mother Father lines and my Mother, Father small Child theory, Fundamental analysis and how to draw charts or use Techno-Funda analysis do read my book the Happy Candles Way To Wealth Creation rated 4.8/5 on Amazon.
Things are looking good after a long time. Shadow of weekly candle is positive (Green). Hope some Geopolitical event or Tariff related news or weak earnings season does not spoil the chart again.
Disclaimer: The above information is provided for educational purpose, analysis and paper trading only. Please don't treat this as a buy or sell recommendation for the stock or index. The Techno-Funda analysis is based on data that is more than 3 months old. Supports and Resistances are determined by historic past peaks and Valley in the chart. Many other indicators and patterns like EMA, RSI, MACD, Volumes, Fibonacci, parallel channel etc. use historic data which is 3 months or older cyclical points. There is no guarantee they will work in future as markets are highly volatile and swings in prices are also due to macro and micro factors based on actions taken by the company as well as region and global events. Equity investment is subject to risks. I or my clients or family members might have positions in the stocks that we mention in our educational posts. We will not be responsible for any Profit or loss that may occur due to any financial decision taken based on any data provided in this message. Do consult your investment advisor before taking any financial decisions. Stop losses should be an important part of any investment in equity.
