Nifty levels - Oct 20, 2025Nifty support and resistance levels are valuable tools for making informed trading decisions, specifically when combined with the analysis of 5-minute timeframe candlesticks and VWAP. By closely monitoring these levels and observing the price movements within this timeframe, traders can enhance the accuracy of their entry and exit points. It is important to bear in mind that support and resistance levels are not fixed, and they can change over time as market conditions evolve.
The dashed lines on the chart indicate the reaction levels, serving as additional points of significance to consider. Furthermore, take note of the response at the levels of the High, Low, and Close values from the day prior.
We hope you find this information beneficial in your trading endeavors.
* If you found the idea appealing, kindly tap the Boost icon located below the chart. We encourage you to share your thoughts and comments regarding it.
Wishing you success in your trading activities!
Trade ideas

FIIs Impact on Investments1. Understanding Foreign Institutional Investors (FIIs)
Foreign Institutional Investors are professional investors who bring in large pools of capital from abroad into domestic financial markets. They typically invest in equities, bonds, derivatives, and sometimes real estate. Unlike retail investors, FIIs operate on a large scale, and their investment decisions are based on rigorous market analysis, macroeconomic factors, and global financial trends.
FIIs are distinct from Foreign Direct Investment (FDI). While FDI involves long-term investments in physical assets such as factories or infrastructure, FIIs primarily invest in financial instruments with a relatively shorter horizon. Their capital is highly liquid and can enter or exit markets quickly, leading to both opportunities and risks.
2. FIIs and Stock Market Performance
One of the most visible impacts of FIIs is on stock markets. When FIIs pour money into a market, they increase demand for equities, pushing stock prices higher. Conversely, massive outflows can lead to sharp declines in stock prices.
Liquidity Injection: FIIs bring substantial liquidity into domestic markets. Increased liquidity facilitates smoother trading, reduces transaction costs, and enhances market efficiency.
Market Sentiment: FIIs are considered smart money. Their investment choices often influence the confidence of domestic retail and institutional investors. A surge in FII inflows is often seen as a positive signal about the country’s growth prospects.
Volatility: While FIIs enhance liquidity, their large and often speculative movements can also increase market volatility. Markets can swing sharply on news or global economic developments that trigger FII inflows or outflows.
For example, in emerging markets like India, FIIs have historically influenced market indices such as the Sensex and Nifty. Periods of high FII inflows correspond with bullish market trends, while outflows often coincide with corrections or downturns.
3. FIIs and Bond Market Dynamics
Apart from equities, FIIs also invest in government and corporate bonds. Their presence in the debt market has multiple effects:
Interest Rates: Large FII participation in bonds can impact interest rates. High demand for government securities can lower yields, making borrowing cheaper for the government. Conversely, sudden FII withdrawal can push yields higher.
Capital Costs: Corporate bonds may also benefit from FII investment, as increased demand can reduce yields, lowering the cost of capital for businesses.
Foreign Exchange Impact: Bond market investments often involve currency conversion. When FIIs invest in domestic bonds, they buy local currency, which can strengthen it. Conversely, selling bonds and converting the proceeds back into foreign currency can weaken the domestic currency.
FIIs’ presence in the bond market adds depth and stability, but it also introduces sensitivity to global risk sentiment. For example, geopolitical tensions, rising interest rates in developed countries, or global liquidity tightening can trigger massive FII exits, affecting domestic bond yields and financing costs.
4. Impact on Currency Markets
FIIs impact not just stock and bond markets but also the foreign exchange (forex) market. Large inflows and outflows from FIIs create demand and supply pressures for domestic currencies.
Currency Appreciation: When FIIs invest heavily in equities or bonds, they need to convert foreign currency into the domestic currency. This increased demand can lead to appreciation of the local currency.
Currency Depreciation: Conversely, when FIIs withdraw capital, the selling pressure on the domestic currency can lead to depreciation. Sudden depreciation can increase import costs, affect inflation, and influence monetary policy decisions.
Hence, the central bank often monitors FII activity closely, as it directly affects currency stability, external debt repayment, and inflation management.
5. Influence on Domestic Investment Climate
FIIs influence the domestic investment climate in several ways:
Boosting Confidence: Sustained FII inflows indicate international confidence in a country’s economic and political stability. This can encourage domestic investors to participate more actively in markets.
Setting Benchmark for Corporate Governance: FIIs usually invest in companies with strong corporate governance, transparency, and performance metrics. Their focus often encourages domestic companies to adopt higher standards, enhancing market integrity.
Crowding Effects: While FII inflows are generally positive, excessive reliance on them can create “crowding effects.” Markets may become overly dependent on foreign capital, making them vulnerable to global shocks.
Countries with a robust domestic investor base are better insulated from FII volatility, while those heavily reliant on foreign inflows can experience sharp market swings.
6. Sectoral Impacts of FII Investments
FIIs do not invest uniformly across all sectors; they tend to target sectors with high growth potential, transparency, and liquidity. This selective investment creates sectoral imbalances:
Equity Concentration: Sectors like technology, finance, and consumer goods often attract more FII attention. This can drive sector-specific stock price appreciation.
Neglected Sectors: Conversely, sectors with low liquidity or higher regulatory risk may struggle to attract foreign capital, potentially affecting overall economic balance.
Capital Formation: By channeling funds into high-growth sectors, FIIs indirectly support capital formation, innovation, and expansion.
Understanding FII sectoral preferences helps policymakers and domestic investors identify investment trends and potential market opportunities.
7. Risks Associated with FII Investments
Despite their benefits, FII investments carry certain risks for domestic markets:
Market Volatility: FIIs can exit markets quickly in response to global events, triggering sharp market corrections. This volatility can affect retail investors and long-term domestic institutional investors.
Exchange Rate Risks: Sudden FII outflows can destabilize the domestic currency, impacting import-export balances, inflation, and external debt servicing.
Economic Dependence: Over-reliance on FII inflows for financing fiscal deficits or stock market growth can be risky. A sudden stop in foreign investments may lead to liquidity crises.
Policymakers often attempt to balance FII participation with measures that strengthen domestic institutional and retail investor participation to mitigate such risks.
8. Role in Portfolio Diversification
For domestic investors, FIIs contribute indirectly to portfolio diversification:
Liquidity and Trading Opportunities: FII participation increases market liquidity, making it easier for domestic investors to buy and sell assets efficiently.
Benchmarking: FIIs often invest in well-researched, high-quality assets. Their investment decisions provide a benchmark for domestic portfolio managers.
Risk Management: The inflow of foreign capital helps stabilize markets in the long term, although short-term volatility remains a concern.
9. Policy Implications and Regulatory Considerations
Governments and regulatory authorities closely monitor FII activity due to its macroeconomic impact:
Investment Caps: Many countries impose caps on FII investments in specific sectors or companies to avoid excessive foreign control.
Reporting Requirements: FII inflows and outflows are tracked meticulously to assess their impact on market stability and currency flows.
Monetary Policy Coordination: Central banks consider FII movements when designing monetary policy, interest rates, and currency interventions.
Regulators aim to attract long-term, stable FII capital while preventing speculative volatility that could destabilize domestic markets.
10. Case Study: India
India is an illustrative example of FII impact on investments:
Stock Market Influence: FIIs have historically driven major movements in the Sensex and Nifty. Periods of strong economic growth and favorable policy reforms attract high FII inflows, boosting market performance.
Bond Market Participation: FIIs actively invest in government securities, influencing yields and borrowing costs. During periods of global liquidity tightening, sudden exits have led to higher bond yields.
Currency Volatility: The Indian Rupee often experiences appreciation during FII inflows and depreciation during outflows, demonstrating the strong link between foreign investment and forex stability.
India’s regulatory framework, including SEBI guidelines, aims to encourage responsible FII participation while protecting market integrity and domestic investor interests.
11. Conclusion
Foreign Institutional Investors are both a boon and a challenge for domestic markets. Their capital inflows enhance liquidity, drive equity and bond market growth, and boost investor confidence. FIIs often bring discipline, professionalism, and global best practices to domestic markets.
However, their presence also introduces risks—short-term volatility, currency fluctuations, and dependency on foreign capital. Policymakers, regulators, and domestic investors must carefully manage these dynamics to ensure that FII participation contributes to sustainable long-term growth rather than creating vulnerabilities.
Ultimately, FIIs act as catalysts for investment and development, shaping markets, influencing policies, and connecting domestic economies with global financial trends. Understanding their impact helps investors make informed decisions, mitigates risks, and capitalizes on the opportunities presented by the interconnected world of finance.

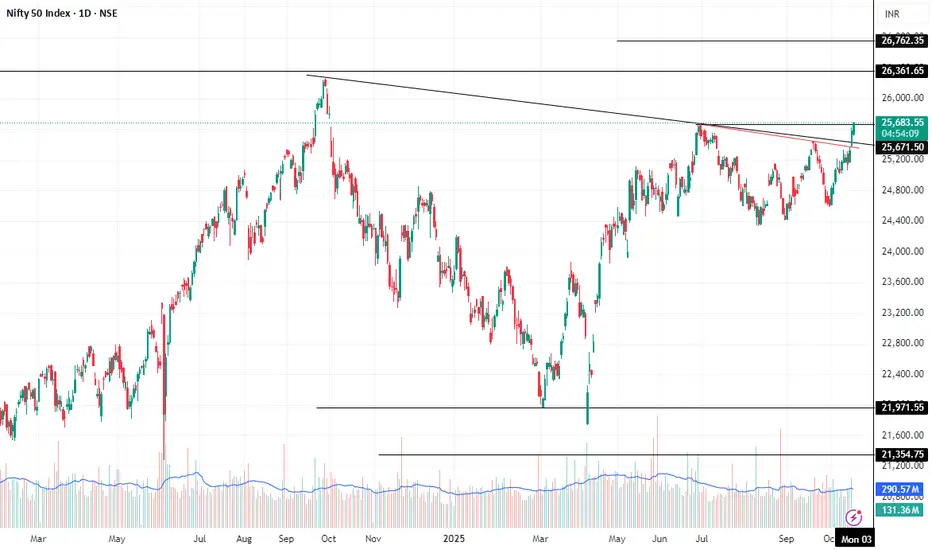
Nifty Crossed it's 52 week HighNifty spot has just cross it's 52 week high suggesting strong pullbacks from bottoms
let's see further when ATH will be chase!

Nifty breakout from C&h patternNifty has clearly broken out from Cup & handle pattern with neckiline 25,450
on the upside with target of
T1 = 26,750
T2 = 29,500
NIFTY Projection Base On Price action , Divergence Base, Possibility for Nifty Movement.
Do your Own Due Diligence before Trade

Nifty today levels - support and resistance Nifty today levels - support and resistance
Follow my yt channel link in dp
Recent news driven market activity has left liquidity intact Recent market behavior suggests that strong news-driven rallies have not eroded liquidity—both globally and in India, funding conditions remain stable even as volatility pickups are guided by macro events and earnings surprises.
"Traders who missed the rally should wait for a reversal near 24,800, which is likely to absorb leftover liquidity."

Nifty 50 Is Showing Sign of ReversalIn previous chart, Expected upsurge accomplished:
Nifty has reached the optimal supply zone and is expected to decline, at least up to 24,584 . The retracement of wave A (0.786) could act as a strong resistance for a reversal. The lower boundary lies at 24,120 , while 24,377 marks the low of wave (W). It’s better to consider the lower boundary as the potential maximum downside level.
Once the reversal level is identified, we will proceed toward the bullish path.
Stay tuned!
@Money_Dictators
Thanks :)

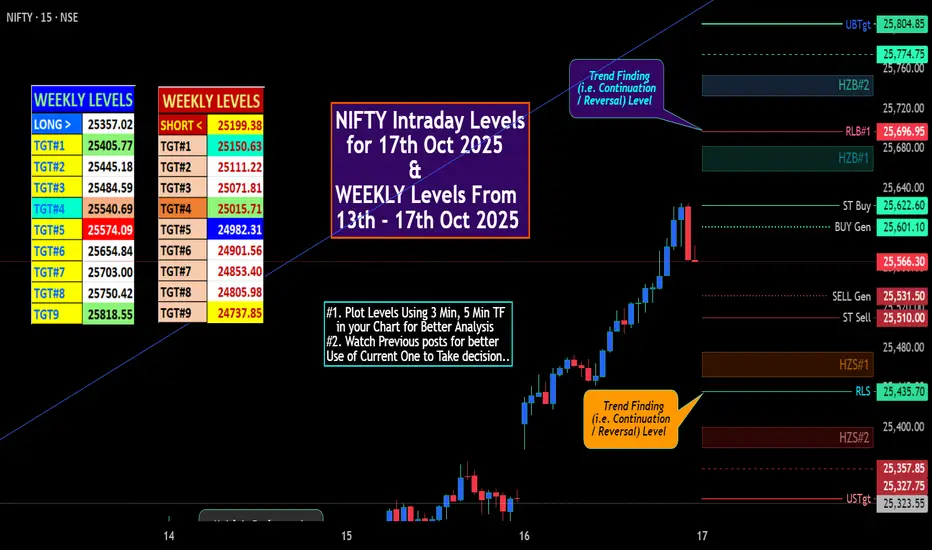
NIFTY Intraday & Swing Levels for 17th Oct 2025🚀 "WEEKLY Levels" mentioned in BOX format.
🌡️Plot Levels Using 3 Min, 5 Min Time frame in your Chart for Better Analysis
L#1: If the candle crossed & stays above the “Buy Gen”, it is treated / considered as Bullish bias.
L#2: Possibility / Probability of REVERSAL near RLB#1 & UBTgt
L#3: If the candle stays above “Sell Gen” but below “Buy Gen”, it is treated / considered as Sidewise. Aggressive Traders can take Long position near “Sell Gen” either retesting or crossed from Below & vice-versa i.e. can take Short position near “Buy Gen” either retesting or crossed downward from Above.
L#4: If the candle crossed & stays below the “Sell Gen”, it is treated / considered a Bearish bias.
L#5: Possibility / Probability of REVERSAL near RLS#1 & USTgt
HZB (Buy side) & HZS (Sell side) => Hurdle Zone,
*** Specialty of “HZB#1, HZB#2 HZS#1 & HZS#2” is Sidewise (behaviour in Nature)
Rest Plotted and Mentioned on Chart
Color code Used:
Green =. Positive bias.
Red =. Negative bias.
RED in Between Green means Trend Finder / Momentum Change
/ CYCLE Change and Vice Versa.
Notice One thing: HOW LEVELS are Working.
Use any Momentum Indicator / Oscillator or as you "USED to" to Take entry.
⚠️ DISCLAIMER:
The information, views, and ideas shared here are purely for educational and informational purposes only. They are not intended as investment advice or a recommendation to buy, sell, or hold any financial instruments. I am not a SEBI-registered financial adviser.
Trading and investing in the stock market involves risk, and you should do your own research and analysis. You are solely responsible for any decisions made based on this research.
"As HARD EARNED MONEY IS YOUR's, So DECISION SHOULD HAVE TO BE YOUR's".
Do comment if Helpful .
In depth Analysis will be added later (If time Permits)
Good time ahead for Nifty and overall market?So as we’ve been discussing for the past two days — NSE:NIFTY ’s PP was extremely tight, but we weren’t seeing the kind of sharp move that should’ve come. That meant bulls were being compressed through shakeouts. (Look at 14 Oct candle)
After that, when the next candle (on 15 Oct 2025) showed a pivot, it confirmed that all the liquidity generated from the shakeout had been completely absorbed.
That’s exactly why in yesterday’s commentary I mentioned that only half of the move had played out. And today, that remaining half clearly showed up.
So today’s move wasn’t a surprise to me at all. The structure from two sessions ago had already made everything clear.
Now, looking at the strength of today’s move — buyers’ volume was around 102 million till the second half, but by closing it dropped to nearly 60 million.
That tells us profit booking kicked in during the last hour, which might reflect tomorrow or the day after. If the market stays sideways for a bit, the next move could again be sharp.
So if you trade index actively, be ready for that upcoming setup.
Now let’s check what the data says for tomorrow:
Nifty’s Pivot stands at 25496, and the Pivot Percentile is wide, suggesting that momentum may cool off — meaning a sideways session is more likely.
Immediate support sits at 25450. If the index breaks below this level, we could see a dip towards 25250 in the coming days.
The Retail Index still remains in the safe zone, and the Market Breadth stays positive — which means this dip will be buyable, and equity stocks will likely continue to perform well.
Sector-wise, my focus still stays on NSE:NIFTY_IND_DEFENCE and $NSE:CNXAUTO. I’m accumulating quality TechnoFunda stocks from these sectors as part of my short-term plan.
📊 Levels at a glance:
Pivot: 25496
Support: 25450 (below = possible dip to 25250)
Resistance: 25580
Pivot Percentile: Wide (momentum cool-off / sideways possible)
Bias: Bullish trend intact, profit-booking likely short-term
Sectors to watch: Defence, Auto Parts
View: Buyable dip, accumulation phase for strong stocks
That’s all for the day. Take care and have a profitable tomorrow.

Strong Breakout for Nifty as it becomes a runaway train.After crossing the mid-channel resistance. Nifty has become a runaway train which has entered and overbought zone on hourly chart as it closed at 25585 with few critical resistances coming to fore. Channel top seems to be just near 26K at 25956. Other critical resistances are at 25586, 25698 and 25786 before it reaches 25956 or 26K. Support for Nifty at this juncture are at 25442, 25323, 25252 (Mother line support and the mid-channel support). Father line support is at 25064. Much required closing above 25500 has lifted the spirits of investors. With key resistances ahead and Nifty being overbought little correction or consolidation would be ideal before it can scale further heights.
Disclaimer: The above information is provided for educational purpose, analysis and paper trading only. Please don't treat this as a buy or sell recommendation for the stock or index. The Techno-Funda analysis is based on data that is more than 3 months old. Supports and Resistances are determined by historic past peaks and Valley in the chart. Many other indicators and patterns like EMA, RSI, MACD, Volumes, Fibonacci, parallel channel etc. use historic data which is 3 months or older cyclical points. There is no guarantee they will work in future as markets are highly volatile and swings in prices are also due to macro and micro factors based on actions taken by the company as well as region and global events. Equity investment is subject to risks. I or my clients or family members might have positions in the stocks that we mention in our educational posts. We will not be responsible for any Profit or loss that may occur due to any financial decision taken based on any data provided in this message. Do consult your investment advisor before taking any financial decisions. Stop losses should be an important part of any investment in equity.

Nifty 50 Still Bullish towards 26000keep your eyes for Nifty 50 towards 26000, as i said in last publish to be ready for bullish moment. i hope all of you enjoy that ride and earn good money.

Nifty levels - Oct 17, 2025Nifty support and resistance levels are valuable tools for making informed trading decisions, specifically when combined with the analysis of 5-minute timeframe candlesticks and VWAP. By closely monitoring these levels and observing the price movements within this timeframe, traders can enhance the accuracy of their entry and exit points. It is important to bear in mind that support and resistance levels are not fixed, and they can change over time as market conditions evolve.
The dashed lines on the chart indicate the reaction levels, serving as additional points of significance to consider. Furthermore, take note of the response at the levels of the High, Low, and Close values from the day prior.
We hope you find this information beneficial in your trading endeavors.
* If you found the idea appealing, kindly tap the Boost icon located below the chart. We encourage you to share your thoughts and comments regarding it.
Wishing you success in your trading activities!

Breakout buzz in nifty ➡️ OI contracts ~1% as futures premium widens to ~100 pts — short covering underway.
➡️️ Aggressive Put-writing at 25,200–25,300 signals a strong bullish base.
➡️ PCR surges from 0.68 → 0.99 - sentiment turns decisively bullish.

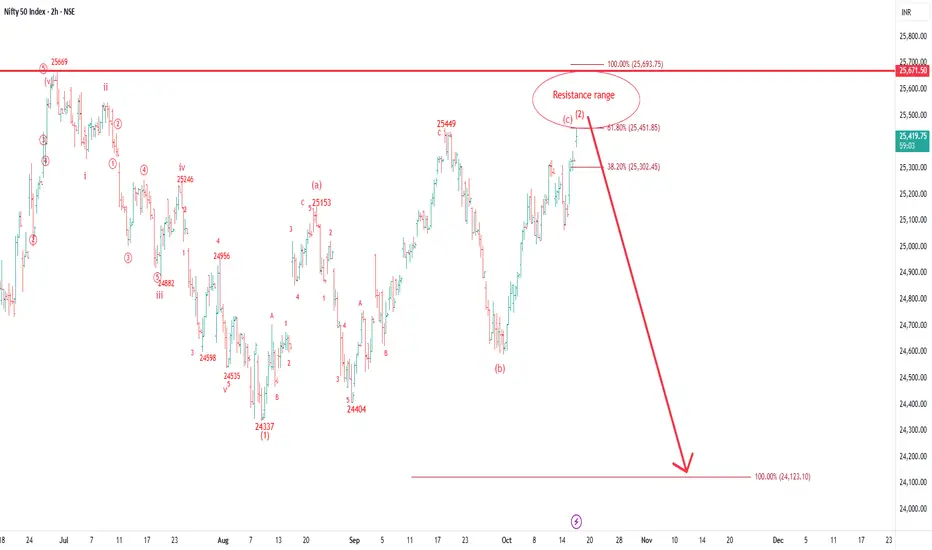
ALERT:Nifty is in Resistance range. Stay Cautious on Buying sideIn this 2hour chart Nifty formed a corrective pattern from 24337 and now it is near to its completion range and soon may decline below 24300 in coming days/weeks.
This analysis is based on Elliott wave Theory so If you have not understand Elliott wave then kindly ignore it.
Thank you.
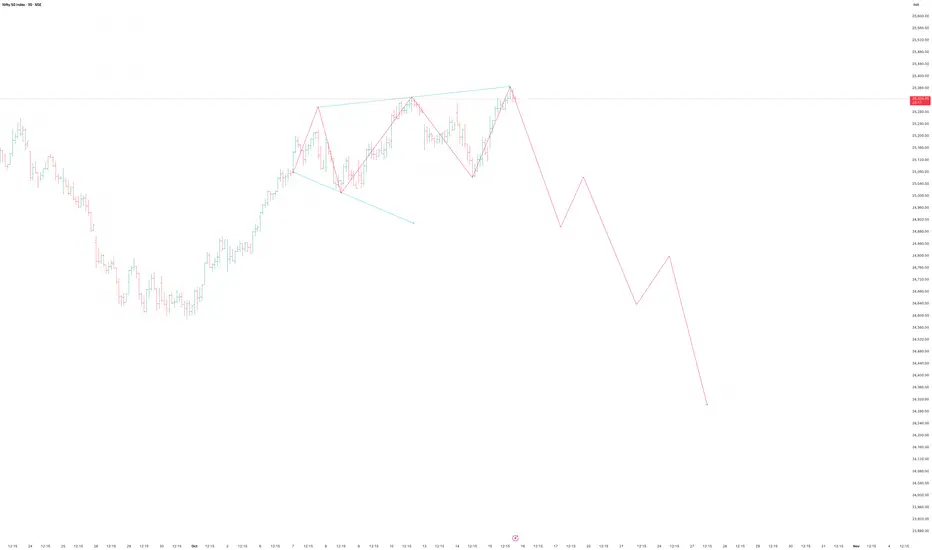
NIFTY Pattern analysis📈 Chart Structure Overview
The chart clearly shows a rising wedge formation — a bearish reversal pattern typically appearing at the end of a bullish rally.
✅ Summary View
Aspect Observation
Pattern Rising Wedge (Bearish)
Bias Short-term corrective / bearish
Key Resistance 25,380–25,420
Key Breakdown Zone 25,120
Targets 24,900 → 24,700 → 24,400
Stop-loss (for short) 25,450
Conclusion
Nifty’s price action suggests distribution and exhaustion at the top.
A confirmed breakdown below 25,120 could open up a short-term correction of 500–700 points.
Stay cautious of false breakouts above 25,400 unless backed by strong volume.
Disclaimer:
This analysis is for educational and technical insight purposes only.
Trading decisions should be based on your own confirmation strategy, volume validation, and risk management.
#Nifty50 today levels 16 October Nifty 50 today 16th October levels
Follow my yt channel link below in the dp

Nifty - Expecting a minor dip with short term bullishnessSo as we studied yesterday, a sharp move was under development — and that’s exactly what played out today.
Today’s move in NSE:NIFTY was genuine as it was backed by strong buyers’ volume of nearly 70 million.
However, I believe that’s just half the action I was expecting. Since today’s Pivot Percentile is again tight, we may see another sharp move soon.
Intraday momentum looks a bit exhausted, so a small dip can’t be ruled out.
Pivot has now moved up to 25300, which will act as intraday support tomorrow.
If this level breaks, we can see 25250–25180 levels being tested — that would be a good opportunity to collect longs.
A crucial support remains at 25100. The short-term trend stays clearly bullish as long as this level holds.
Next important resistance stands at 25355 — if Nifty breaks this, we could see another rally toward 25500 or even higher.
NSE:BANKNIFTY also looks strong after crossing its short-term resistance at 56156.
With this setup, we’re actively trading in NSE:CNXPSUBANK
Another short-term theme looking good right now is NSE:NIFTY_IND_DEFENCE
That’s all for the day. Take care and have a profitable tomorrow.
📊 Levels at a glance:
Pivot: 25300
Support 1: 25250–25180 (buy zone on dip)
Support 2: 25100 (crucial level)
Resistance: 25355 (break = rally to 25500+)
Pivot Percentile: Tight (sharp move likely)
Bias: Short-term bullish with minor intraday dip expected
Sectors to watch: PSU Banks, Defence

NIFTY Intraday & Swing Levels for 16th Oct 2025# "WEEKLY Levels" mentioned in BOX format.
^^^^^^^ Plot Levels Using 3 Min, 5 Min Time frame in your Chart for Better Analysis ^^^^^^^
L#1: If the candle crossed & stays above the “Buy Gen”, it is treated / considered as Bullish bias.
L#2: Possibility / Probability of REVERSAL near RLB#1 & UBTgt
L#3: If the candle stays above “Sell Gen” but below “Buy Gen”, it is treated / considered as Sidewise. Aggressive Traders can take Long position near “Sell Gen” either retesting or crossed from Below & vice-versa i.e. can take Short position near “Buy Gen” either retesting or crossed downward from Above.
L#4: If the candle crossed & stays below the “Sell Gen”, it is treated / considered a Bearish bias.
L#5: Possibility / Probability of REVERSAL near RLS#1 & USTgt
HZB (Buy side) & HZS (Sell side) => Hurdle Zone,
*** Specialty of “HZB#1, HZB#2 HZS#1 & HZS#2” is Sidewise (behaviour in Nature)
Rest Plotted and Mentioned on Chart
Color code Used:
Green =. Positive bias.
Red =. Negative bias.
RED in Between Green means Trend Finder / Momentum Change
/ CYCLE Change and Vice Versa.
Notice One thing: HOW LEVELS are Working.
Use any Momentum Indicator / Oscillator or as you "USED to" to Take entry.
⚠️ DISCLAIMER:
The information, views, and ideas shared here are purely for educational and informational purposes only. They are not intended as investment advice or a recommendation to buy, sell, or hold any financial instruments. I am not a SEBI-registered financial adviser.
Trading and investing in the stock market involves risk, and you should do your own research and analysis. You are solely responsible for any decisions made based on this research.
"As HARD EARNED MONEY IS YOUR's, So DECISION SHOULD HAVE TO BE YOUR's".
Do comment if Helpful .
In depth Analysis will be added later (If time Permits)

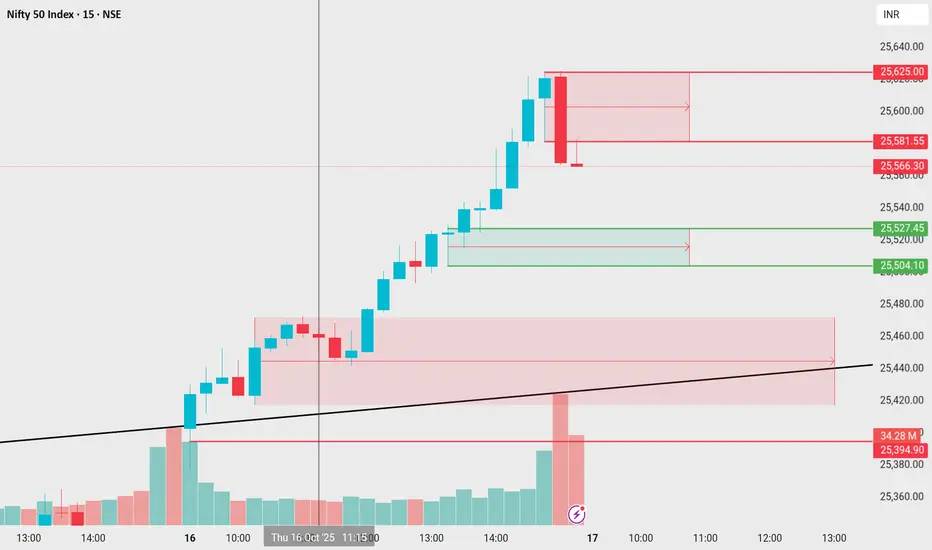
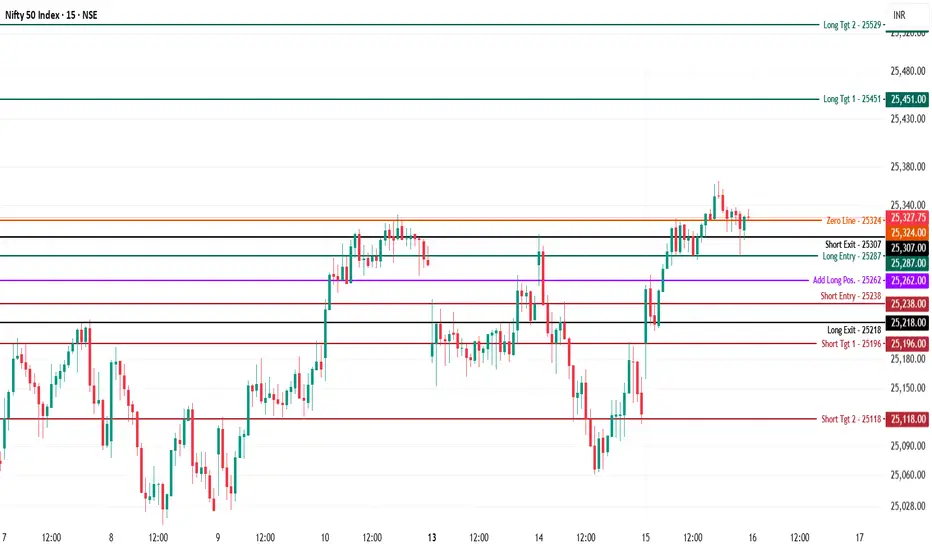
Nifty50 Index - Intraday Technical Analysis - 16th Oct., 2025NSE:NIFTY — Chart Pathik Insights
Today’s Nifty levels spotlight structured action, clear confirmation, and defined risk for every type of trader.
Nifty is currently oscillating at 25,328, just below the zero line (25,324) following a persistent grind and minor rejection at local highs.
Bearish Outlook
Maintain a short bias if price slips below 25,238, with early selling pressure or resistance at the zero line.
Downside Levels to Watch:
25,196: First profit-taking zone for shorts or scalpers.
25,118: Stronger extension if the move develops.
Risk Control: Shorts are best held beneath 25,218; reverse on strength above 25,262.
Bullish Outlook
Fresh long setups emerge above 25,287, confirmed if buyers push past 25,307 and hold higher.
Upside Levels to Watch:
25,451: Profit zone for trend traders or first major resistance.
25,529: High extension if momentum eases above supply.
Risk Control: Longs may be protected at 25,262 or 25,238, with adjustments per session’s volatility.
Neutral Range Logic
25,324 is the balance beam — further coil or choppy behavior here means patience is wise. Wait for a solid break outside this range for higher conviction trades.
Use these levels as your map for daily clarity and preparation.
If this adds to your trading confidence, boost, comment, and share — active feedback keeps this discipline alive.
Follow Chart Pathik for unbiased structure, risk-mapped logic, and a daily learning edge.
Nifty levels - Oct 16, 2025Nifty support and resistance levels are valuable tools for making informed trading decisions, specifically when combined with the analysis of 5-minute timeframe candlesticks and VWAP. By closely monitoring these levels and observing the price movements within this timeframe, traders can enhance the accuracy of their entry and exit points. It is important to bear in mind that support and resistance levels are not fixed, and they can change over time as market conditions evolve.
The dashed lines on the chart indicate the reaction levels, serving as additional points of significance to consider. Furthermore, take note of the response at the levels of the High, Low, and Close values from the day prior.
We hope you find this information beneficial in your trading endeavors.
* If you found the idea appealing, kindly tap the Boost icon located below the chart. We encourage you to share your thoughts and comments regarding it.
Wishing you success in your trading activities!

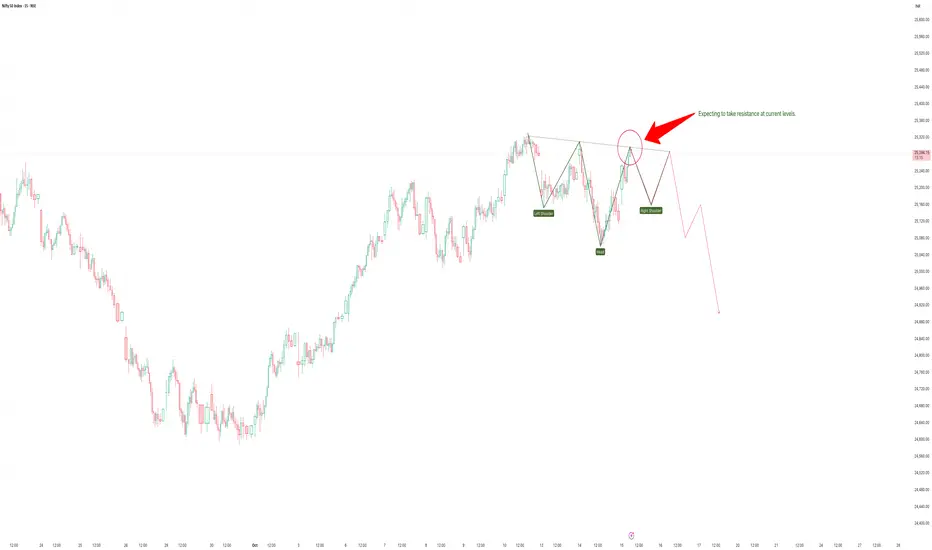
NIFTY 50 technical analysis based on 15-min chart:📊 Chart Structure Overview
The chart clearly displays a Head and Shoulders (H&S) formation — a bearish reversal pattern developing after a strong uptrend.
Left Shoulder: Around 25,350 region
Head: Formed near 25,475
Right Shoulder: Currently forming near 25,330–25,350
Neckline: Roughly around 25,120
You’ve correctly marked “Expecting to take resistance at current levels”, which aligns with the right shoulder zone, a classical point for potential downside reversal.
⚙️ Pattern Implications
Scenario 1 – Breakdown Confirmation (Bearish)
A decisive break below the neckline (≈25,120) with volume confirmation would validate the pattern.
Projected target:
Height of the head-to-neckline ≈ 350 points →
Breakdown target zone = 25,120 – 350 = 24,770
→ Immediate supports: 24,950 → 24,770 → 24,680
Scenario 2 – Rejection Fails (Bullish Reversal Invalidated)
If Nifty closes above 25,380–25,400 with momentum, the right shoulder fails.
That could lead to short covering up to 25,500–25,550 before re-evaluating the bearish bias.
🔍 Volume & Momentum
Volume shows diminishing strength during the recent right shoulder rise — typical in a distribution phase.
RSI (if plotted) would likely show bearish divergence — price making lower high vs. RSI making higher high.
This supports your expectation of rejection near current resistance.
🧭 Short-Term View (Next 1–3 Sessions)
Bias Level Action
Bearish below 25,120 Breakdown confirmation → expect 24,950 → 24,770
Neutral zone 25,120–25,350 Wait for candle confirmation near neckline
Bullish reversal only above 25,400 Pattern invalidation; potential push to 25,500–25,550
🧠 Conclusion
The Head & Shoulders pattern near the top suggests distribution and possible short-term correction.
Expect pullback rejection near 25,330–25,350 and a move toward 25,000–24,800 if neckline breaks.
Keep stops above 25,400 for short setups.
Summary:
✅ Pattern: Head & Shoulders
⚠️ Trigger Point: Breakdown below 25,120
🎯 Target Zone: 24,950–24,770
🔒 Stop-loss (for shorts): 25,400
Disclaimer:
This analysis is for educational and technical research purposes only, not financial advice. Market movements are subject to volatility; always confirm with your own entry and risk parameters before trading.
Nifty50 Index - Intraday Technical Analysis - 15th Oct., 2025NSE:NIFTY — Chart Pathik Insights
Nifty levels are shared to keep your intraday playbook clear, logical, and proactive. Each level is mapped for real-time decision making, discipline, and preparation.
Nifty is actively trading near 25,123, consolidating just below the zero line (25,146) after a tight series of swings and pressure at support.
Bearish Outlook
Short bias remains valid below 25,156, especially if sellers control momentum at the zero line or beneath it.
Downside Levels to Watch:
24,991: Key first target for covering or booking profits on shorts.
24,896: Major extension if the trend intensifies lower.
Risk Control: Shorts remain actionable below 25,132; cover if Nifty reclaims 25,185.
Bullish Outlook
New long ideas develop above 25,185, with participates confirming the move on closes over 25,215.
Upside Levels to Watch:
25,300: First resistance to watch for profit booking.
25,395: Higher breakout extension for strong markets.
Risk Control: Longs can be protected near 25,156 or 25,132 as structure develops.
Neutral Range Logic
The current chop band is defined by the 25,146 zero line. If Nifty continues to pivot around this level, expect range-bound or whipsaw action until a clean directional break is established. Wait for clear moves above/below the band to clarify the next trend.
📊 For those who value daily structure, strategy, and discipline, these levels arrive each session.
If these insights benefit your trading, boost, comment, and share — your participation is the fuel for continuous chart work.
Follow Chart Pathik for straightforward trading clarity, unbiased market reads, and a disciplined approach to market preparation.
