Nifty levels - Oct 15, 2025Nifty support and resistance levels are valuable tools for making informed trading decisions, specifically when combined with the analysis of 5-minute timeframe candlesticks and VWAP. By closely monitoring these levels and observing the price movements within this timeframe, traders can enhance the accuracy of their entry and exit points. It is important to bear in mind that support and resistance levels are not fixed, and they can change over time as market conditions evolve.
The dashed lines on the chart indicate the reaction levels, serving as additional points of significance to consider. Furthermore, take note of the response at the levels of the High, Low, and Close values from the day prior.
We hope you find this information beneficial in your trading endeavors.
* If you found the idea appealing, kindly tap the Boost icon located below the chart. We encourage you to share your thoughts and comments regarding it.
Wishing you success in your trading activities!
Trade ideas

Nifty Short Logic
After testing 25300, the index found resistance. Now, the index is in a corrective wave.
25k is now the level where support/DZ lies for the index. 25300 / 25000 should be the
range for the short term.

International Trade Policies and Market Reactions1. Evolution of International Trade Policies
1.1 Early Mercantilism to Free Trade
From the 16th to 18th centuries, trade was dominated by mercantilist policies — where nations sought to maximize exports and minimize imports to accumulate gold and silver. Colonial powers like Britain, France, and Spain established monopolistic trade routes to extract wealth from colonies.
The late 18th and 19th centuries saw the emergence of free trade ideology, led by economists like Adam Smith and David Ricardo. Smith’s The Wealth of Nations (1776) argued that nations should specialize in producing goods where they hold an absolute advantage, while Ricardo’s theory of comparative advantage demonstrated that even less efficient countries benefit from trade if they specialize relatively.
The 19th century ushered in a wave of trade liberalization, with the British Corn Laws repeal (1846) marking a major shift toward open markets.
1.2 The Rise and Fall of Protectionism
The Great Depression (1929–1939) marked a turning point. Countries imposed tariffs and quotas to protect domestic industries, triggering a global collapse in trade. The infamous U.S. Smoot-Hawley Tariff Act (1930) raised tariffs on over 20,000 imports, leading to retaliations and worsening economic conditions.
After World War II, nations recognized the need for cooperative trade frameworks to prevent such economic nationalism. This led to the establishment of the General Agreement on Tariffs and Trade (GATT) in 1947, promoting tariff reduction and trade liberalization.
1.3 The WTO Era and Beyond
In 1995, GATT evolved into the World Trade Organization (WTO) — a comprehensive body overseeing global trade rules, dispute resolution, and policy negotiations. WTO membership grew to 160+ nations, significantly integrating developing economies into the global system.
However, by the 2010s, trade liberalization faced resistance. The rise of China, global financial crises, nationalism, and technological disruptions renewed debates on whether free trade truly benefits all. Trade wars — especially between the U.S. and China — revealed the fragility of the open trading system.
2. Key Instruments of International Trade Policy
2.1 Tariffs
A tariff is a tax imposed on imported goods. It serves both as a revenue source and a protectionist tool. For instance, higher tariffs on steel imports make domestic steel more competitive. However, they often lead to retaliatory tariffs, inflationary pressure, and inefficiencies in global supply chains.
2.2 Quotas and Import Restrictions
Quotas limit the volume of imports of specific goods. Unlike tariffs, which adjust prices, quotas directly restrict quantities. Quotas are often used in sensitive industries such as agriculture, textiles, and automobiles to protect domestic producers.
2.3 Subsidies and Export Incentives
Governments often provide subsidies to domestic industries to boost exports. For example, agricultural subsidies in the U.S. and EU have long been criticized for distorting international competition. Export incentives, such as tax breaks, help national firms expand globally.
2.4 Trade Agreements
Trade agreements are either bilateral, regional, or multilateral. They define trade rules, tariffs, and dispute resolution frameworks. Examples include:
NAFTA/USMCA (North America)
European Union (EU) Single Market
ASEAN Free Trade Area (AFTA)
Comprehensive and Progressive Agreement for Trans-Pacific Partnership (CPTPP)
Such agreements often lead to increased cross-border investments and market integration.
2.5 Non-Tariff Barriers (NTBs)
NTBs include standards, licensing requirements, and regulations that indirectly restrict trade. For instance, safety standards on food imports or environmental norms on manufacturing can act as barriers, especially for developing nations.
3. Role of International Organizations
3.1 The World Trade Organization (WTO)
The WTO is the primary body overseeing trade liberalization and dispute settlement. It ensures that trade policies are predictable, transparent, and non-discriminatory. However, the WTO has struggled to address digital trade, state subsidies, and China’s economic model, leading to calls for reform.
3.2 International Monetary Fund (IMF)
While not a trade body, the IMF stabilizes global financial systems by providing liquidity to countries with trade imbalances. Its policies often influence trade indirectly through exchange rate stabilization and macroeconomic adjustments.
3.3 World Bank and Regional Development Banks
The World Bank, Asian Development Bank (ADB), and African Development Bank (AfDB) finance infrastructure that supports trade — ports, logistics, and transport networks. These institutions promote trade integration for developing economies.
3.4 Regional Trade Blocs
Organizations like the European Union (EU) and African Continental Free Trade Area (AfCFTA) represent regional approaches to trade governance, focusing on internal liberalization while negotiating collectively with external partners.
4. Case Studies: Trade Policy and Market Reactions
4.1 U.S.-China Trade War (2018–2020)
The U.S.-China trade conflict began when the United States imposed tariffs on Chinese goods worth over $360 billion, accusing China of intellectual property theft and unfair subsidies. China retaliated with tariffs on U.S. exports.
Market Reactions:
Equity markets fell sharply during tariff announcements, with major indices like the S&P 500 and Shanghai Composite showing volatility.
Commodity prices, especially soybeans and rare earth metals, were disrupted due to changing trade routes.
The U.S. dollar strengthened as investors sought safety, while emerging market currencies depreciated.
Multinational corporations diversified production out of China, shifting supply chains to Vietnam, India, and Mexico.
4.2 Brexit and European Trade Dynamics
The United Kingdom’s exit from the European Union (Brexit) in 2020 marked a historic shift in trade policy. It introduced customs checks and regulatory divergence.
Market Reactions:
The British pound (GBP) experienced extreme volatility, depreciating nearly 15% after the 2016 referendum.
UK equity markets underperformed, while European indices also saw uncertainty.
Long-term bond yields dropped due to investor flight to safety.
Trade volumes between the UK and EU initially fell but later stabilized as new trade deals were negotiated.
4.3 NAFTA to USMCA Transition
The United States-Mexico-Canada Agreement (USMCA) replaced NAFTA in 2020, modernizing rules on digital trade, labor, and environmental standards.
Market Reactions:
North American equity markets reacted positively due to reduced uncertainty.
The Canadian dollar and Mexican peso gained strength after the deal’s ratification.
Automobile industry supply chains adapted to new “rules of origin,” affecting production strategies.
4.4 COVID-19 Pandemic and Trade Restrictions
During the COVID-19 crisis, nations imposed export bans on medical equipment, vaccines, and food products, disrupting supply chains globally.
Market Reactions:
Commodity and logistics markets experienced historic price spikes.
Shipping costs (Baltic Dry Index) soared, reflecting port closures and demand surges.
Equities in logistics and technology sectors gained, while tourism and manufacturing sectors declined sharply.
5. Mechanisms of Market Reactions to Trade Policies
5.1 Currency Markets
Currency values are among the most sensitive indicators of trade policy changes. A nation imposing tariffs on imports can experience currency appreciation if it reduces import demand. Conversely, trade tensions often weaken emerging market currencies due to capital outflows.
Example: During the 2018 trade war, the Chinese Yuan (CNY) depreciated over 10% against the U.S. Dollar (USD), reflecting reduced export expectations.
5.2 Stock Markets
Trade policies directly affect corporate profits and investor sentiment:
Export-heavy industries (e.g., technology, manufacturing) are vulnerable to tariffs.
Domestic-oriented sectors (e.g., utilities, healthcare) may benefit from protectionist measures.
Stock markets often respond immediately to policy news. For instance, when trade agreements are signed, equity indices surge due to improved confidence.
5.3 Commodity Markets
Trade policies influence the demand and supply dynamics of commodities:
Oil and metals prices react to industrial production expectations.
Agricultural commodities are highly sensitive to tariffs and quotas.
Example: During the U.S.-China trade conflict, China shifted soybean imports from the U.S. to Brazil, boosting Brazilian exports and altering global price structures.
5.4 Bond Markets
Government bond yields reflect investor risk perceptions. During trade disputes, investors seek safe-haven assets like U.S. Treasuries or German Bunds, pushing yields down. Conversely, successful trade agreements often lead to yield increases as growth expectations rise.
5.5 Investor Sentiment and Volatility
Trade uncertainty amplifies market volatility. The VIX Index, a measure of market fear, often spikes during trade negotiations or tariff announcements. High volatility can deter investment, increase hedging costs, and reduce liquidity.
6. The Political Economy of Trade
Trade policy decisions are influenced not only by economics but also by domestic politics and geopolitical strategy. Policymakers balance between protecting local industries and maintaining international competitiveness.
Protectionism appeals to domestic voters during unemployment or deindustrialization phases.
Free trade is supported by multinational corporations and export-oriented economies.
Geopolitical trade tools, such as sanctions or technology restrictions, are increasingly used to assert national power — seen in U.S. restrictions on Chinese semiconductor access.
Thus, trade policy often reflects both economic rationale and strategic interests, leading to complex market outcomes.
7. The Future of Global Trade Policy
7.1 Digital Trade and E-Commerce
The rise of digital trade — cross-border e-commerce, data flows, and cloud services — is reshaping trade frameworks. The WTO and regional agreements now include digital trade chapters, ensuring free data flow while protecting privacy.
7.2 Green Trade Policies
Climate change has introduced carbon border adjustment mechanisms (CBAM) and ESG-linked trade standards. For example, the EU’s CBAM imposes tariffs on imports with high carbon footprints, influencing global supply chains toward sustainability.
7.3 Regionalization and Supply Chain Realignment
The post-pandemic world is witnessing “friend-shoring” and regionalization — where trade partners are chosen based on political alignment rather than cost efficiency. This trend reshapes trade flows, especially in semiconductors, rare earths, and energy.
7.4 Reforming the WTO
To remain relevant, the WTO must adapt to the digital economy, industrial subsidies, and state capitalism. Its dispute settlement system, currently weakened, needs restoration for fair enforcement of rules.
7.5 Artificial Intelligence and Automation
AI and robotics are transforming production and trade competitiveness. Nations that leverage technology to increase productivity will gain comparative advantages, altering traditional labor-cost-based trade models.
Conclusion
International trade policies form the framework through which global commerce operates, shaping patterns of production, consumption, and investment. Over time, the pendulum has swung between free trade and protectionism, reflecting shifting political priorities and economic realities.
Market reactions to trade policy changes are immediate and far-reaching, influencing currencies, equities, bonds, and commodities. Investors interpret these signals to assess risks and opportunities across global markets.
As the world faces geopolitical fragmentation, technological transformation, and environmental imperatives, the future of trade policy will depend on adaptability and cooperation. A balance between national interests and global integration will be key to ensuring sustainable economic growth and market stability.

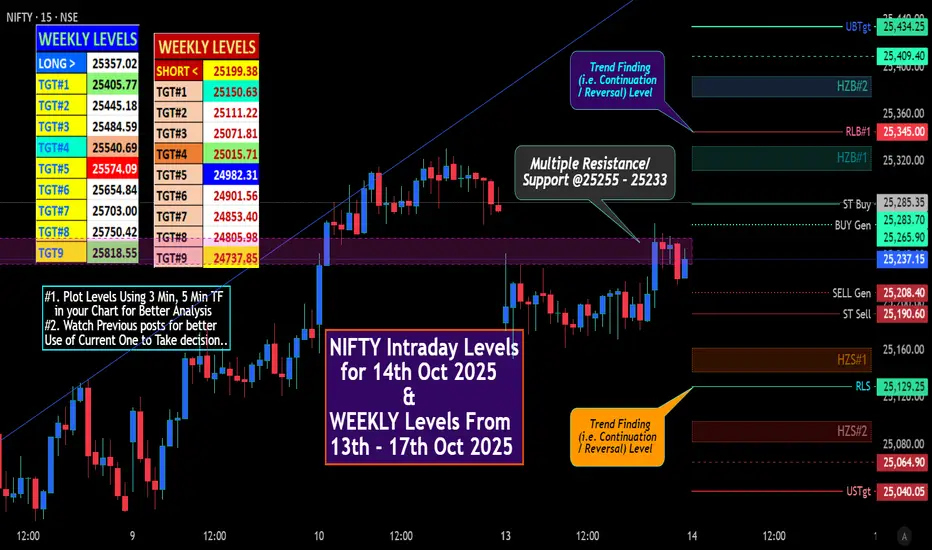
NIFTY Intraday & Swing Levels for 14th Oct 2025IndiaVIX UP 9.01%. Volatility Increased in today's Session.
Analysis of recent trends in the NIFTY in respect of Put Call Ratio (PCR):
Latest PCR (OI) for Nifty: 1.02 (13-Oct-2025, market close)
Put Open Interest: 26,52,567
Call Open Interest: 25,94,255
Put OI Change: -2,85,365 (decrease)
Call OI Change: +5,06,005 (increase)
Intraday PCR Change: -0.56
Trend Analysis
PCR slightly above 1: Indicates a market position that is marginally bullish, as put OI is just above call OI, but not in extreme territory. This often means a neutral to moderately positive sentiment.
Recent Movement:
Put positions reduced (indicating some hedging is removed or traders expect less downside).
Call positions strongly increased (reflecting participants adding to bullish bets).
The intraday PCR delta is negative, suggesting a shift toward calls during today’s session, which sometimes precedes short-term tops or reversals if the sentiment gets too bullish.
Conclusion
Recent days show a shift from neutral/mildly bullish to slightly more aggressive positive sentiment.
If PCR dips below 1 or surges above 1.3 in coming days, that may indicate a market reversal or a strong trend continuation.
Keep monitoring PCR along with price action for confirmation of market direction.
# "WEEKLY Levels" mentioned in BOX format.
^^^^^^^ Plot Levels Using 3 Min, 5 Min Time frame in your Chart for Better Analysis ^^^^^^^
L#1: If the candle crossed & stays above the “Buy Gen”, it is treated / considered as Bullish bias.
L#2: Possibility / Probability of REVERSAL near RLB#1 & UBTgt
L#3: If the candle stays above “Sell Gen” but below “Buy Gen”, it is treated / considered as Sidewise. Aggressive Traders can take Long position near “Sell Gen” either retesting or crossed from Below & vice-versa i.e. can take Short position near “Buy Gen” either retesting or crossed downward from Above.
L#4: If the candle crossed & stays below the “Sell Gen”, it is treated / considered a Bearish bias.
L#5: Possibility / Probability of REVERSAL near RLS#1 & USTgt
HZB (Buy side) & HZS (Sell side) => Hurdle Zone,
*** Specialty of “HZB#1, HZB#2 HZS#1 & HZS#2” is Sidewise (behaviour in Nature)
Rest Plotted and Mentioned on Chart
Color code Used:
Green =. Positive bias.
Red =. Negative bias.
RED in Between Green means Trend Finder / Momentum Change
/ CYCLE Change and Vice Versa.
Notice One thing: HOW LEVELS are Working.
Use any Momentum Indicator / Oscillator or as you "USED to" to Take entry.
⚠️ DISCLAIMER:
The information, views, and ideas shared here are purely for educational and informational purposes only. They are not intended as investment advice or a recommendation to buy, sell, or hold any financial instruments. I am not a SEBI-registered financial adviser.
Trading and investing in the stock market involves risk, and you should do your own research and analysis. You are solely responsible for any decisions made based on this research.
"As HARD EARNED MONEY IS YOUR's, So DECISION SHOULD HAVE TO BE YOUR's".
Do comment if Helpful .
In depth Analysis will be added later
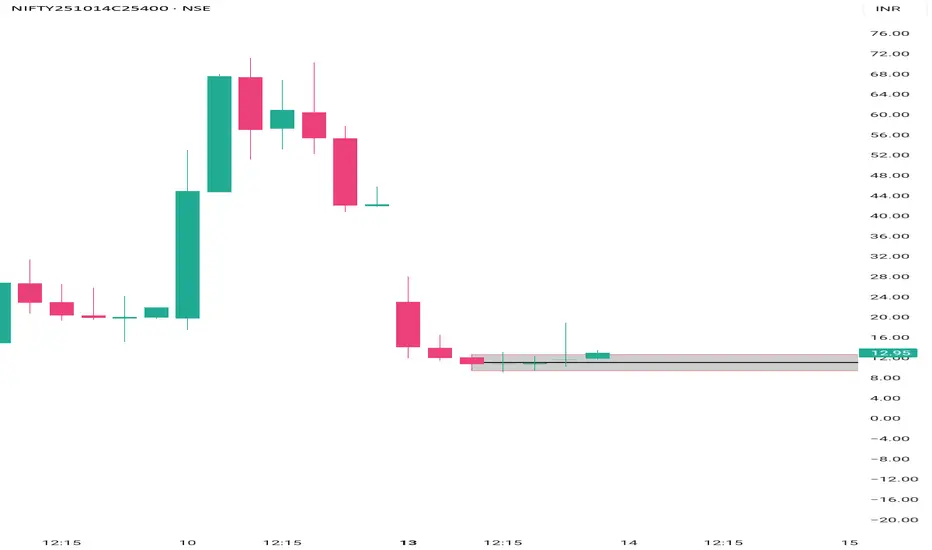
Today expiry #Nifty50- 25400 call check levelsToday expiry #Nifty50- 25400 call check levels
Follow my yt channel.... Link in dp
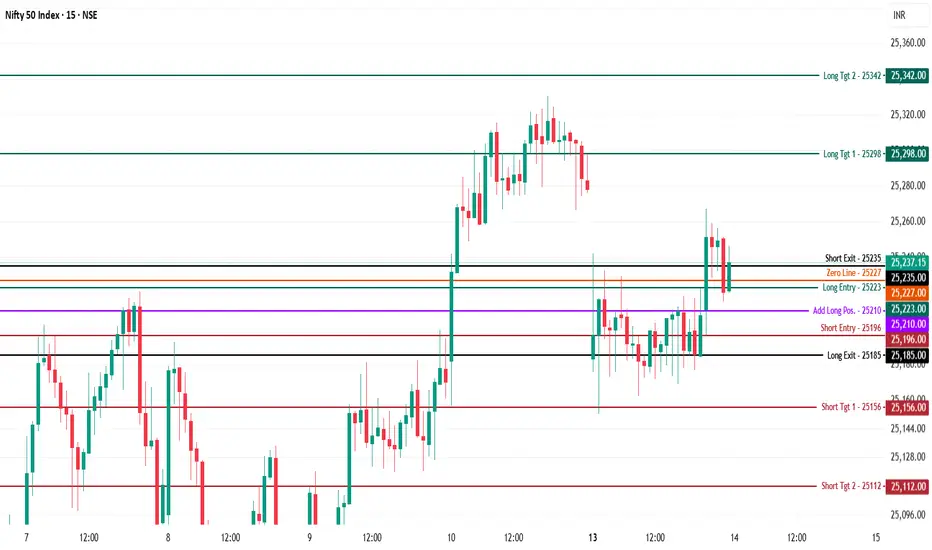
Nifty50 Index - Intraday Technical Analysis - 14th Oct., 2025NSE:NIFTY
Nifty is trading at 25,237.15, just above the zero line (25,227) after a strong recovery from session lows and testing key resistance bands.
Bearish Scenario
Short Entry (25,196): Shorts become actionable below 25,196, especially if price fails to sustain above 25,185 (long exit) and reverses momentum.
Downside Targets:
25,156 (Target 1): First mapped support, logical for covering shorts.
25,112 (Target 2): Extension if momentum intensifies through session lows.
Stop Loss: Retain shorts only below 25,185; cover if Nifty retakes 25,223.
Bullish Scenario
Long Entry (25,223): Fresh longs activate above 25,223, with strongest confirmation on a close above 25,235 (short exit).
Upside Targets:
25,298 (Target 1): First resistance for profit booking.
25,342 (Target 2): High extension area if momentum continues.
Stop Loss: Use 25,210 or 25,196 as active risk controls.
Neutral/Range Logic
Zero Line (25,227):
Expect choppy price action around zero line; wait for a clear breakout or breakdown plus 15-min candle close for high-conviction trades.
The opening hour’s close above or below zero line will likely determine session trend.
All levels are structured for confirmation on 5/15-min candle closes, keeping focus on clarity and actionable best practices.
If you find these levels helpful, please boost, comment, and share. Follow for daily key levels and transparent market logic!
Reach out in comments, no hassle—just pure learning and sharing. Your engagement is what fuels this effort and helps all active viewers!
Nifty levels - Oct 14, 2025Nifty support and resistance levels are valuable tools for making informed trading decisions, specifically when combined with the analysis of 5-minute timeframe candlesticks and VWAP. By closely monitoring these levels and observing the price movements within this timeframe, traders can enhance the accuracy of their entry and exit points. It is important to bear in mind that support and resistance levels are not fixed, and they can change over time as market conditions evolve.
The dashed lines on the chart indicate the reaction levels, serving as additional points of significance to consider. Furthermore, take note of the response at the levels of the High, Low, and Close values from the day prior.
We hope you find this information beneficial in your trading endeavors.
* If you found the idea appealing, kindly tap the Boost icon located below the chart. We encourage you to share your thoughts and comments regarding it.
Wishing you success in your trading activities!

NSE TECHNICAL ANALYSIS - 15 MINS. 1. Structure Overview
The chart shows a clear short-term distribution structure forming at the top.
The index made a sharp rally, followed by a double-top / lower-high pattern, confirming momentum exhaustion.
A descending trendline (drawn in light blue) connects the lower highs, showing developing downward pressure.
The latest consolidation appears as a bear flag or rising wedge within this broader down channel.
2. Key Technical Observations
Trend Bias:
The broader trend on higher timeframes (1H–2H) remains bullish, but the 15-min structure shows short-term weakness.
Pattern:
A bear flag / wedge inside a down channel. If price breaks below the lower flag boundary (around 25,150), it confirms a continuation move down.
Support Zone:
The next strong support lies around 24,950–24,900, aligning with the projected lower trendline.
Volume Analysis:
Volume has been tapering off during the flag formation — a typical sign of temporary pullback before continuation of the prior leg (downward).
Resistance Zone:
Immediate resistance stands near 25,300–25,350, which coincides with the flag’s upper boundary and previous supply zone.
3. Expected Price Path (as drawn in pink)
A potential retest near 25,280–25,300 region.
Breakdown expected below 25,150.
Projected move:
25,150 → 25,000 → 24,950 → 24,900 (trendline target).
The drawn projection suggests a stair-step decline with intermittent pullbacks, typical of corrective patterns.
4. Trading View
For Intraday Traders:
A break below 25,150 can trigger short setups with a target around 25,000–24,950.
Stop-loss: Above 25,320 (recent high).
Risk-Reward: ~1:2 possible if entry aligns with breakdown confirmation.
For Swing Traders:
Wait for confirmation on 30-min/1-hour candle close below 25,150 before entering.
5. Summary
Parameter Observation
Current Bias Short-term bearish
Key Resistance 25,300–25,350
Key Support 25,000–24,900
Pattern Bear Flag / Rising Wedge
Momentum Weakening
Next Likely Move Breakdown toward 24,900 zone
Conclusion:
The current NIFTY 15-min chart indicates short-term weakness with a potential downward continuation once the 25,150 level breaks. However, if the index sustains above 25,300 with volume, the bias may shift back to neutral.
Disclaimer:
This analysis is for educational purposes only and not financial advice. Market conditions may change rapidly; always manage risk and validate signals with your own strategy before trading.

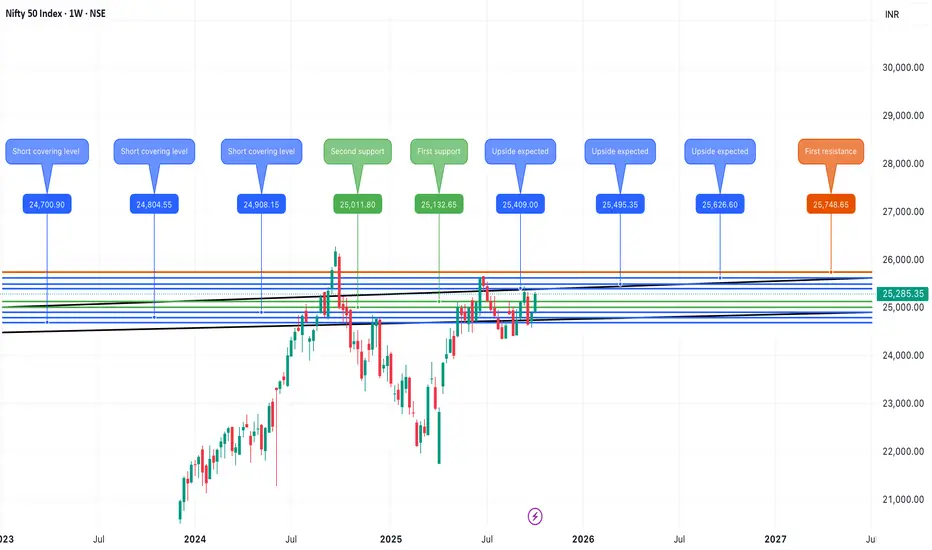
Nifty 50 Weekly Outlook (13th Oct – 17th Oct 2025)The Nifty 50 ended the last week at 25,285.35, gaining +1.57%.
🔹 Key Levels for this Week (13th – 17th Oct 2025)
📌 Price Action Pivot Zone:
25,206 to 25,365 – This blue-shaded range is the critical decision-making zone. A sustained move beyond this range could define the market’s direction for the upcoming week.
🔻 Support Levels:
Support 1 (S1): 24,969
Support 2 (S2): 24,653
Support 3 (S3): 24,365
🔺 Resistance Levels:
Resistance 1 (R1): 25,605
Resistance 2 (R2): 25,925
Resistance 3 (R3): 26,320
Market Outlook
✅ Bullish Scenario:
If Nifty sustains above the pivot zone high of 25,365, it may continue its upward momentum toward R1 (25,605). Further strength could take the index toward R2 (25,925) and R3 (26,320).
❌ Bearish Scenario:
A breakdown below the pivot low of 25,206 could trigger selling pressure. On the downside, the index may test S1 (24,969), with extended weakness dragging it toward S2 (24,653) and S3 (24,365).
Disclaimer: tinyurl.com

Nifty 50 – Cup & Handle Breakout Formation on RadarNifty 50 – Cup & Handle Breakout Formation on Radar
NSE:NIFTY
📈 Pattern & Setup:
The Nifty index is shaping a beautiful Cup and Handle pattern — one of the most powerful continuation structures in technical analysis. The broader cup has been forming since September last year, showing a long accumulation phase where smart money kept absorbing supply.
The recent price action is forming the handle part — a short, controlled pullback after the recovery from 23,800 levels. Buyers are steadily returning, and the index is coiling just below the neckline around 25,200–25,300. A breakout above this zone could set the stage for a move toward 28,700.
📝 Trade Plan:
✍Entry: Above 25,300 (breakout confirmation)
🚩Stop-Loss: 24,850 (below handle low)
🎯Targets:
Target 1 → 26,400
Target 2 → 28,700 (12.7% potential move)
💡 Pyramiding Strategy:
1. Enter with 60% position on breakout above 25,300
2. Add remaining 40% above 25,700 with strong volume
3. Trail stop-loss to 25,000 once price sustains above 26,000
🧠 Logic Behind This Setup:
The Cup & Handle reflects long-term bullish sentiment gradually resurfacing after a correction. Volume behavior has been textbook — declining during the base formation and increasing during the right-side recovery. With momentum returning, a breakout above the neckline could confirm the next leg of the primary uptrend.
Keep Learning. Keep Earning.
Let’s grow together 📚🎯
🔴Disclaimer:
This analysis is for educational purposes only. Not a buy/sell recommendation. Please do your own research or consult your financial advisor before trading.

NIFTY 13th Oct'2025 | LONG | BULLISH Nifty : Bullish Trend
Long Entry
15m after sell-side lq sweep market likely move to bullish trend until above zone.

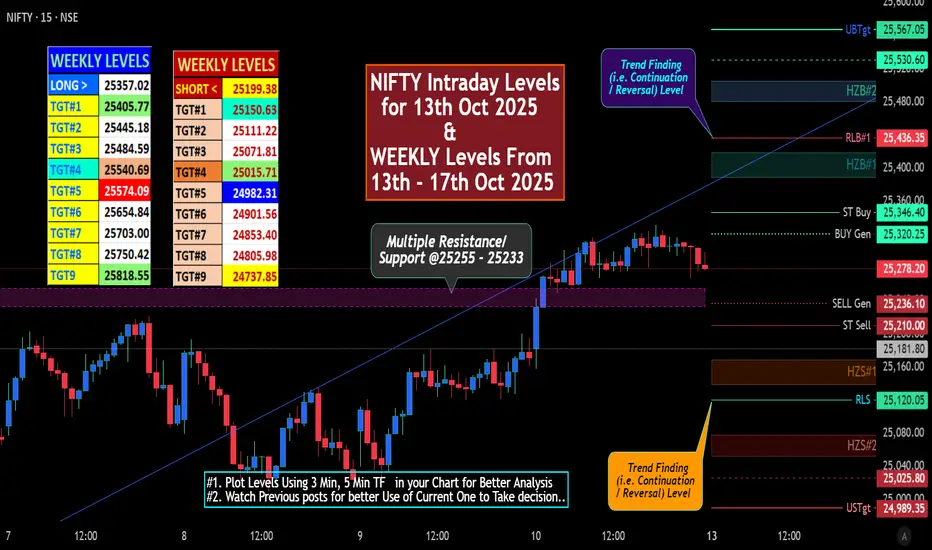
NIFTY Intraday Levels for 13th Oct 2025Last Trading Day (10.10.2025) GIFTNIFTY closes @ 25205 (Where at the time of Normal MKT Closing it wae @ 25402) Lost 198 Points . This Down Due to TRUMP New Tariff Announcement.
DOWJONES 9-1.90%), NASDAQ(-3.56%) also hammered severely.
Watch movement of GIFTNIFTY, DOWJONES future on Monday Morning before taking ant Possition.
# "WEEKLY Levels" mentioned in BOX format. Crucial for Monday Trade
^^^^^^^ Plot Levels Using 3 Min, 5 Min Time frame in your Chart for Better Analysis ^^^^^^^
L#1: If the candle crossed & stays above the “Buy Gen”, it is treated / considered as Bullish bias.
L#2: Possibility / Probability of REVERSAL near RLB#1 & UBTgt
L#3: If the candle stays above “Sell Gen” but below “Buy Gen”, it is treated / considered as Sidewise. Aggressive Traders can take Long position near “Sell Gen” either retesting or crossed from Below & vice-versa i.e. can take Short position near “Buy Gen” either retesting or crossed downward from Above.
L#4: If the candle crossed & stays below the “Sell Gen”, it is treated / considered a Bearish bias.
L#5: Possibility / Probability of REVERSAL near RLS#1 & USTgt
HZB (Buy side) & HZS (Sell side) => Hurdle Zone,
*** Specialty of “HZB#1, HZB#2 HZS#1 & HZS#2” is Sidewise (behaviour in Nature)
Rest Plotted and Mentioned on Chart
Color code Used:
Green =. Positive bias.
Red =. Negative bias.
RED in Between Green means Trend Finder / Momentum Change
/ CYCLE Change and Vice Versa.
Notice One thing: HOW LEVELS are Working.
Use any Momentum Indicator / Oscillator or as you "USED to" to Take entry.
⚠️ DISCLAIMER:
The information, views, and ideas shared here are purely for educational and informational purposes only. They are not intended as investment advice or a recommendation to buy, sell, or hold any financial instruments. I am not a SEBI-registered financial adviser.
Trading and investing in the stock market involves risk, and you should do your own research and analysis. You are solely responsible for any decisions made based on this research.
"As HARD EARNED MONEY IS YOUR's, So DECISION SHOULD HAVE TO BE YOUR's".
Do comment if Helpful .
In depth Analysis will be added later
Nifty 13th October 2025 Monday levelsNifty 13th October 2025 Monday levels
Follow my Yt channel click

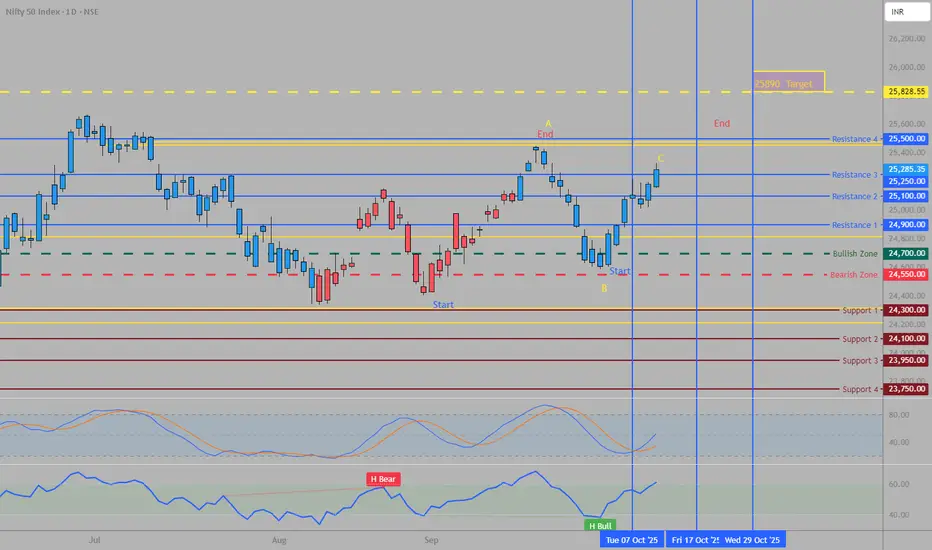
Nifty Second Week ReviewOn Friday, Nifty closed at 25,250, reaching its wave C target.
The RSI is currently above 60. As long as the RSI remains above 60, the projected targets are 25,500 as the first target and 25,900 as the second target.
If the RSI falls below 60, it indicates the completion of wave C, a corrective phase, and a potential movement downward toward 25,000.
Please note that October 17 is identified as a significant Time Cycle Date.
Results Season has began so churn your portfolio accordingly.
Nifty Short & Medium Term Support&Resistance_13-Oct to 17-Oct-25Nifty Short & Medium Term Support&Resistance_13-Oct to 17-Oct-25
Nifty 24894
As predicted last week, Nifty very well hold the 24500 Support and currently moved near to the first resistance 25000.
One more positive decisive break above Ist Short Term Resistance as given below in order market to move up.
Quarterly result started coming out slowly, TCS posted average result, Warree Renewables posted vgood results (PE is very high) .
Qtrly Results and Tariffs deal will decide the future path of the Nifty. Since it is a Volatile situation SIP route or buy in multiple parcel route with a goal of 3-5 years will workout.
Recent 100% additional tariff on China got severe effect on US market on Friday, it will affect global other trade markets too on Monday. Mainly due to the uncertainty prevailing over.
However, for India though initial drop market tend to move up to 25670 ( Jun 2025 all time high).
Repo and FD rate reduction by RBI, people may have to choose Debt/Commodity/Equity as alternate in order to beat the inflation.
Apart from that Low Cost ULIPs (2.5 L Limit per person) as one of the option to save the tax- ICICI & HDFC ULIPs are doing well, ULIPs are simplified and charges are lesser compared to MFs in terms of long term, Various fund option including passive funds are introduced.
Market was on decline/ Consolidation mode recently because of new Tariff's imposed by Trump mainly on Pharma and IT - H1 B Visa and Tax for Outsourcing IT and the recent pharma tarrifs imposition.
GST 2.0 is a reform which can aid in Auto/ FMCG / Home Appliances sales will get a boost due to the festival season.
Since market is volatile, use the dips (Opportunity) and buy through SIP or through multiple parcel in these uncertain times with a goal of 3-5 years.
Nifty Short Term Supports:
1. 24500 (Trend Line as shown)
2. 24000-24170 (Fibonacci Retracements Supports- Two Supports in this zone 24116 & 24171 as shown)
Medium Term Support:
3. 23500-23700 (Fibonacci Retracements Supports- Two Supports in this zone 23608 & 23707 as shown)
4. 23000
Resistance ( Multiple Resistances are there between 25000-25650):
1. 25000
2. 25200 ( 25154 Aug 2025 high)
3.25350 ( Fibonacci resistance shown )
4.25450 ( 25442 is the Aug 2025 high)
3. 25500 ( 25441 Sep 18th 2025 High )
Medium Term:
1.25670 ( Jun 2025 High) Should cross this resistance in short term decisively inorder to move up.
2.26269 ( Sep 2024 High)
Weekly Market Outlook | Nifty · BankNifty · S&P 500Nifty closed 25,285 (+390 pts) after making 25,330 / 24,881 — once again perfectly respecting my range of 25,300–24,500! 💪
As expected, BankNifty confirmed its W-pattern breakout, jumping 2% — strength clearly visible in the PSU bank pack.
Next week focus
• Above 25,450 → breakout toward 25,700+
• Below 25,130 → selling pressure till 25,000 / 24,850
Range for the week: 25,700–24,850
Shorters, stay patient — only if BankNifty cracks 55,700 does weakness confirm. Till then, it’s buy-on-dips for me.
Global cue: Trump’s proposed 100% China tariff shook US & crypto markets — watch its spillover effect on sentiment.
S&P 500 closed 6,552 (-160 pts). Holding above 6,360 = buy-on-dips;
Above 6,625 → uptrend resumes.
Below 6,360 → correction toward 6,225 / 6,142 / 6,100.
Exciting week ahead for both momentum traders & option sellers!

Nifty Pauses Below Resistance, Eyes Earnings-Driven MoveIndian markets closed on a strong note last week, with the Nifty rising over 1.5% to 25,285. The rally was led by IT sector (up nearly 5%) and PSU banks (up around 1.5%), reflecting sectoral strength during the earnings season.
The India VIX inched up 0.42% to 10.10, still near multi-month lows, though volatility may rise as corporate results roll in.
Technically, the Nifty is now testing a crucial resistance zone at 25,400–25,500, aligning with the apex of a large symmetrical triangle pattern. Open interest data shows heavy call writing at this zone, while strong put writing around 25,100–25,200 indicates immediate support. A decisive breakout on either side may set the tone for the next directional move.
Looking ahead, some consolidation or range-bound movement is likely as the market digests earnings and global developments. US–China trade tensions and semiconductor supply chain concerns may weigh on sentiment if risks intensify.
Given the current setup, traders are advised to adopt a cautious, stock-specific approach. While the broader bias remains positive, protecting profits and avoiding aggressive long positions until a clear breakout is confirmed would be prudent.

Nifty October 2nd Week ViewNifty is looking steady and solid. But the upcoming week can be turbulent, especially in the first half of the week. The imp range to watch on the downside would be 25132-24800. And at max, we can expect a retracement up to 24700 in Nifty. On the upside, we can expect momentum to continue once Nifty crosses and sustains above the 25350-400 range.
All levels are marked in the chart posted.
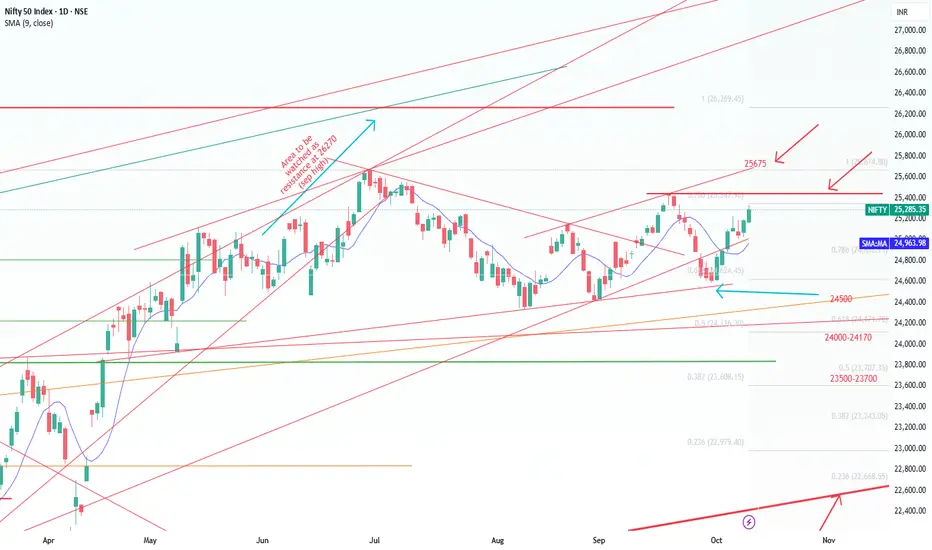
Uncertainty can prevail with latest Trump Tariff Tantrum.The chart indicates a Trend line resistance near 25323 which Nifty was set to overhaul but latest Trump Tariff Tantrum has potential to derail the progress again. This time the announcement is 100% tariff on China. Global markets, Crypto and Gift Nifty is showing weakness due to the announcement which will be effective from 1st November.
Resistance for Nifty are at 25323 (Trend line resistance), 25438, 25565 and finally channel top at 25702. Supports for Nifty are at 25215, 25087 (Mother line support), 24987 (Father line support), 24922 and 24750 is the channel bottom support. Shadow of the candle was positive to neutral but this tariff announcement has turned it negative as of now. Let us see how the cookie crumbles next week.
To know mover about Mother line, Father line, Mid channel support / resistance, Chanel top resistnace and channle bottom support, trend line support and resistance (To understand the role of Mother line and Father line) or to be able to draw resistances and supports based on historic peaks and valleys you can read my book THE HAPPY CANDLES WAY TO WEALTH CREATION. The book is available in Amazon in paperback or Kindle version and is rated 4.8/5. This book teaches you Techno-Funda investing. (Techno Funda investing means Knowing which are Fundamentally strong companies and investing / booking profits / staying invested in them based on Technical analysis). The book has some more unique features like rating a stock with the help of Happy Candles Number wherein you can give a stock marks out of 100 based on Techincal and Fundamental analysis you have learned by reading it. Thus you can know if the stock is currently investible or not based on the marks it scores out of 100. The book also covers various aspect of behavioural finance. Lot of people who have read the book consider it as a hand book to equity investing. Buy the book you will not be dissapointed as the book is reasonably priced. Search by the key words The Happy Candles Way to wealth creation and you will get it.
Disclaimer: The above information is provided for educational purpose, analysis and paper trading only. Please don't treat this as a buy or sell recommendation for the stock or index. The Techno-Funda analysis is based on data that is more than 3 months old. Supports and Resistances are determined by historic past peaks and Valley in the chart. Many other indicators and patterns like EMA, RSI, MACD, Volumes, Fibonacci, parallel channel etc. use historic data which is 3 months or older cyclical points. There is no guarantee they will work in future as markets are highly volatile and swings in prices are also due to macro and micro factors based on actions taken by the company as well as region and global events. Equity investment is subject to risks. I or my clients or family members might have positions in the stocks that we mention in our educational posts. We will not be responsible for any Profit or loss that may occur due to any financial decision taken based on any data provided in this message. Do consult your investment advisor before taking any financial decisions. Stop losses should be an important part of any investment in equity.

Currency Wars and Forex TradingThe Battle Behind Global Exchange Rates.
1. Understanding Currency Wars
A currency war, often called a “competitive devaluation,” occurs when countries intentionally lower the value of their currencies to boost exports, reduce imports, and stimulate domestic economic growth. The logic is simple:
A cheaper currency makes a nation’s goods more affordable abroad.
Exports rise, and trade balance improves.
However, it comes at a cost — other nations retaliate, leading to global instability.
The term “currency war” gained popularity during the 2008 global financial crisis, when major economies used monetary easing policies to flood markets with liquidity, weakening their currencies in the process. But the roots of currency manipulation stretch back centuries — from the 1930s Great Depression to modern-day U.S.-China tensions.
A currency war can start subtly — through interest rate cuts, quantitative easing (QE), or direct market intervention — but its ripple effects can disrupt entire markets, especially the forex market, where even a 0.5% change can move billions of dollars.
2. The Mechanics of a Currency War
To understand how a currency war unfolds, it’s essential to look at the tools nations use to influence their exchange rates.
a. Monetary Policy Manipulation
Central banks are the first line of action. By cutting interest rates, a country makes its currency less attractive to investors, thereby reducing its value. Conversely, raising rates strengthens the currency.
Example: When the U.S. Federal Reserve cuts rates, the dollar weakens, boosting American exports.
b. Quantitative Easing (QE)
QE involves printing money or purchasing financial assets to inject liquidity into the economy. This floods the market with domestic currency, increasing supply and pushing its value down.
Example: Japan and the European Central Bank have extensively used QE to combat deflation and stimulate exports.
c. Foreign Exchange Intervention
Sometimes, central banks directly buy or sell currencies in the forex market to influence rates.
Example: The Swiss National Bank (SNB) famously intervened to keep the Swiss franc from becoming too strong during the Eurozone crisis.
d. Capital Controls
In extreme cases, countries may restrict capital flows to prevent unwanted appreciation or depreciation of their currency.
Each of these tools affects not just domestic economics but also global forex trading dynamics, as investors respond to shifts in interest rates, liquidity, and political intentions.
3. Historical Examples of Currency Wars
Currency wars are not new. They have shaped global trade and politics for nearly a century.
a. The 1930s “Beggar-Thy-Neighbor” Era
During the Great Depression, countries like the U.K. and U.S. abandoned the gold standard and devalued their currencies to make exports cheaper. This triggered retaliatory actions from others, worsening global economic tensions.
b. The Plaza Accord (1985)
In the 1980s, the U.S. faced massive trade deficits with Japan and Germany. To correct this, the Plaza Accord was signed, where nations agreed to devalue the U.S. dollar. It worked temporarily, but the unintended consequence was Japan’s asset bubble in the 1990s.
c. The Modern Currency War (Post-2008)
After the 2008 global financial crisis, central banks adopted zero interest rates and quantitative easing. The U.S. dollar, euro, and yen became heavily manipulated currencies as nations sought export competitiveness.
China, on the other hand, was accused by the U.S. of artificially weakening the yuan to keep exports cheap — an accusation that led to the so-called U.S.-China currency war.
4. The Role of Forex Traders in a Currency War
Currency wars create both risks and opportunities for forex traders. When nations intervene in their exchange rates, it generates high volatility, making the forex market extremely reactive.
a. Increased Volatility
Central bank announcements or policy changes can lead to sudden 2–3% moves in major currency pairs. Traders who can anticipate or react quickly can profit — but the risk of being caught on the wrong side is immense.
b. Predictable Trends
Currency wars often create long-term directional trends. For example, during QE periods, the USD/JPY or EUR/USD pairs followed consistent paths that skilled traders could exploit.
c. Fundamental Trading Becomes Key
In a currency war, understanding macroeconomic indicators — like interest rates, inflation, and trade data — becomes essential. Technical charts alone are not enough; traders must interpret central bank statements, policy outlooks, and global trade flows.
d. Safe-Haven Currencies
When tensions rise, traders flock to “safe-haven” currencies like the Swiss franc (CHF), Japanese yen (JPY), or U.S. dollar (USD). These currencies tend to strengthen during crises, creating defensive strategies for traders.
5. Major Players in Currency Manipulation
The world’s major economies often play leading roles in currency adjustments, either overtly or covertly.
a. The United States (USD)
The dollar is the world’s reserve currency, making it central to all currency wars. The Federal Reserve’s monetary policy has global consequences — a weaker dollar benefits emerging markets, while a stronger dollar tightens global liquidity.
b. China (CNY)
China has historically pegged the yuan to the dollar to control its export competitiveness. The People’s Bank of China (PBoC) carefully manages its exchange rate, often leading to accusations of manipulation from the U.S.
c. Japan (JPY)
Japan’s decades-long battle with deflation led to repeated rounds of currency weakening through Abenomics, a policy mix of fiscal stimulus and monetary easing.
d. The European Union (EUR)
The European Central Bank (ECB) engages in QE and negative interest rates to stimulate growth in the Eurozone, often weakening the euro.
e. Emerging Markets
Countries like India, Brazil, and Russia intervene occasionally to stabilize their currencies against volatile capital flows or inflationary pressures.
6. How Currency Wars Impact the Global Economy
Currency wars can initially appear beneficial for export-heavy economies, but prolonged conflicts have widespread negative effects:
a. Trade Imbalances
While devaluation boosts exports temporarily, it also increases import costs, leading to inflationary pressures and higher prices for consumers.
b. Inflation and Purchasing Power
A weaker currency means imported goods become expensive. This reduces purchasing power and can erode domestic savings.
c. Market Instability
Competitive devaluations can lead to capital flight, stock market crashes, and loss of investor confidence in emerging economies.
d. Geopolitical Tensions
Currency manipulation often leads to diplomatic strains. The U.S. frequently labels countries as “currency manipulators,” triggering trade disputes and tariffs.
e. Race to the Bottom
When every country tries to devalue its currency simultaneously, it results in a zero-sum game — no one truly wins. Instead, the global financial system becomes more unstable.
7. Forex Trading Strategies During Currency Wars
Smart traders understand that currency wars are not random; they follow predictable policy patterns. Here are some effective strategies to trade during such times:
a. Follow Central Bank Policies
Monitor statements from major central banks like the Federal Reserve, ECB, BoJ, and PBoC. Currency trends often align with their monetary direction.
b. Use Carry Trades Cautiously
In normal times, traders borrow low-interest-rate currencies to invest in high-interest ones. During currency wars, however, central banks often cut rates, making carry trades riskier.
c. Focus on Safe-Haven Assets
When uncertainty rises, traders shift funds to safe-haven currencies and assets like gold or the U.S. Treasury bonds. Pairing risk currencies (like AUD or NZD) against safe havens (like JPY or CHF) can yield profits.
d. Use Fundamental + Technical Analysis
Combine macroeconomic understanding (inflation, GDP, interest rates) with technical signals (support, resistance, trendlines) to identify high-probability trades.
e. Manage Risk Aggressively
Currency wars bring unpredictable volatility. Setting tight stop-loss levels, using smaller position sizes, and avoiding overleveraging are crucial.
8. The Digital Age: Currency Wars in the Era of Cryptocurrencies
The emergence of digital currencies and blockchain technology has introduced a new dimension to currency competition. Nations are now exploring Central Bank Digital Currencies (CBDCs) to maintain control over monetary policy and reduce reliance on foreign currencies.
Cryptocurrencies like Bitcoin are often seen as a hedge against fiat currency manipulation. During aggressive devaluations or hyperinflation, digital assets gain appeal as “non-sovereign stores of value.”
For forex traders, the rise of crypto–forex hybrids — trading Bitcoin against fiat pairs (BTC/USD, BTC/JPY) — offers new diversification opportunities. However, it also adds volatility and complexity to traditional currency markets.
9. The Future of Currency Wars
As global economies recover from recent crises and navigate geopolitical tensions, currency wars are expected to evolve — not disappear.
Artificial Intelligence & Algorithms: Central banks and trading firms are increasingly using AI to predict and manage currency flows.
Energy & Commodity Influence: Nations rich in energy reserves (like Russia or Saudi Arabia) may use oil and commodity pricing to influence currency demand.
De-Dollarization: Many nations, especially BRICS members, are pushing for trade settlement in non-dollar currencies to reduce dependence on the U.S. dollar.
Global Coordination: Institutions like the IMF and G20 continue to push for coordination to prevent destructive currency competition.
The next phase of currency wars may not be about devaluation alone but about digital dominance, monetary sovereignty, and data control.
10. Conclusion: Trading in the Midst of Monetary Battles
Currency wars remind us that the forex market is not just about charts, pips, and leverage — it’s about political strategy, economic survival, and global power. For traders, understanding the deeper forces behind exchange rate movements is crucial.
A skilled forex trader doesn’t just react to price — they interpret the motive behind central bank actions, fiscal policies, and trade tensions. The winners in this environment are those who can combine macro insight with disciplined strategy.
In the end, currency wars may be fought by nations, but their outcomes are traded by individuals. Every pip of movement reflects a global tug-of-war between economic giants — and for those who understand the game, it’s both a battlefield and a goldmine.
Nifty View 13.10.25 Ke Liye The Nifty 50 is one of India’s most important stock market indices, representing the performance of 50 of the largest and most actively traded companies listed on the National Stock Exchange (NSE). It covers major sectors of the economy such as banking, information technology, energy, pharmaceuticals, and consumer goods, making it a strong indicator of overall market sentiment and economic health. Investors and traders use the Nifty 50 to track market trends, create investment strategies, and compare the performance of their portfolios. Because it reflects the collective movement of blue-chip companies, movements in the Nifty 50 often influence decisions by domestic and foreign investors alike.

Nifty levels - Oct 13, 2025Nifty support and resistance levels are valuable tools for making informed trading decisions, specifically when combined with the analysis of 5-minute timeframe candlesticks and VWAP. By closely monitoring these levels and observing the price movements within this timeframe, traders can enhance the accuracy of their entry and exit points. It is important to bear in mind that support and resistance levels are not fixed, and they can change over time as market conditions evolve.
The dashed lines on the chart indicate the reaction levels, serving as additional points of significance to consider. Furthermore, take note of the response at the levels of the High, Low, and Close values from the day prior.
We hope you find this information beneficial in your trading endeavors.
* If you found the idea appealing, kindly tap the Boost icon located below the chart. We encourage you to share your thoughts and comments regarding it.
Wishing you success in your trading activities!

NakshiraLife Pressure Dates — Astro Timing That Works on Nifty!As I’ve been sharing, NakshiraLife Astro Pressure Dates have shown remarkable accuracy in capturing key turns in the Nifty.
These dates often align with strong market momentum zones.
The best way to trade them is simple —
📌 Mark the High and Low of the Nakshiralife Pressure Date.
📌 From the next trading day, take an entry in the direction of whichever side breaks first.
🎯 The target: around 100 points in Nifty.
Today, 9th October 2025, is a NakshiraLife Pressure Date — so we’ll mark today’s range and trade the breakout tomorrow.
For proof, I’ve also shown the previous Pressure Date — 3rd October 2025, which worked beautifully, confirming that Astro-based timing really does reflect in market behavior.
