Nifty will reach 25600, before giving a retracement till 24900Momentum will make nifty complete its Wave
so target from here will be 25600
we might get 1 dip till25050 levels,
but there position needs to be added as 25600 has to be
achieved before any big retracement level happens
but as risk reward is not favourable here
so we will wait for nifty to reach 25600 and then for retracement we
will find any pattern to go for downside retracement till 24900 to 2500
levels before
it continues it uprally
Trade ideas

#Nifty 10th October Friday - #CatchAndRead Nifty50 10th October Friday - zigzag untadaa - #CatchAndRead
Follow my Yt channel link in dp

Nifty on the verge of a Trendline breakout. Nifty did a great job today by closing above a very important resistance of 25128. Now the major hurdle seems to be near the trendline which is near 25228. Once this range is crossed the next hurdles will be at 25306, 25431 and channel top near 25579. The supports for Nifty are at 25128. Mother line support near 25021 which is also a mid channel support. (Making this area a very strong support). Followed by 24965 (Father line support). If by chance father line support is broken we can see Nifty falling towards 24806 or even 24601 which is the channel bottom support. As of now the shadow of the candle seems to be positive (Green).
To know mover about Mother line, Father line, Mid channel support / resistance, Chanel top resistnace and channle bottom support, trend line support and resistance (To understand the role of Mother line and Father line) or to be able to draw resistances and supports based on historic peaks and valleys you can read my book THE HAPPY CANDLES WAY TO WEALTH CREATION. The book is available in Amazon in paperback or Kindle version and is rated 4.8/5. This book teaches you Techno-Funda investing. (Techno Funda investing means Knowing which are Fundamentally strong companies and investing / booking profits / staying invested in them based on Technical analysis). The book has some more unique features like rating a stock with the help of Happy Candles Number wherein you can give a stock marks out of 100 based on Techincal and Fundamental analysis you have learned by reading it. Thus you can know if the stock is currently investible or not based on the marks it scores out of 100. The book also covers various aspect of behavioural finance. Lot of people who have read the book consider it as a hand book to equity investing. Buy the book you will not be dissapointed as the book is reasonably priced. Search by the key words The Happy Candles Way to wealth creation and you will get it.
Disclaimer: The above information is provided for educational purpose, analysis and paper trading only. Please don't treat this as a buy or sell recommendation for the stock or index. The Techno-Funda analysis is based on data that is more than 3 months old. Supports and Resistances are determined by historic past peaks and Valley in the chart. Many other indicators and patterns like EMA, RSI, MACD, Volumes, Fibonacci, parallel channel etc. use historic data which is 3 months or older cyclical points. There is no guarantee they will work in future as markets are highly volatile and swings in prices are also due to macro and micro factors based on actions taken by the company as well as region and global events. Equity investment is subject to risks. I or my clients or family members might have positions in the stocks that we mention in our educational posts. We will not be responsible for any Profit or loss that may occur due to any financial decision taken based on any data provided in this message. Do consult your investment advisor before taking any financial decisions. Stop losses should be an important part of any investment in equity.

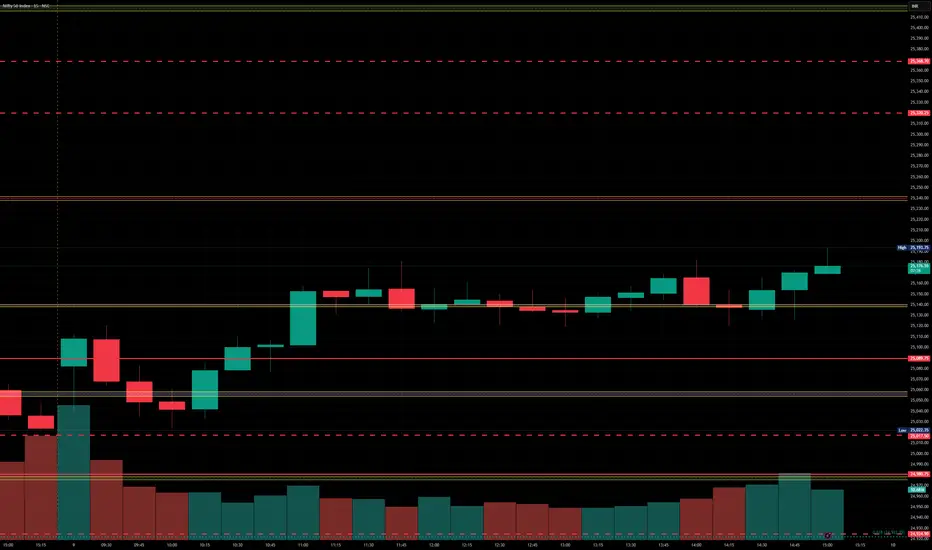
Nifty levels - Oct 10, 2025Nifty support and resistance levels are valuable tools for making informed trading decisions, specifically when combined with the analysis of 5-minute timeframe candlesticks and VWAP. By closely monitoring these levels and observing the price movements within this timeframe, traders can enhance the accuracy of their entry and exit points. It is important to bear in mind that support and resistance levels are not fixed, and they can change over time as market conditions evolve.
The dashed lines on the chart indicate the reaction levels, serving as additional points of significance to consider. Furthermore, take note of the response at the levels of the High, Low, and Close values from the day prior.
We hope you find this information beneficial in your trading endeavors.
* If you found the idea appealing, kindly tap the Boost icon located below the chart. We encourage you to share your thoughts and comments regarding it.
Wishing you success in your trading activities!

Nifty LongLogic
25k has DZ on 60/75 Min TF, along with this W4 of EW, also respected all the conditions.
Now on HTF, we have created HH/HL/HC also. In W5, we should test 25300/500 levels with
RSI divergence. I will exit trade either on above mentioned levels or if the Index has an hourly
close below the previous candle low.

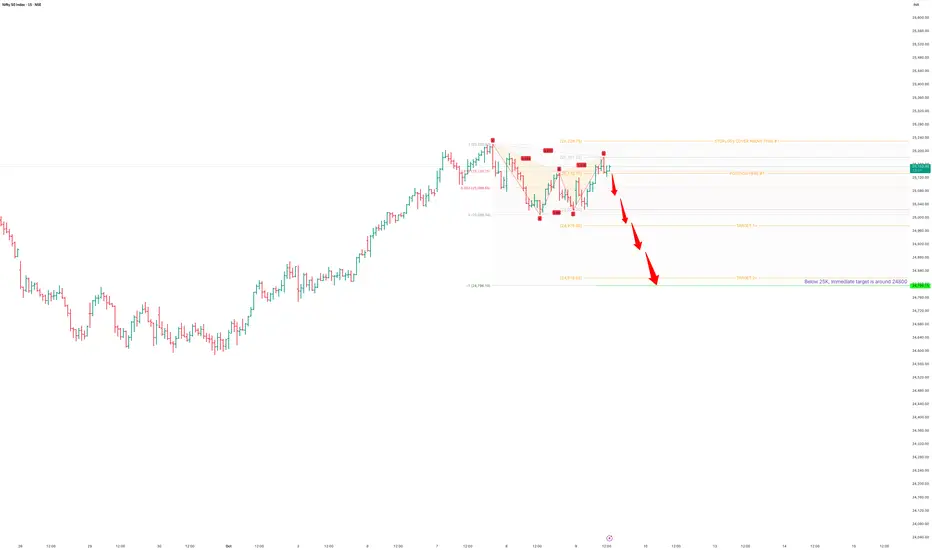
NIFTY - Short term Analysis. 🔍 Technical Structure
The chart forms a bearish ABCD harmonic pattern, with the “D” completion zone aligning near 25,200–25,250, which also coincides with the 61.8% Fibonacci retracement of the prior downswing. This zone acted as a supply area — rejection here confirms sellers’ re-entry.
📉 Key Levels
Type Level Description
Entry / Position Zone 25,150–25,200 Short entry region (as marked)
Stop-Loss Zone Above 25,250 Invalidates the pattern if broken
Target 1 24,875 Corresponds to the 100% Fib projection of the BC leg
Target 2 24,470–24,480 Aligns with the 127.2% Fibonacci extension – high-probability completion zone.
🧭 Conclusion
Below 25,000, the index is likely to trigger accelerated profit-booking toward 24,800, and if momentum persists, an extension to 24,470 is statistically justified. Any close above 25,250 invalidates the bearish setup and calls for reassessment.
Disclaimer:
This analysis is purely for educational and informational purposes based on technical chart interpretation and publicly available market data. It does not constitute financial or investment advice. Trading in equities, derivatives, or indices involves significant risk, and past performance or statistical probability does not guarantee future results. Please consult your financial advisor before making any trading or investment decisions.
Nifty to fall till 24600A bearish move in nifty will come.
so keep sl of 50 points and target for 24600 from here

#NIFTY 50 — History repeating itself? #NIFTY 50 — History repeating itself?
Both 2022 and 2025 exhibit identical cup-and-handle accumulation zones preceding a massive rally.
Current Zone: “Buying phase before breakout”
Possible Target: 32,000–34,000+ in 18–24 months
We are fully invested.
Either you take action now, or watch history repeat itself.
I already hold the right stocks for this rally.
What about you?

Nifty - Shd hit 27000 in short termNIFTY - is bullish setup and gave entry around 24600 with SL 24400. we are expecting 27000 in short term.

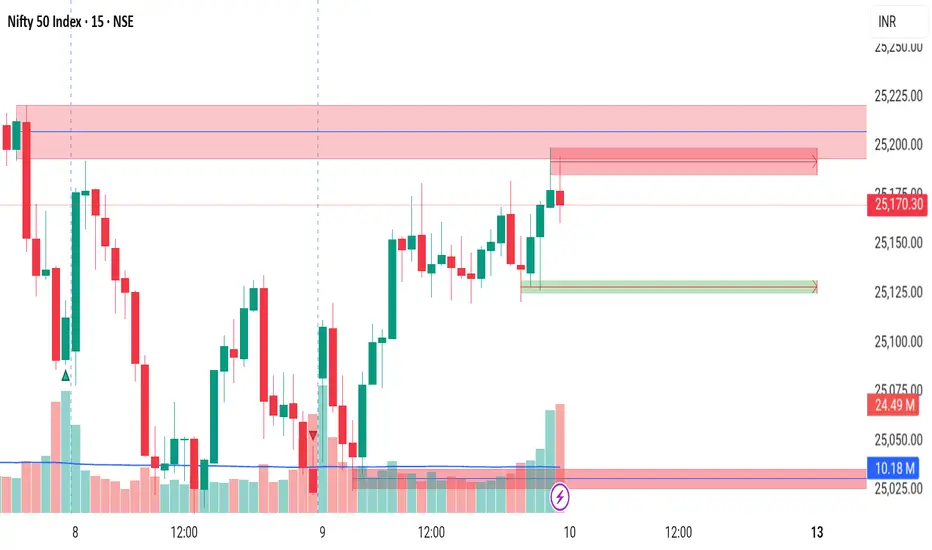
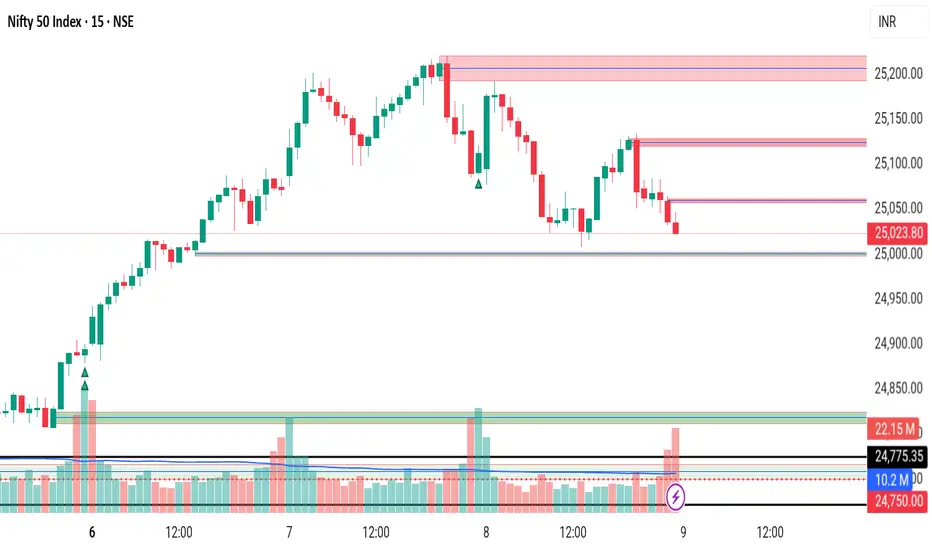
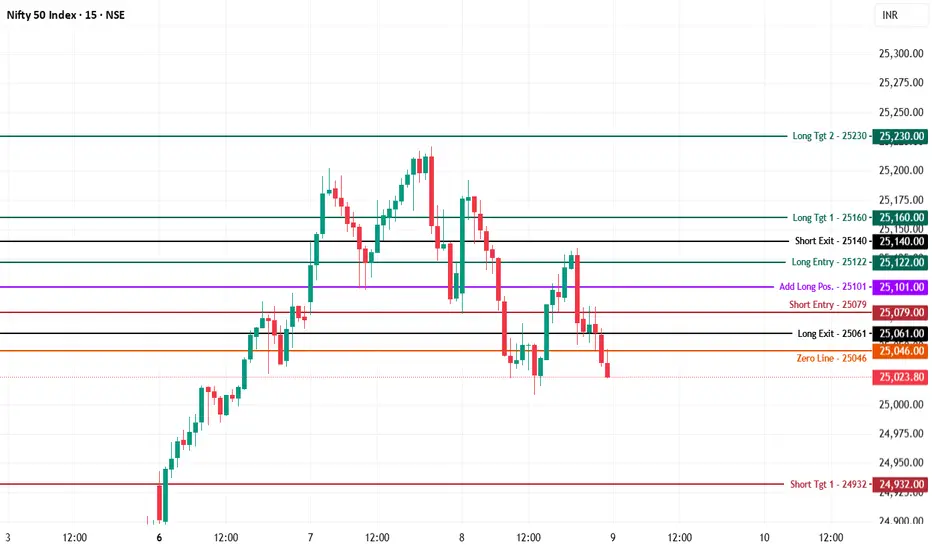
Nifty 50 Index – Intraday Analysis (9-Oct-25)NSE:NIFTY
Nifty is trading at 25,023.80, right at the zero line (25,046) after several failed attempts to hold higher and a clear shift to lower lows.
Bearish Scenario
Short Entry (25,079): Shorts become actionable below 25,079, especially if the morning bounce fails and price remains below 25,061.
Downside Targets:
24,932 (Target 1): First mapped support for short covering.
24,862 (Target 2): Extension if momentum intensifies.
Stop Loss: Keep shorts only if price stays below 25,061; exit if Nifty climbs above 25,101.
Bullish Scenario
Long Entry (25,122): Fresh longs activate only above 25,122, with conviction once price sustainably breaks 25,140.
Upside Targets:
25,160 (Target 1): First resistance and profit booking area.
25,230 (Target 2): High extension target if momentum picks up.
Stop Loss: Use 25,101 or 25,079 for active risk control.
Neutral/Range Logic
Zero Line (25,046):
Active sessions may turn choppy while price oscillates at the zero line.
Wait for clear breakouts/breakdowns to set trending bias. All levels are structured for candle close confirmation on 5/15 min time frames.
If these levels help your trading, please boost, comment, and share. Follow for more daily key levels and market logic!
Reach out — no hassle, just learning and sharing. Your engagement is what keeps this effort thriving for all active viewers.

Nifty 26 Oct 2025Nifty may follow this Channel for a while and any further breakout or breakdown to be determined in relation to this channel. Also the critical levels also marked.

#NIFTY Next move??? NSE:NIFTY currently at slaughter house, dont enter! wait for clear move before you enter

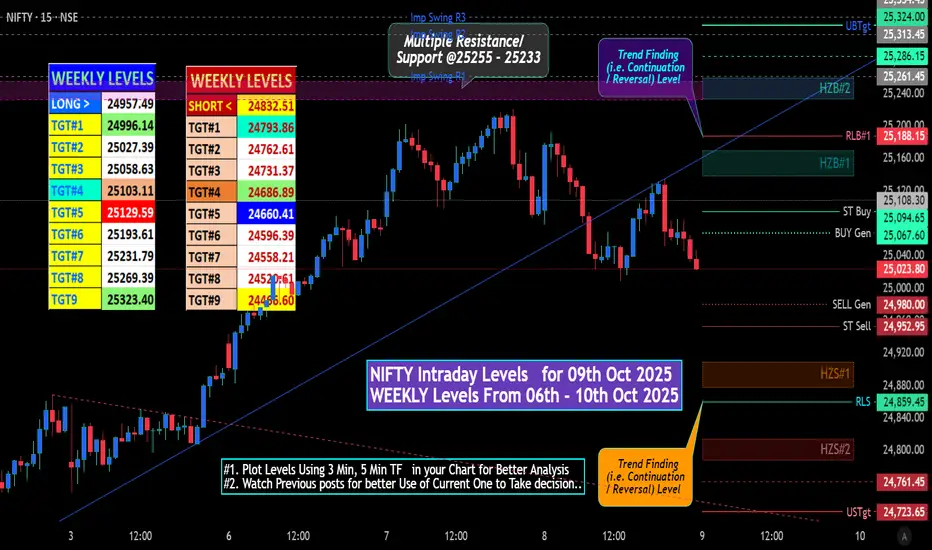
NIFTY Intraday Levels for 09th Oct 2025NIFTY Intraday Levels for 09th Oct 2025
# "WEEKLY Levels" mentioned in BOX format.
^^^^^^^ Plot Levels Using 3 Min, 5 Min Time frame in your Chart for Better Analysis ^^^^^^^
L#1: If the candle crossed & stays above the “Buy Gen”, it is treated / considered as Bullish bias.
L#2: Possibility / Probability of REVERSAL near RLB#1 & UBTgt
L#3: If the candle stays above “Sell Gen” but below “Buy Gen”, it is treated / considered as Sidewise. Aggressive Traders can take Long position near “Sell Gen” either retesting or crossed from Below & vice-versa i.e. can take Short position near “Buy Gen” either retesting or crossed downward from Above.
L#4: If the candle crossed & stays below the “Sell Gen”, it is treated / considered a Bearish bias.
L#5: Possibility / Probability of REVERSAL near RLS#1 & USTgt
HZB (Buy side) & HZS (Sell side) => Hurdle Zone,
*** Specialty of “HZB#1, HZB#2 HZS#1 & HZS#2” is Sidewise (behaviour in Nature)
Rest Plotted and Mentioned on Chart
Color code Used:
Green =. Positive bias.
Red =. Negative bias.
RED in Between Green means Trend Finder / Momentum Change
/ CYCLE Change and Vice Versa.
Notice One thing: HOW LEVELS are Working.
Use any Momentum Indicator / Oscillator or as you "USED to" to Take entry.
⚠️ DISCLAIMER:
The information, views, and ideas shared here are purely for educational and informational purposes only. They are not intended as investment advice or a recommendation to buy, sell, or hold any financial instruments. I am not a SEBI-registered financial adviser.
Trading and investing in the stock market involves risk, and you should do your own research and analysis. You are solely responsible for any decisions made based on this research.
"As HARD EARNED MONEY IS YOUR's, So DECISION SHOULD HAVE TO BE YOUR's".
Do comment if Helpful .
In depth Analysis will be added later
Nifty levels - Oct 09, 2025Nifty support and resistance levels are valuable tools for making informed trading decisions, specifically when combined with the analysis of 5-minute timeframe candlesticks and VWAP. By closely monitoring these levels and observing the price movements within this timeframe, traders can enhance the accuracy of their entry and exit points. It is important to bear in mind that support and resistance levels are not fixed, and they can change over time as market conditions evolve.
The dashed lines on the chart indicate the reaction levels, serving as additional points of significance to consider. Furthermore, take note of the response at the levels of the High, Low, and Close values from the day prior.
We hope you find this information beneficial in your trading endeavors.
* If you found the idea appealing, kindly tap the Boost icon located below the chart. We encourage you to share your thoughts and comments regarding it.
Wishing you success in your trading activities!

Nifty 50Nifty 50 Chart Analysis 08/10/2025...........
Nifty is trading in a parallel channel. Here I have marked some support and resistance levels through three drive pattern and Elliott wave pattern which you can see marked on this chart. I hope you will find it easy to trade from these levels.
Enjoy !

Nifty 50 at a Turning Point? Key Levels & Market Outlook AheadThe Nifty 50 ended the week at 24,894.25, gaining +0.97%.
🔹 Key Levels for the Upcoming Week
📌 Price Action Pivot Zone:
24,816 to 24,973 – This blue-shaded zone will act as a crucial decision-making area. A breakout on either side could define the next directional move.
🔻 Support Levels:
Support 1 (S1): 24,580
Support 2 (S2): 24,267
Support 3 (S3): 24,005
🔺 Resistance Levels:
Resistance 1 (R1): 25,212
Resistance 2 (R2): 25,529
Resistance 3 (R3): 25,795
Market Outlook
✅ Bullish Scenario:
If Nifty sustains above the pivot zone high of 24,973, it could extend its upward momentum toward R1 (25,212), followed by R2 (25,529) and R3 (25,795).
❌ Bearish Scenario:
A breakdown below the pivot low of 24,816 could trigger selling pressure. On the downside, the index may test S1 (24,580), and further weakness could drag it toward S2 (24,267) and S3 (24,005).
Disclaimer: tinyurl.com

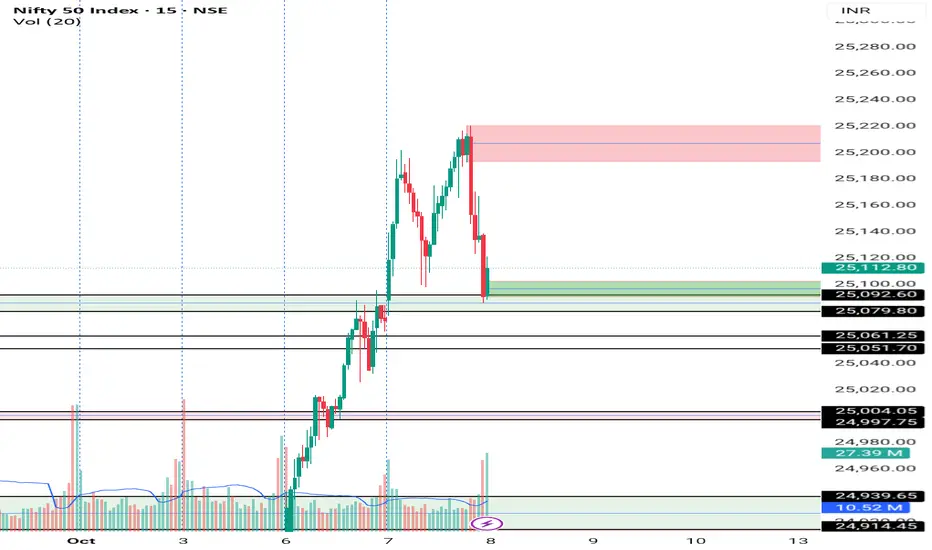
Nifty 50 Index – Chart Pattern Analysis - 8th Oct., 2025NSE:NIFTY
Nifty 50 Index – 5min Chart Pattern Analysis
A "Head and Shoulders" pattern has just triggered a breakdown on the Nifty 50 intraday chart, signaling a bearish reversal from recent highs.
Pattern Structure & Trade Logic
Pattern Breakdown:
Price has broken through the neckline (support level) near 25,115 after forming two shoulders and a prominent head at the top.
Breakdown is confirmed by a strong bearish candle and increased volume.
Targets:
The measured move (distance from head to neckline) gives a projected downside to around 25,014, suggesting a short trade setup.
The distance marked in blue identifies this 0.41% drop as the initial target zone.
Trade Plan
Entry:
Short initiated on the break below 25,115 after the pattern confirms.
Stop Loss:
The stop is placed above the right shoulder at 25,150–25,164. This prevents losses if the breakdown fails and price retraces.
Target:
Main target at 25,014, roughly matching the pattern’s measured move and prior demand.
Pattern Psychology
Bearish Implication:
The head and shoulders signals exhaustion of buyers and initiation of a corrective phase; volume confirmation adds trade conviction.
Risk Management:
The setup allows for tight risk control relative to reward (target zone).

Today Nifty critical levels: 08 October 2025can breakdown by forming an N below the levels marked or can showing downward move till a point in the noon and sudden upmove nullifying the majority

Today supply and demand levels 8th October Today supply and demand levels 8th October
Follow now my channel