UK100CFD trade ideas

FTSE uptrend resistance at 9285The FTSE remains in a bullish trend, with recent price action showing signs of a corrective pullback within the broader uptrend.
Support Zone: 9195 – a key level from previous consolidation. Price is currently testing or approaching this level.
A bullish rebound from 9195 would confirm ongoing upside momentum, with potential targets at:
9285 – initial resistance
9346 – psychological and structural level
9438 – extended resistance on the longer-term chart
Bearish Scenario:
A confirmed break and daily close below 9195 would weaken the bullish outlook and suggest deeper downside risk toward:
9133 – minor support
9100 – stronger support and potential demand zone
Outlook:
Bullish bias remains intact while the FTSE holds above 9195. A sustained break below this level could shift momentum to the downside in the short term.
This communication is for informational purposes only and should not be viewed as any form of recommendation as to a particular course of action or as investment advice. It is not intended as an offer or solicitation for the purchase or sale of any financial instrument or as an official confirmation of any transaction. Opinions, estimates and assumptions expressed herein are made as of the date of this communication and are subject to change without notice. This communication has been prepared based upon information, including market prices, data and other information, believed to be reliable; however, Trade Nation does not warrant its completeness or accuracy. All market prices and market data contained in or attached to this communication are indicative and subject to change without notice.

Will The FTSE100 Breakout Trigger This Bullish Plan?🎯 Title: UK100/FTSE100 Money Heist Plan: Bullish Breakout Play (Swing Trade) 💰⚡
Asset: #UK100 #FTSE100 ( TVC:UKOIL , FX:GBPUSD , OANDA:EURGBP )
🗺️ The Heist Plan Overview
Ladies & Gentlemen, Thief OG's! 👋🕵️♂️ Welcome to the vault. Our plan is a calculated BULLISH swing trade on the UK100, triggered by a key breakout. We're not kicking the door down; we're waiting for the alarm to be disabled first.
Trade Bias: Bullish (Pending Order Plan) 📈
Strategy: "The Thief" Layering Entry (Minimizes risk, maximizes opportunity)
Key Level: 9,250.00 – The Vault Door 🚪
⚡ Execution Details (The How)
ENTRY CONFIRMATION: We only move after a CONFIRMED BREAKOUT above 9,250.00. ⚡
SET AN ALARM! {{ticker}} > 9250 - Don't miss the signal!
ENTRY METHOD ("The Thief" Layer Strategy): 🎯
Instead of one risky entry, we use multiple BUY LIMIT orders placed below the breakout level to catch any retest. This is a sophisticated, risk-aware method.
Layer 1: 9,200.00
Layer 2: 9,225.00
Layer 3: 9,250.00 (Breakout Level Retest)
You can add more layers (e.g., 9,275) based on your capital & risk appetite.
STOP LOSS (The Escape Route): 🚨
My SL: 9,150.00 (Place after your entry is filled).
⚠️ IMPORTANT NOTE: This is MY plan. You, the Thief OG, MUST adjust your stop loss based on your own risk management strategy. Protect your capital.
TAKE PROFIT (The Escape with the Money): 💎
TP Target: 9,400.00
Why Here? This aligns with a major historical resistance zone, potential overbought conditions, and a classic bull trap area. Escape with your stolen profits before the market reverses!
⚠️ IMPORTANT NOTE: You can choose to take partial profits earlier or trail your stop. "Make money then take money at your own risk."
🕵️♂️ Why This Heist? (The Analysis)
This isn't a random guess. It's a plan backed by data.
📊 Real-Time Snapshot (#UK100CFD)
Daily Change: -0.09% 📉 (A slight dip for a better entry?)
1-Month Performance: +0.48% 📈
1-Year Performance: +12.55% 🚀 (Strong underlying trend)
😊 Market Sentiment & Fear/Greed
Retail Sentiment: 55% Bullish 🐂 | 45% Bearish 🐻
Institutional Sentiment: 60% Bullish 🐂 | 40% Bearish 🐻
Overall Mood: Moderately Bullish 😊
Fear & Greed Index: 53/100 (Neutral) ⚖️
This suggests the market is not overly euphoric or fearful, providing a stable backdrop for our breakout play.
📈 Fundamental & Macro Backdrop:
Fundamental Score: 65/100 ✅
Strong earnings in defensive sectors (Healthcare, Energy). 💪
Attractive valuations vs. US indices (P/E 20% below S&P 500). 💰
Stable UK interest rate environment. 📊
Macro Score: 55/100 ⚖️ (Caution Advised)
Risks: UK GDP contraction (-0.3%) and global trade tensions. 📉🌎
Support: Bank of England rate cuts providing a floor. 🏦
Overall Outlook: 60/100 (Mildly Bullish) 🐂
The resilience of the FTSE100, combined with solid fundamentals and neutral sentiment, creates a favorable setup for a breakout to the upside.
✅ Related Pairs to Watch
TVC:UKOIL (BP/Shell correlation)
FX:GBPUSD (GBP strength/weakness)
OANDA:EURGBP (UK vs. Eurozone strength)
✨ “If you find value in my analysis, a 👍 and 🚀 boost is much appreciated — it helps me share more setups with the community!”
#Trading #Investing #SwingTrading #Breakout #Strategy #LayerStrategy #UK100 #FTSE #CFD #Protest #MoneyHeist #Plan

UK100 H4 | Price rebounds at 50% Fibonacci supportUK100 is falling towards the buy entry which is a pullback support that aligns with the 50% Fibonacci retracement and could bounce from this level to the upside.
Buy entry is at 9,181.01, which is a pullback support that aligns with the 50% Fibonacci retracement.
Stop loss is at 9,081.97, which is a swing low support.
Take profit is at 9,340.36, which is a swing high resistance.
High Risk Investment Warning
Trading Forex/CFDs on margin carries a high level of risk and may not be suitable for all investors. Leverage can work against you.
Stratos Markets Limited (tradu.com ):
CFDs are complex instruments and come with a high risk of losing money rapidly due to leverage. 65% of retail investor accounts lose money when trading CFDs with this provider. You should consider whether you understand how CFDs work and whether you can afford to take the high risk of losing your money.
Stratos Europe Ltd (tradu.com ):
CFDs are complex instruments and come with a high risk of losing money rapidly due to leverage. 66% of retail investor accounts lose money when trading CFDs with this provider. You should consider whether you understand how CFDs work and whether you can afford to take the high risk of losing your money.
Stratos Global LLC (tradu.com ):
Losses can exceed deposits.
Please be advised that the information presented on TradingView is provided to Tradu (‘Company’, ‘we’) by a third-party provider (‘TFA Global Pte Ltd’). Please be reminded that you are solely responsible for the trading decisions on your account. There is a very high degree of risk involved in trading. Any information and/or content is intended entirely for research, educational and informational purposes only and does not constitute investment or consultation advice or investment strategy. The information is not tailored to the investment needs of any specific person and therefore does not involve a consideration of any of the investment objectives, financial situation or needs of any viewer that may receive it. Kindly also note that past performance is not a reliable indicator of future results. Actual results may differ materially from those anticipated in forward-looking or past performance statements. We assume no liability as to the accuracy or completeness of any of the information and/or content provided herein and the Company cannot be held responsible for any omission, mistake nor for any loss or damage including without limitation to any loss of profit which may arise from reliance on any information supplied by TFA Global Pte Ltd.
The speaker(s) is neither an employee, agent nor representative of Tradu and is therefore acting independently. The opinions given are their own, constitute general market commentary, and do not constitute the opinion or advice of Tradu or any form of personal or investment advice. Tradu neither endorses nor guarantees offerings of third-party speakers, nor is Tradu responsible for the content, veracity or opinions of third-party speakers, presenters or participants.

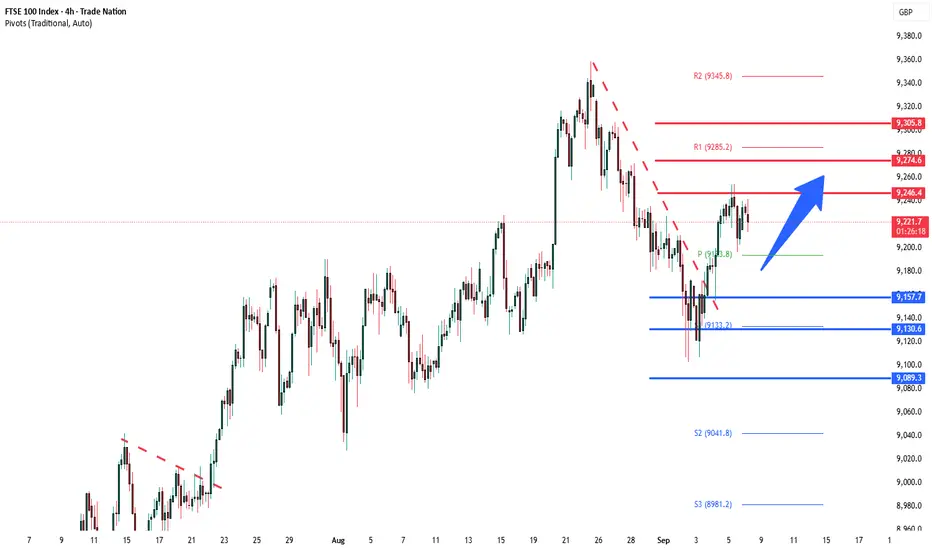
FTSE100 resistance retest at 9246The FTSE remains in a bullish trend, with recent price action showing signs of a corrective pullback within the broader uptrend.
Support Zone: 9160 – a key level from previous consolidation. Price is currently testing or approaching this level.
A bullish rebound from 9160 would confirm ongoing upside momentum, with potential targets at:
9246 – initial resistance
9275 – psychological and structural level
9305 – extended resistance on the longer-term chart
Bearish Scenario:
A confirmed break and daily close below 9160 would weaken the bullish outlook and suggest deeper downside risk toward:
9130 – minor support
9090 – stronger support and potential demand zone
Outlook:
Bullish bias remains intact while the FTSE holds above 9160. A sustained break below this level could shift momentum to the downside in the short term.
This communication is for informational purposes only and should not be viewed as any form of recommendation as to a particular course of action or as investment advice. It is not intended as an offer or solicitation for the purchase or sale of any financial instrument or as an official confirmation of any transaction. Opinions, estimates and assumptions expressed herein are made as of the date of this communication and are subject to change without notice. This communication has been prepared based upon information, including market prices, data and other information, believed to be reliable; however, Trade Nation does not warrant its completeness or accuracy. All market prices and market data contained in or attached to this communication are indicative and subject to change without notice.
FTSE Reignites Uptrend After PullbackA key characteristic of uptrends is broken resistance turning into support. Last week’s price action on the FTSE 100 showed clear evidence of this, with buyers defending the prior breakout zone.
Let’s take a look at the potential trigger levels that could fuel momentum, as well as the red flags traders should keep on the radar.
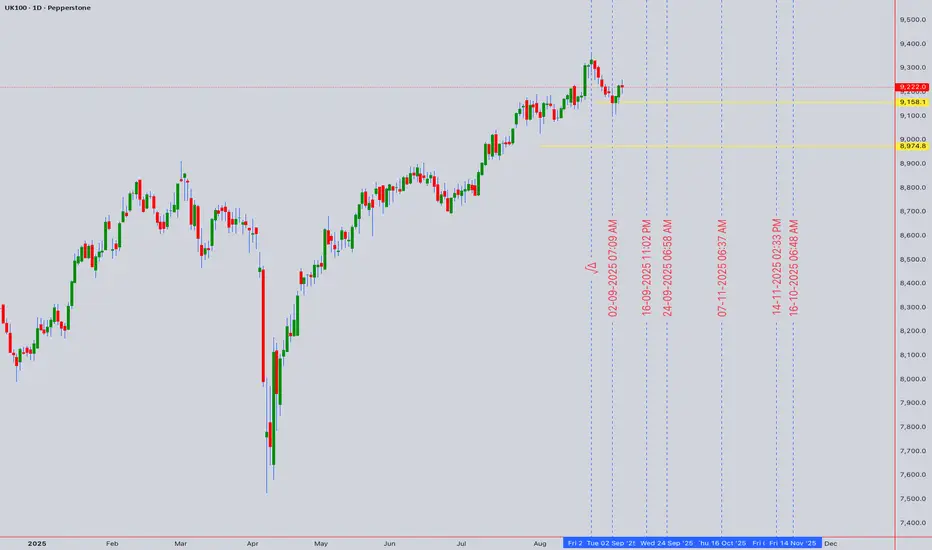
Daily Chart: From Breakout to Retest
The FTSE broke to new highs in August after spending several weeks consolidating in a tight range. The breakout was followed by a sustained but orderly pullback that carved out a descending channel. As the market retested that old range, buyers stepped back in and forced prices back above the channel, keeping the broader uptrend intact.
Interestingly, there were subtle price action clues before the breakout even occurred. On Tuesday 2nd September, the index sold off sharply in the morning but closed well off its lows, leaving behind a hammer candle that signalled selling exhaustion. The next day produced a bullish hammer contained within Tuesday’s range, forming an inside day pattern that hinted at pressure building. That combination of exhaustion and contraction set the stage for the breakout that followed.
UK100 Daily Candle Chart
Past performance is not a reliable indicator of future results
Hourly Chart: VWAP as the Battleground
If we drill down into the hourly candles, the detail helps refine market timing. Anchoring a VWAP to last week’s lows highlights the average entry point for traders who powered the FTSE’s recovery. That line now acts as a battleground: if price slips back beneath it, bullish momentum traders should be on alert.
In terms of entry triggers, last week’s swing high becomes a key pivot. A clean break above this level would confirm that buyers are back in control and could fuel another leg higher towards the August highs. Until then, the VWAP support zone remains the level to watch for signs of dip buying.
UK100 Hourly Candle Chart
Past performance is not a reliable indicator of future results
Disclaimer: This is for information and learning purposes only. The information provided does not constitute investment advice nor take into account the individual financial circumstances or objectives of any investor. Any information that may be provided relating to past performance is not a reliable indicator of future results or performance. Social media channels are not relevant for UK residents.
Spread bets and CFDs are complex instruments and come with a high risk of losing money rapidly due to leverage. 85.24% of retail investor accounts lose money when trading spread bets and CFDs with this provider. You should consider whether you understand how spread bets and CFDs work and whether you can afford to take the high risk of losing your money.

UK100--LONG--monthly bullish
--weekly bullish
--daily bullish
--entry and tp levels are as shown on chart

UK100 ShortLooks like the index might tumble from the golden Fibonacci level, confirmed by a price correction at the previous golden level and the mid-golden level at the 1.276 Fibonacci level, using the extended Fibonacci tool.

FTSE100 What is the FTSE 100?
The FTSE 100 Index (Financial Times Stock Exchange 100 Index), also called the "Footsie," is the UK’s leading stock market index. It represents the 100 largest companies listed on the London Stock Exchange by market capitalization. These companies cover a wide range of industries including finance, energy, healthcare, consumer goods, and more.
The FTSE 100 is widely regarded as a barometer of the overall health of the UK stock market and economy. It is capitalization-weighted, meaning larger companies have more influence on the index's movement. Examples of major constituents include Shell, HSBC, AstraZeneca, and Unilever.
How Do GB 10-Year Bond Yield (GB10Y) and Bank of England Interest Rate Affect FTSE 100?
1. GB 10-Year Government Bond Yield (GB10Y)
The 10-year UK government bond yield reflects long-term interest rates and investor outlook on inflation and growth.
Rising bond yields typically increase borrowing costs for companies, which can reduce profit margins and dampen stock prices, negatively affecting the FTSE 100.
Higher yields also make bonds more attractive relative to stocks, potentially leading investors to reallocate funds away from equities like the FTSE.
Lower bond yields make borrowing cheaper and bonds less competitive, boosting stock valuations and supporting the FTSE 100.
2. Bank of England (BoE) Interest Rate
The BoE’s interest rate influences short-term borrowing costs, consumer spending, and business investment.
An increase in the BoE rate usually raises loan and mortgage costs, slowing economic growth and often putting downward pressure on the FTSE 100.
Conversely, a rate cut or stable low rates encourage borrowing and spending, generally supporting equities including the FTSE 100.
The BoE’s rate decisions also signal monetary policy direction and economic outlook, impacting investor sentiment.
Summary
The FTSE 100’s performance is closely linked to UK bond yields and BoE interest rates. Rising GB10Y yields and higher BoE rates tend to pressure the FTSE by increasing costs and diverting investment to bonds. Lower yields and accommodative BoE policy usually support higher FTSE valuations by lowering costs and boosting investor confidence.
These UK economic factors, combined with global market trends and currency fluctuations (like GBP strength), shape the FTSE 100’s market dynamics.
BASED ON STRUCTURE ONE PUSH INTO SUPPLY MIGHT TRIGGER SELLOFF ON SENTIMENT
FED RATE CUT OR HIKE WONT AFFECT US MARKET ALONE ,THE UK STOCK MARKET WILL FEEL THE IMPACT OF FOMC SOON.
#FTSE100 #STOCKS #INDICES


Title: FTSE 100 - Bouncing Off Lower Channel BoundaryThe price of the FTSE 100 has reached the lower boundary of a major ascending channel, which is a strong support level. Historically, the price has demonstrated a strong bounce from this area, which makes the current entry point potentially attractive.
Key Factors:
Channel Support: The price is resting on the lower boundary of a clear ascending channel.
Historical Bounce: The price has historically rebounded from this level, confirming its significance.
Idea: During the next 4 hours, I expect the price to bounce from the current level and move towards the median line of the channel.
Disclaimer:
This is not financial advice. I recommend conducting your own analysis and managing your risks accordingly.

UK100 H4 | Potential bearish drop?UK100 is reacting off the sell entry at 9,217.39, which is a pullback resistance and could drop from this level to the downside.
Stop loss is at 9,268.71, which is a pullback resistance.
Take profit is at 9,071.86, which is a multi swing low support that aligns with the 127.2% Fibonacci extension and the 50% Fibonacci retracement.
High Risk Investment Warning
Trading Forex/CFDs on margin carries a high level of risk and may not be suitable for all investors. Leverage can work against you.
Stratos Markets Limited (tradu.com ):
CFDs are complex instruments and come with a high risk of losing money rapidly due to leverage. 65% of retail investor accounts lose money when trading CFDs with this provider. You should consider whether you understand how CFDs work and whether you can afford to take the high risk of losing your money.
Stratos Europe Ltd (tradu.com ):
CFDs are complex instruments and come with a high risk of losing money rapidly due to leverage. 66% of retail investor accounts lose money when trading CFDs with this provider. You should consider whether you understand how CFDs work and whether you can afford to take the high risk of losing your money.
Stratos Global LLC (tradu.com ):
Losses can exceed deposits.
Please be advised that the information presented on TradingView is provided to Tradu (‘Company’, ‘we’) by a third-party provider (‘TFA Global Pte Ltd’). Please be reminded that you are solely responsible for the trading decisions on your account. There is a very high degree of risk involved in trading. Any information and/or content is intended entirely for research, educational and informational purposes only and does not constitute investment or consultation advice or investment strategy. The information is not tailored to the investment needs of any specific person and therefore does not involve a consideration of any of the investment objectives, financial situation or needs of any viewer that may receive it. Kindly also note that past performance is not a reliable indicator of future results. Actual results may differ materially from those anticipated in forward-looking or past performance statements. We assume no liability as to the accuracy or completeness of any of the information and/or content provided herein and the Company cannot be held responsible for any omission, mistake nor for any loss or damage including without limitation to any loss of profit which may arise from reliance on any information supplied by TFA Global Pte Ltd.
The speaker(s) is neither an employee, agent nor representative of Tradu and is therefore acting independently. The opinions given are their own, constitute general market commentary, and do not constitute the opinion or advice of Tradu or any form of personal or investment advice. Tradu neither endorses nor guarantees offerings of third-party speakers, nor is Tradu responsible for the content, veracity or opinions of third-party speakers, presenters or participants.

FTSE 100 unwinding an oversoldTrying to unwind an oversold
careful,,,,The bounce could be a fake and moves back downwards into support

FTSE oversold bounce supported at 9160The FTSE remains in a bullish trend, with recent price action showing signs of a corrective pullback within the broader uptrend.
Support Zone: 9160 – a key level from previous consolidation. Price is currently testing or approaching this level.
A bullish rebound from 9160 would confirm ongoing upside momentum, with potential targets at:
9246 – initial resistance
9275 – psychological and structural level
9305 – extended resistance on the longer-term chart
Bearish Scenario:
A confirmed break and daily close below 9160 would weaken the bullish outlook and suggest deeper downside risk toward:
9130 – minor support
9090 – stronger support and potential demand zone
Outlook:
Bullish bias remains intact while the FTSE holds above 9160. A sustained break below this level could shift momentum to the downside in the short term.
This communication is for informational purposes only and should not be viewed as any form of recommendation as to a particular course of action or as investment advice. It is not intended as an offer or solicitation for the purchase or sale of any financial instrument or as an official confirmation of any transaction. Opinions, estimates and assumptions expressed herein are made as of the date of this communication and are subject to change without notice. This communication has been prepared based upon information, including market prices, data and other information, believed to be reliable; however, Trade Nation does not warrant its completeness or accuracy. All market prices and market data contained in or attached to this communication are indicative and subject to change without notice.

Bears in full charge on UK100My first post here so, bare with me. I trade the uk100 with the broker Tradenation. The past few days and especially last week we had high bearish movements, establishing new lower lows. seems it hasnt run out of steam just yet. trendlines and support/resistance lines waiting to be broken or bounced off of. all eyes on UK100for the next couple of days to see a continuation downtrend, or a possible break into a new upward trend making newer ATH. Trade the range, wait for the open morning breakout of the first 1 hour candle, establish high, low, wait for the test, breakout and enter trades. goodluck to every single trader here.

FTSE100 surges to records despite CPI surprise but can it last?The FTSE 100 has surged to a new all-time high, defying expectations after UK inflation surprised to the upside at 3.8%. This resilience can be attributed to renewed global interest in undervalued UK stocks, particularly defensives, as investors anticipate a potential end to the BOE’s easing cycle in 2025 due to persistent price pressures.
The market remains sensitive to global cues, with attention turning to the upcoming Jackson Hole symposium. A more hawkish tone from the Federal Reserve could reinforce risk aversion and further boost the FTSE’s appeal as a relative safe haven, while a dovish Fed may see flows return to US equities, posing a conditional risk to the FTSE’s rally.
From a technical standpoint, the FTSE 100’s recent breakout places immediate focus on the 9,367–9,400 resistance zone, which marks the upper boundary of the latest upward channel. A sustained daily close above 9,400 could open the door to further upside, targeting the psychological 9,500 level next.
On the downside, initial support is seen at 9,200, with a break below there potentially exposing the 9,050–9,000 area for a deeper pullback. Traders should watch for confirmation of direction at these levels, as volatility may increase around key macro events.
This content is not directed to residents of the EU or UK. Any opinions, news, research, analyses, prices or other information contained on this website is provided as general market commentary and does not constitute investment advice. ThinkMarkets will not accept liability for any loss or damage including, without limitation, to any loss of profit which may arise directly or indirectly from use of or reliance on such information.

FTSE100 is at critical pointFTSE100 of the 1H is at critical point. We have said before that once the price breaks the trend line is going to be reversl, that has to be adjusted a little a bit. but we have to consider the MAs on the 4H chart.
Good luck to you all,
MarketsTitan

FTSE resistance retest at 9346The FTSE remains in a bullish trend, with recent price action showing signs of a resistance retest within the broader uptrend.
Support Zone: 9240 – a key level from previous consolidation. Price is currently testing or approaching this level.
A bullish rebound from 9240 would confirm ongoing upside momentum, with potential targets at:
9346 – initial resistance
9395 – psychological and structural level
9437 – extended resistance on the longer-term chart
Bearish Scenario:
A confirmed break and daily close below 9240 would weaken the bullish outlook and suggest deeper downside risk toward:
9193 – minor support
9135 – stronger support and potential demand zone
Outlook:
Bullish bias remains intact while the FTSE holds above 9240. A sustained break below this level could shift momentum to the downside in the short term.
This communication is for informational purposes only and should not be viewed as any form of recommendation as to a particular course of action or as investment advice. It is not intended as an offer or solicitation for the purchase or sale of any financial instrument or as an official confirmation of any transaction. Opinions, estimates and assumptions expressed herein are made as of the date of this communication and are subject to change without notice. This communication has been prepared based upon information, including market prices, data and other information, believed to be reliable; however, Trade Nation does not warrant its completeness or accuracy. All market prices and market data contained in or attached to this communication are indicative and subject to change without notice.

FTSE 100 grinds higher, momentum slowsThe FTSE ran into resistance at 9360, its record high, before rebounding lower to 9100. The price has recovered from this low and it is grinding higher, guided by the rising trendline and the 20 SMA, but the RSI points to slowing momentum, warranting caution.
Should momentum pick up, buyers will look to extend gains towards 9360 and fresh record highs.
Minor support is at 9200. Below here, the 50 SMA comes into focus at 9100. A break below here opens the door to 8890 to negate the longer-term uptrend.
FC

FTSE Challenges Key Resistance - Breakout or False Dawn?UK100 Technical Analysis: 🇬🇧 FTSE Challenges Key Resistance - Breakout or False Dawn? 🌅
Asset: UK100 (FTSE 100 Index CFD)
Analysis Date: September 5, 2025
Current Closing Price: 9,222.0 (as of 11:54 PM UTC+4)
Timeframes Analyzed: 1H, 4H, D, W
Executive Summary & Market Outlook 🧐
The UK100 is testing a critical technical and psychological resistance zone between 9,200 and 9,250. 🚧 This level has acted as a significant barrier in the past. The index is in a near-term uptrend but remains in a broader multi-month consolidation phase. A decisive breakout above 9,250 could signal the start of a new bullish leg, while a rejection here would reinforce the range-bound narrative and trigger a pullback. This analysis provides a clear roadmap for intraday 🎯 and swing traders 📈 navigating this pivotal level.
Multi-Timeframe Technical Analysis 🔍
1. Trend Analysis (Daily & 4-Hour Chart):
Primary Trend: 🟡 Range-Bound (Neutral). Price is trapped within a larger consolidation rectangle between ~8,800 and 9,250.
Short-Term Trend: 🟢 Bullish. The recent rally from the 9,000 support has been strong, bringing price to the upper boundary of the range.
2. Key Chart Patterns & Theories:
Range-Bound Consolidation 📊: The dominant pattern is a large rectangle. The current test of the range high (~9,250) is a make-or-break moment. A breakout would be significant, while a rejection is a classic range-trading signal.
Elliott Wave Theory 🌊: The move off the recent low looks corrective (3 waves), suggesting it may be a B-wave or part of a larger consolidation pattern within the range. This reinforces the importance of the 9,250 resistance.
Ichimoku Cloud (H4/D1) ☁️: Price is trading just above the Cloud on the daily chart, indicating a tentative bullish bias. However, the Cloud is relatively flat, reflecting the lack of a strong trend. A clear break above 9,250 would see price move decisively above the Cloud.
Wyckoff Method: The price action could be interpreted as part of a potential re-accumulation phase near the top of the range. A breakout on increasing volume would confirm this.
3. Critical Support & Resistance Levels:
Resistance (R1): 9,220 - 9,250 (Key Range High & Technical Ceiling) 🚨
Resistance (R2): 9,400 (Projected Target if breakout occurs)
Current Closing Price : ~9,222
Support (S1): 9,100 - 9,150 (Immediate Support & 21-period EMA) ✅
Support (S2): 9,000 - 9,050 (Major Range Support - Must Hold) 🛡️
Support (S3): 8,800 (Ultimate Range Low & 200-day EMA)
4. Indicator Consensus:
RSI (14-period on 4H/D): Reading is near 62, in bullish territory but not yet overbought. This suggests there is room for further upside if buyers can maintain control. A bearish divergence here would be a strong sell signal.
Bollinger Bands (4H) 📏: Price is pressing against the upper band, a sign of strong short-term momentum. A rejection here could see price move back towards the middle band.
Moving Averages: The 50 and 200-day EMAs are flat, confirming the range-bound nature. The 21-period EMA on the 4H chart is key short-term dynamic support.
Volume & VWAP: A breakout above 9,250 needs to be confirmed with a significant increase in volume to be trusted. Low-volume breakouts are often false.
Trading Strategy & Forecast 🎯
A. Intraday Trading Strategy (5M - 1H Charts):
Bearish Scenario (Range Rejection Play) ⬇️: This is a classic range trade. Fade the resistance with a short position.
Entry: On clear rejection signals at 9,240-9,250 (e.g., bearish pin bar, engulfing pattern).
Stop Loss: Tight, above 9,270.
Target: 9,150 (TP1), 9,100 (TP2).
Bullish Scenario (Breakout Play) ⬆️: If price breaks out with conviction, wait for a pullback for a better entry.
Entry: On a pullback to re-test 9,220-9,230 as new support.
Stop Loss: Below 9,200.
Target: 9,350 (TP1), 9,400 (TP2).
B. Swing Trading Strategy (4H - D Charts):
Strategy: RANGE TRADING OR BREAKOUT WAIT. The most logical play is to trade the range until it breaks.
Ideal Long Zone: Near the 9,000 - 9,050 support area. ✅
Ideal Short Zone: Near the 9,220 - 9,250 resistance area. ✅
Breakout Strategy: A daily close above 9,270 would be a strong buy signal targeting 9,400+. A daily close below 8,950 would be a strong sell signal.
Risk Management & Conclusion ⚠️
Key Risk Events: UK economic data (GDP, CPI, BoE decisions) and GBP volatility are key drivers. 🔥 As a heavily international index, the FTSE is also highly sensitive to global risk sentiment and commodity prices (particularly oil and mining stocks).
Position Sizing: Trading within a range requires tight stop losses. Ensure your position size allows for a stop placed just outside the range boundaries without incurring excessive risk.
Conclusion: The UK100 is at a critical juncture. ⚖️ The battle between the bulls and the bears is concentrated at the 9,220-9,250 resistance wall. Until a decisive break occurs, the range-bound strategy is favored. Swing traders should be patient for entries near support or a confirmed breakout. Intraday traders can fade the range extremes. The next major move will be dictated by the resolution of this level. 📊
Overall Bias: 🟢 Bullish above 9,270 | 🔴 Bearish below 8,950 | 🟡 Neutral/Range-Bound between 9,000-9,250
For individuals seeking to enhance their trading abilities based on the analyses provided, I recommend exploring the mentoring program offered by Shunya Trade. (Website: shunya dot trade)
I would appreciate your feedback on this analysis, as it will serve as a valuable resource for future endeavors.
Sincerely,
Shunya.Trade
Website: shunya dot trade
⚠️Disclaimer: This post is intended solely for educational purposes and does not constitute investment advice, financial advice, or trading recommendations. The views expressed herein are derived from technical analysis and are shared for informational purposes only. The stock market inherently carries risks, including the potential for capital loss. Therefore, readers are strongly advised to exercise prudent judgment before making any investment decisions. We assume no liability for any actions taken based on this content. For personalized guidance, it is recommended to consult a certified financial advisor.
FTSE 100 Wave Analysis – 4 September 2025- FTSE 100 reversed from support area
- Likely to rise to resistance level 9330.00
FTSE 100 Index recently reversed from the support area between the pivotal support level 9100.00 (which has been reversing the price from July), lower daily Bollinger Band and the 38.2% Fibonacci correction of the upward impulse from August.
The upward reversal from this support area created the daily Japanese candlesticks reversal pattern Hammer, which stopped the previous wave 2.
Given the overriding daily uptrend, FTSE 100 Index can be expected to rise to the next resistance level 9330.00 (which stopped the previous impulse wave 1).

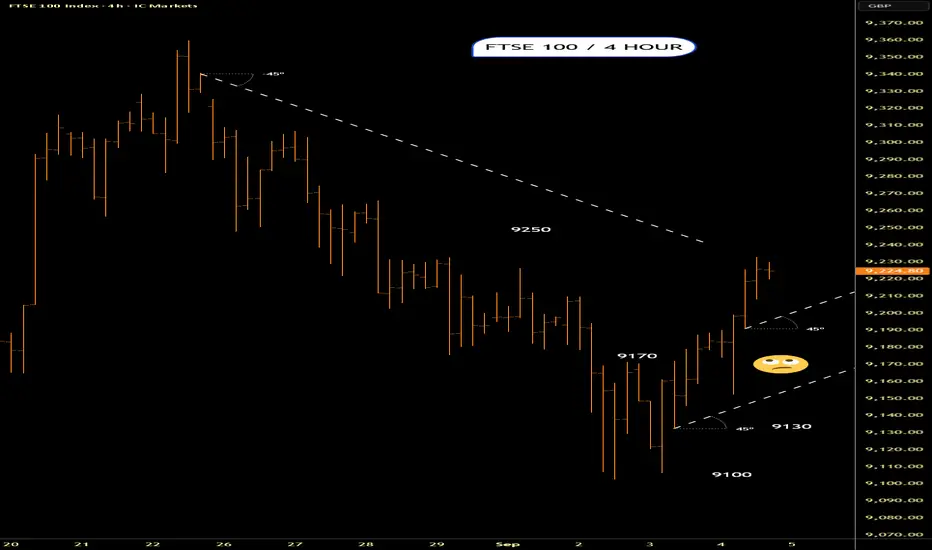
No clear break of UK100 yetTRADENATION:UK100
Good morning my fellow traders!
uk100 price still within its downward trend range, currently rising but seems to have hit some consolidation around the 9150 - 9155 area.
areas to watch -
BULLS : 9162.0 has some resistance, above this is 9190.0. CAUTION around this area as the downward trend line is just above 9162.0, breaking above the trendline will see 9190.0
BEARS : watch for rejections at 9162.0, for a further pull back towards 9130.0, and 9090.0.
apply your risk management during this stage as it may break upwards pushing towards a new potential ATH, or a further continuation of its downward path.
Apply your strategy, trade the range and goodluck to you!
