US NAS100Preferably suitable for scalping and accurate as long as you watch carefully the price action with the drawn areas.
With your likes and comments, you give me enough energy to provide the best analysis on an ongoing basis.
And if you needed any analysis that was not on the page, you can ask me with a comment or a personal message.
Enjoy Trading ;)
USTECH100CFD trade ideas

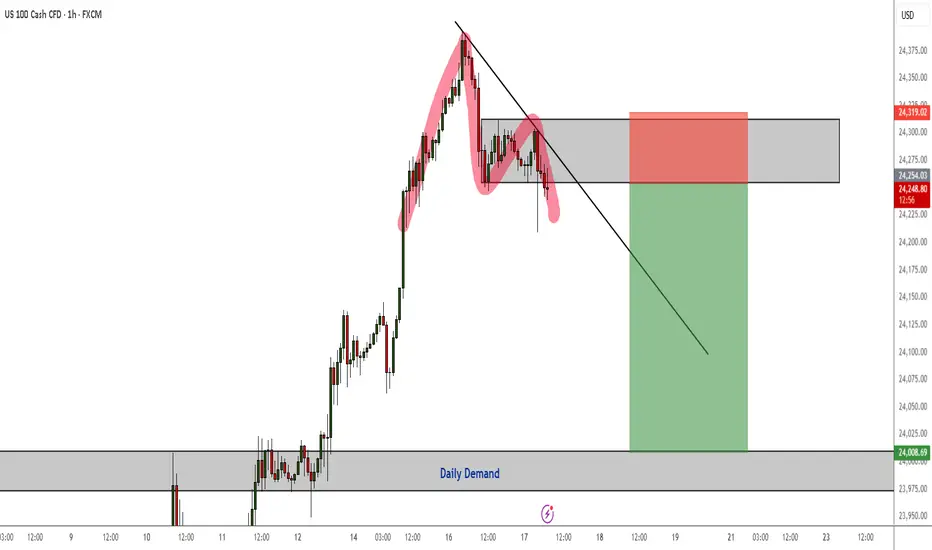
NAS100 Pressure to the Downside Continues - Double Top RejectionPressure to the downside will likely resume today for NQ as we now have a double top rejection pattern as confirmation to short.
I am aiming for the daily demand zone for my TP.
NSDQ100 volatility, triple-witching could exaggerate swings.Nasdaq 100 Trading Drivers
Macro backdrop:
US data came in strong:
Jobless claims fell to 231k (vs. 240k exp; prior 264k).
Continuing claims declined to 1.92m (vs. 1.95m exp).
Philly Fed survey surged to 23.2 (vs. 1.7 exp), an 8-month high.
This eased US slowdown fears and reinforced risk-on sentiment.
Equities:
Nasdaq +0.94% → new record high.
Tech/semis led: Intel (+22.8%) strongest S&P performer after Nvidia’s $5bn investment and US gov’t stake news. Philadelphia Semiconductor Index +3.6%.
Momentum broadened → Russell 2000 +2.5%, first record high since 2021.
Rates:
Treasuries sold off on strong data → 10yr yield +1.7bps to 4.11%, 30yr +3.4bps. Higher yields a potential headwind if sustained.
Event risk:
Trump–Xi call (9 a.m. ET): key for TikTok’s US future & broader trade tone. Risk of mixed headlines given tensions (China soybeans skip, Gaza criticism, Taiwan aid freeze).
BoJ surprise: announced unwind of $4.2bn/year ETF holdings → dampened global risk tone.
US triple-witching: options/futures expiries today → elevated intraday volatility likely.
Nasdaq 100 Trading Takeaway
Bullish momentum intact: record highs fueled by tech & semiconductor leadership.
Short-term watchpoints: Trump–Xi headlines and BoJ shift may inject volatility; triple-witching could exaggerate swings.
Key risk: rising US yields may cap upside if bond sell-off deepens.
Bias: Still risk-on / buy dips near-term, but position sizing should account for headline-driven volatility today.
Key Support and Resistance Levels
Resistance Level 1: 24600
Resistance Level 2: 24710
Resistance Level 3: 24800
Support Level 1: 24210
Support Level 2: 24085
Support Level 3: 24940
This communication is for informational purposes only and should not be viewed as any form of recommendation as to a particular course of action or as investment advice. It is not intended as an offer or solicitation for the purchase or sale of any financial instrument or as an official confirmation of any transaction. Opinions, estimates and assumptions expressed herein are made as of the date of this communication and are subject to change without notice. This communication has been prepared based upon information, including market prices, data and other information, believed to be reliable; however, Trade Nation does not warrant its completeness or accuracy. All market prices and market data contained in or attached to this communication are indicative and subject to change without notice.
NAs100 ShortElite Analysis
Confirmation met
Price reacting off structural liquidity
Targeting lower liquidity pools

Buy Nas100Nas is bullish and will continue buying. There are two possible buy entries, being the demand zone, or the liquidity grab zone. Do not enter a trade on the demand zone unless there is another confirmation on lower time frames. Remember it is Friday tomorrow, and the market can be very manipulative on Friday. Do not force trades, there is nothing wrong with not having a trading day. Trade what you see, and not what you feel.

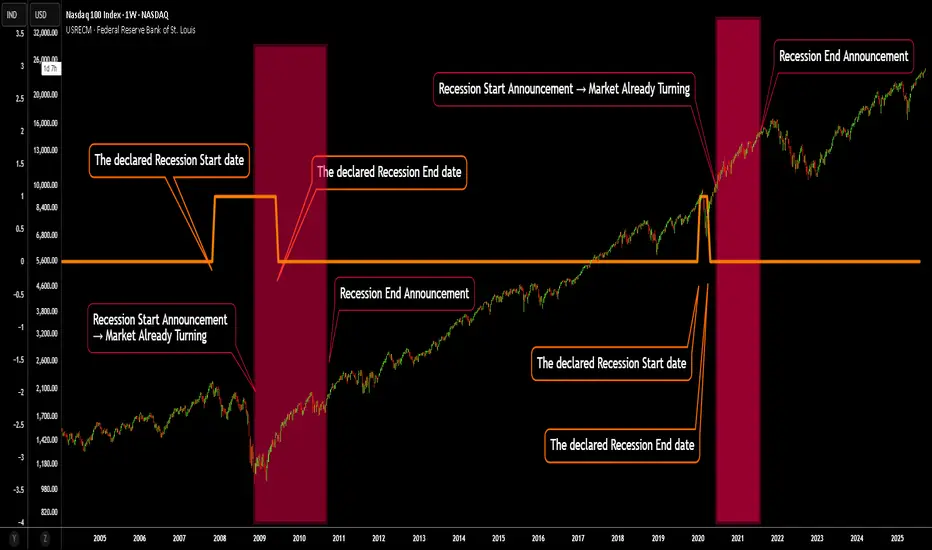
Recession “Announcements” vs. Reality — A Contrarian SignalMost traders anchor their sentiment to the official declarations of a recession. But here’s the catch: by the time policymakers and institutions announce “we are in a recession”, the contraction has almost always run its course.
If you are waiting for an official announcement we are in a recession in order to get out, It will be too late. You will likely be selling to the smart money buying for the eventual rise.
The game is rigged against the novice trader relying on generally available news.
On the chart:
The orange line marks the actual recession periods identified by economic data.
The red background shading highlights when the recession was officially recognized and reported.
Notice the lag: announcements consistently come after the worst is already behind us. Historically, these “recognition windows” line up closer with market bottoms than with tops.
👉 The key takeaway:
When you hear that a recession has been declared, it’s often not a sell signal — it’s closer to a buy signal. By then, the market has already priced in the pain, and recovery is underway.
This perspective flips conventional wisdom on its head: don’t fear the announcement — see it as confirmation that the worst is behind us. And do not wait for it to tell you we are going in to a recession, look at what the smart money is doing, what insiders are doing, what the banks are doing. Many thin that lower interest rates means a boost to business. But they are wrong.
Banks will charge as much as they think the economy can sustain. If Interest rates are rising, they know that business will be doing better. Falling interest rates tells you the banks know they can not get away with charging more and the economy is tanking.
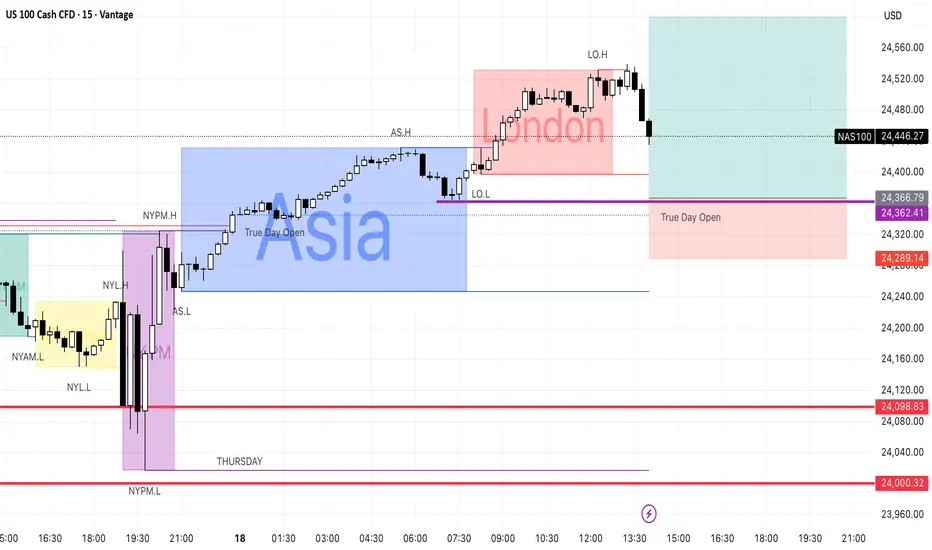
Nas100 Trade Set Up Sep 18 2025www.tradingview.com
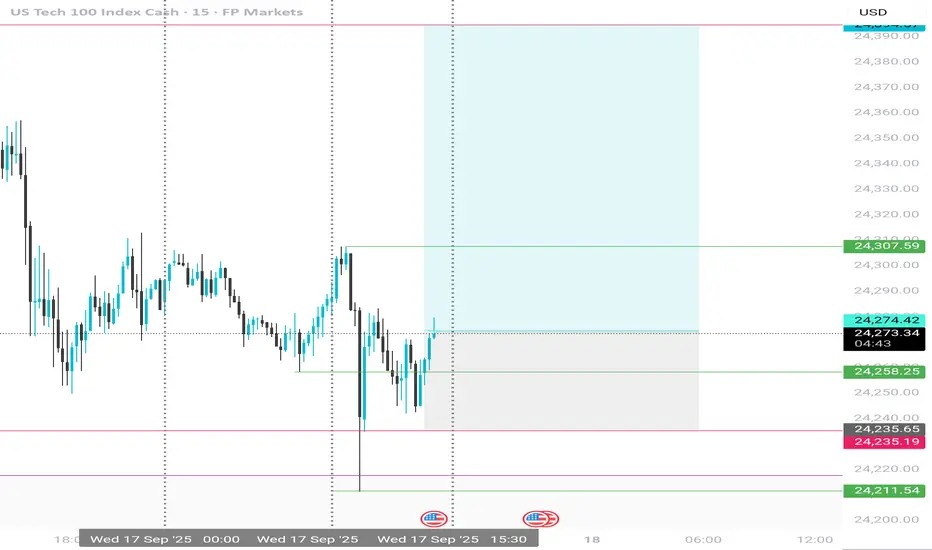
price swept PDH and changed state on the 1h and created a 15m FVG so i want to see a retest of the CISD or 15m FVG, respect them to see bearish structure to the downside towards PDL but if price inverts 15m FVG i will look for buys

NASDAQ100 HIGH PROBABILITY SETUP SOON!!!🚨 NAS100 HIGH PROBABILITY SELL SETUP 🚨
* Here We Can See Clearly The Next Potential Move For US100 Coming Hours/Days.
* Keep Your Eyes Close On Your Trading Positions.
* Happy PIP Hunting Traders.
FXKILLA.

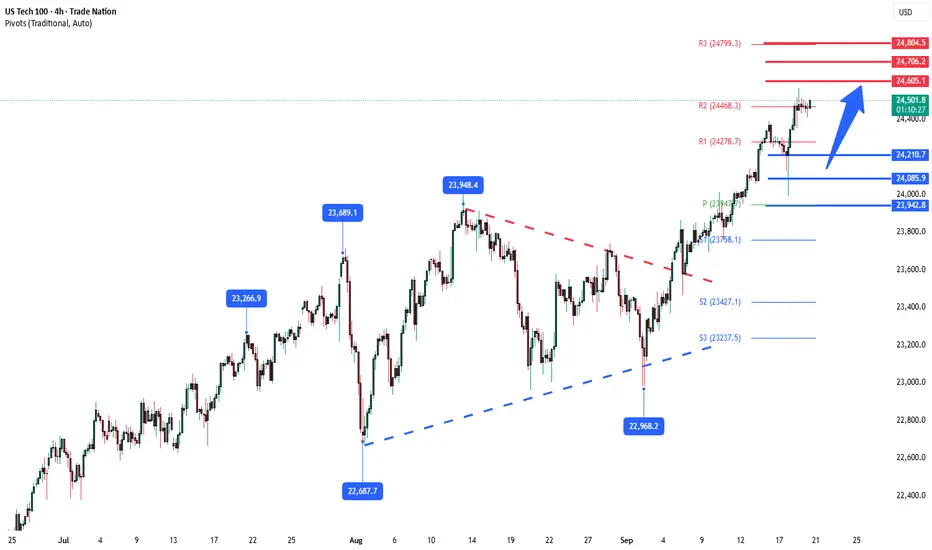
NAS100USD (SHORT)
Trendlines show resistance and price has rejected at Zone
Also Major Pivots Resistance Zone

NAS100Success in forex and stocks comes from a combination of knowledge, discipline, and patience. Understanding market trends, economic factors, and company fundamentals is crucial, but equally important is controlling emotions and sticking to a well-planned strategy. Continuous learning, adapting to changing conditions, and managing risk wisely can turn opportunities into consistent growth over time. Consistency, not luck, separates successful traders from the rest.

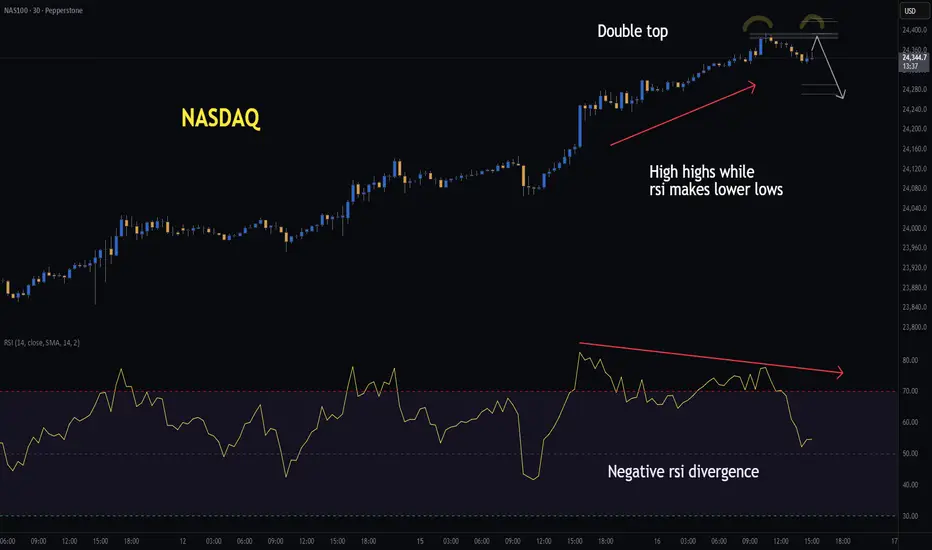
NASDAQ | H1 Double Top | GTradingMethodHello Traders,
I’m watching the Cash100 for a potential double top that could set up a short opportunity. Price is currently making higher highs while RSI is making lower lows — a clear sign of weakening buying momentum, also known as negative RSI divergence.
As further confluence, we have the FOMC tomorrow, and markets often prefer to de-risk ahead of such events. Also, there is a rising wedge on the S&P500 on the hourly chart and the chance that there is also a potential double top on the 30min timeframe.
✅ Conditions before entry:
- 30min candle must close within the range and at the correct level
- The closing candle must meet my required closure rate
- Ideally, volume should be lower (though I’ll allow an exception given it will be the U.S open)
- RSI should confirm with another divergence
📊 Trade Plan:
Risk/Reward: 2.9
Entry: 24,385.1
Stop Loss: 24,418.6
Take Profit 1 (50%): 24,290
Take Profit 2 (50%): 24,271
💡 GTradingMethod Tip:
Patterns like double tops are powerful, but they’re strongest when combined with momentum divergence. Always confirm multiple factors before entering.
🙏 Thanks for checking out my post!
Follow me for the next update and feel free to share your thoughts below — I’d love to hear them.
📌 Please note: This is not financial advice. This content is to track my trading journey and for educational purposes only.
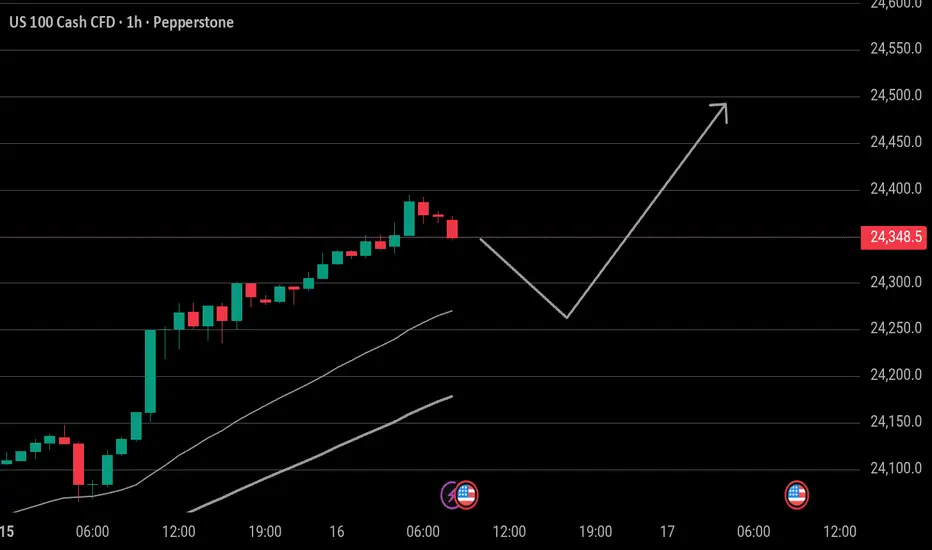
78.60% PUSH-UP (nas100)All technicals are pointing towards a big push upwards (NAS100).
Keep risk to a limit on this one. Let's see how she plays out.

3rd Short term trade with NASDAQAfter two consecutive profits on the NASDAQ, I hope this third trade will also yield satisfactory result. A good risk-reward ratio is crucial in trading.

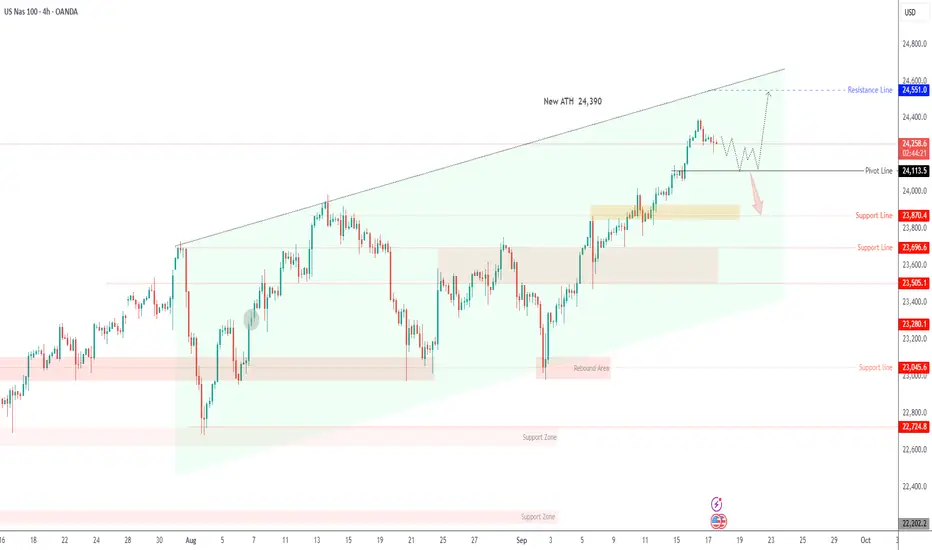
USNAS100 Braces for Fed Decision – Key Pivot at 24,300USNAS100 – Overview
The Nasdaq is set for a highly volatile session as markets await the Federal Reserve’s rate decision later today.
Traders widely expect a 25 bps cut, but a surprise 50 bps cut—though less likely—would signal stronger confidence in stable inflation and U.S. economic health, fueling a strong bullish rally.
Even if the Fed delivers the expected 25 bps cut, the key market mover will be Chair Powell’s press conference and the updated dot plot, which could reshape expectations for future easing.
Technical Outlook
📉 Bearish scenario
While trading below 24,300, price shows potential for a pullback toward 24,115.
A confirmed break below 24,115 would extend the bearish move toward 23,870 → 23,700.
📈 Bullish scenario
Stabilization above 24,115 keeps the broader uptrend intact.
A breakout above 24,300 would confirm bullish momentum, targeting 24,550 → 24,700 → 24,850.
📌 Market Context:
50 bps cut + dovish Powell → strong bullish breakout above 24,300 toward 24,550+.
25 bps cut + cautious guidance → moderate moves; price may remain range-bound or retest 24,115 before resuming higher.
Hawkish tone → deeper correction toward 23,870 or lower.
Is NASDAQ going for a correction or Stop Hunt?Are we on the right track? If I missed anything please let me know in the comments 🙏🏾


NAS100 longits broke weekly resistance and i think its going to go up from this current price, since its the stockmarket the tp is high cause of how it moves. long term swing.


NASDAQ Approaching a critical +1 year Resistance.Nasdaq (NDX) is close to hitting our 24500 bullish target, which as we explained on our previous analysis represents a +6.78% rise, the technical Bullish Leg of the Channel Up that started back in mid-May.
This pattern is however headed towards a +1 year Resistance level, the Higher Highs trend-line that started on the July 11 2024 High. Technically, we should be expecting a rejection there and pull-back towards at least the 1D MA50 (blue trend-line), if not the 1D MA100 (green trend-line), which is where an identical Channel Up in 2024 that topped on December 16 2024, found Support at.
Even the 1D RSI sequences among the two patterns look similar. As a result, there are high probabilities to see a short-term correction there, which will in turn fuel the end-of-year rally. Our new medium-term Target is 25000.
-------------------------------------------------------------------------------
** Please LIKE 👍, FOLLOW ✅, SHARE 🙌 and COMMENT ✍ if you enjoy this idea! Also share your ideas and charts in the comments section below! This is best way to keep it relevant, support us, keep the content here free and allow the idea to reach as many people as possible. **
-------------------------------------------------------------------------------
💸💸💸💸💸💸
👇 👇 👇 👇 👇 👇

Direction bias on Nas100I'm bullish on nas100 and to continue the bullish run I'm expecting a pull back to sweet the inducement liquidity low then continue to the upside.

sweep London lows and up we go !!I believe price will sweep liquidity at the London low the I believe price will head back up past the todays London highs.
NasdaqNasdaq continued to renew highs overnight. This overbought region is likely to trigger a pullback with profit-taking to the 24250 range. Today we'll see the Retail Sails economic data, which could be favorable for the technology sector and lead to 24500.
Nasdaq longLooking for longs again .
Asian lows have been swept.
Manipulation amd reversal to the upside.