Central bank week ahead!Central bank week ahead! We've got interest rate decisions out from the Bank of Canada, FED, Bank of England and Bank of Japan.
BoC 17/09 - 25bps cut 94% - First on the chopping board is the BoC who are set to reduce interest rates by 0.25%. This comes amid steady inflation, holding below the 2% target and below recent expectations for an increase, currently at 1.9%. They've also seen unemployment rising to 7.1%, the highest level since 2021. The BoC has acknowledged the weakening labour market but are expected to follow a wait and see approach after todays cut. Current rates 2.75%
FED 17/09 - 25bps cut 98% - The FED's first rate decision after some very rocky labour market data and a surprise dovish tilt from Powell at Jackson Hole. Inflation remains sticky but the FED has stated that their current focus is set on labour market weakness. As well as the rates, we will also receive updated economic and interest rate projections, likely to carry much more weighting and longer term direction. In the economic projections we'll be looking out for the dot plot, GDP, employment and inflation to gauge future expectations for FED rates. This could undermine or support the rate cuts to trade with caution. Current rates 4.25-4.50%
BoE 18/09 - HOLD 100% - The BoE is set to hold rates steady at 4.00% amid elevated inflation data and recently positive labour market data. Inflation data came in lower than consensus earlier this week but still remains well above target at 3.8%. In the previous BoE meeting we saw a surprise hawkish tilt in the way of MPC voting.
2 members shifted from voting to cut to voting for a hold and the scales are expected to remain fairly heavy on the hold side tomorrow. The member voting and minutes will provide much needed context to the potential hold to come. Current rates 4.00%
BoJ 19/09 - HOLD 87% - Rounding a busy week off with the BoJ who is set to hold rates at 0.50%. There has been some hawkish comments from the BoJ in recent times as inflation holds around 3.1% and unemployment recovers from 2.5% to 2.3% but amid political turbulence a bold move from the BoJ in this decision is less likely. However the other potential would be for a surprise rate hike with a current probability of 11%. The BoJ is no stranger to surprises so will be looking out for any action or comments made to support future JPY strength or weakness. Current rates 0.50%
These fresh rates provide the opportunity for divergences between monetary policy. This could park the continuation higher for pairs such as EURUSD and GBPUSD if the fed sticks to a more dovish tilt and supports this in their economic projections.
Other currency pairs such as AUDCAD and AUDNZD provide some clear divergence with the RBA holding higher rates and the BoC and RBNZ cutting with lower rates. Any clear pullbacks within these assets could provide opportunity to get long and hold through for a bigger move
USTECH100CFD trade ideas

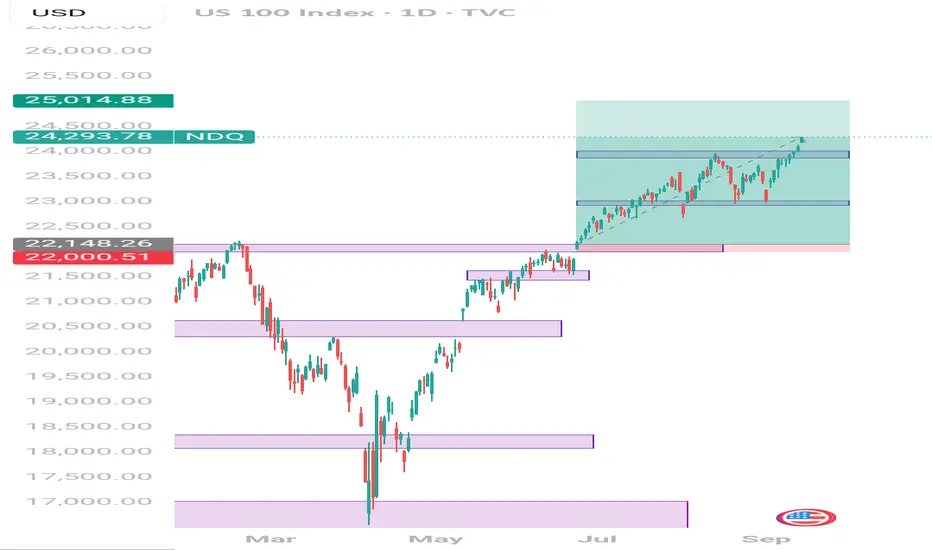
Nasdaq long position Nasdaq headed for $25,000. Recently Nasdaq surpassed my target of $24,000 and seems like the bullish momentum won't be stopping anytime soon. I have optimism of Nasdaq reaching $26,000 before the year ends.
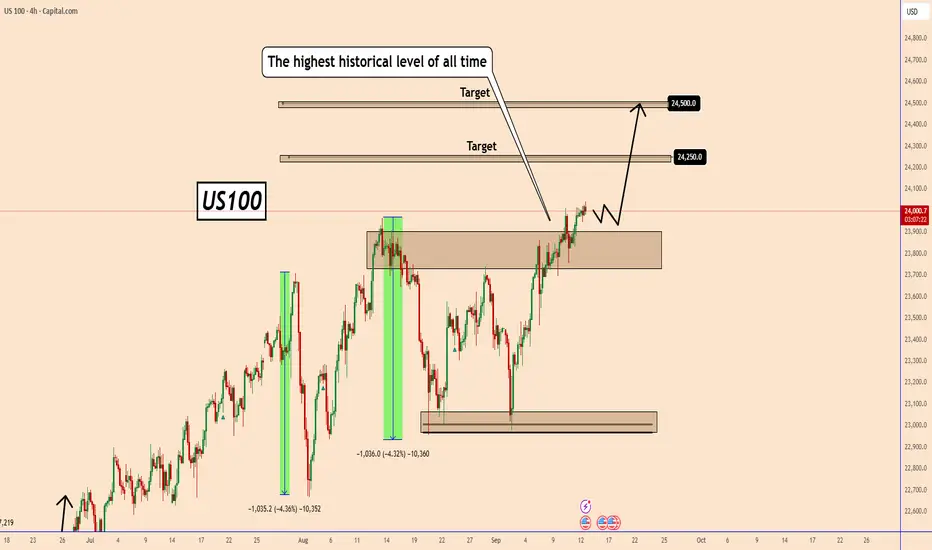
US100 Hits All-Time HighUS100 Hits All-Time High
Yesterday, US100 reached a new record high at 24040, confirming the strength of its bullish trend.
With U.S. inflation cooling, the market is now expecting the Federal Reserve to cut interest rates, possibly starting this cycle and continuing in the months ahead.
Lower rates tend to support stocks and indices, giving the economy room to breathe after a long period of tight monetary policy.
I expect US100 to continue rising toward 24500, with intermediate targets at 24250 and 24500 in the coming week.
You may find more details in the chart!
Thank you and Good Luck!
❤️PS: Please support with a like or comment if you find this analysis useful for your trading day❤️
NAS100 Pullback into Fibonacci Zone: Watching for Bullish Break📊 NASDAQ 100 (NAS100) Update 📊
The NAS100 is in a strong bullish trend 🟢📈, clearly visible on the 4H chart ⏰ with consistent higher highs and higher lows 🔼🔼.
Currently, price has pulled back 🔽 right into my optimal entry zone 🎯 based on the Fibonacci retracement 🔢. From here, I’ll be watching closely for a bullish break of structure (BOS) 🔓 on the 15M timeframe ⏰ — that would be my signal to look for a long entry 🚀.
⚠️ This breakdown is educational only and not financial advice. 📚

Nas100 Trade Set Up Sep 16 2025www.tradingview.com
price is trading above PDH an made ATH with a big 4h FVG also inverted a 15m FVG so if we can stay closed below and retest the 15m IFVG i will look for sells to the 4h FVG


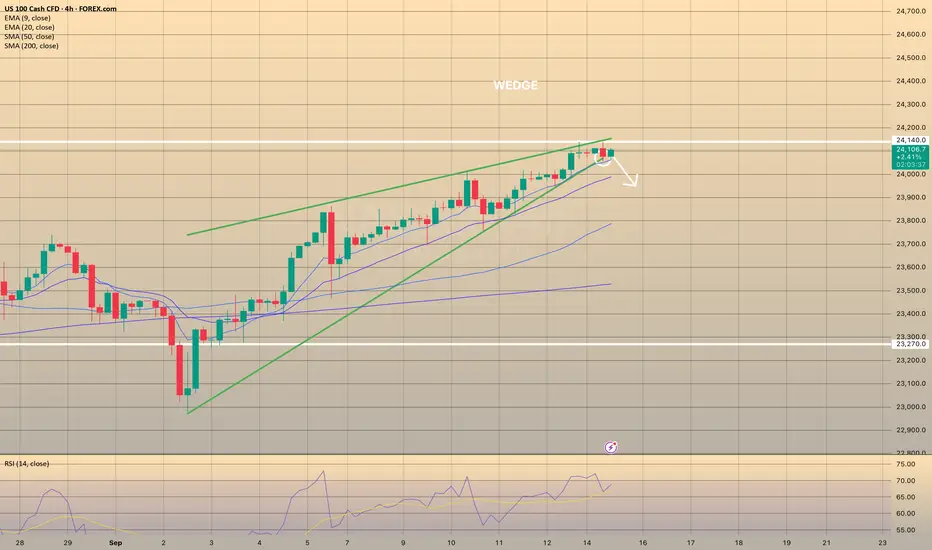
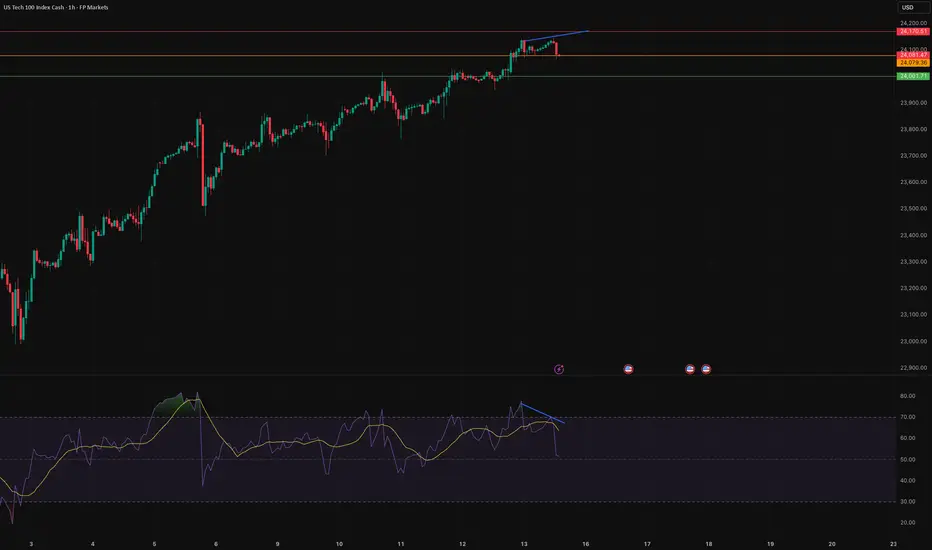
PullbackThe price is at the channel resistance and we have some good hourly divergences on RSI and MACD. Some pullback may start today. Retest of the green trendline at some point makes sense, but it may be too early for this, it can bounce and go higher from previous peaks.

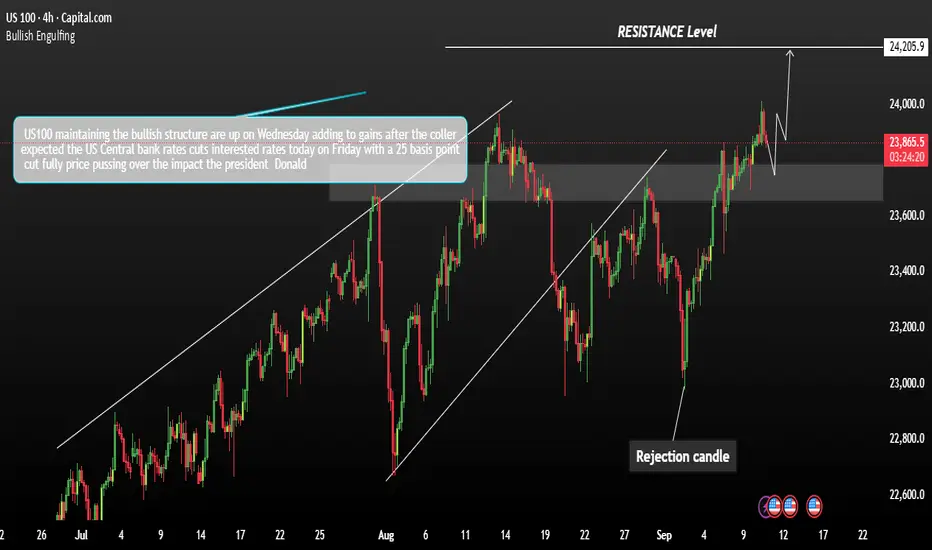
USNASDEQ 100 Futures are Price consolidation High Top US100 futures are higher on Wednesday, extending gains after a cooler-than-expected US Producer Price Index (PPI) report. The data eased inflation concerns, supporting risk sentiment. Oracle (ORCL) shares are surging, up more than 30% in pre-market trading following strong earnings and upbeat guidance.
The index remains bullish in structure. Price is expected to test the support area near 23,200. As long as the index holds above this level, momentum favours a move higher toward 24,200 in the next leg up.
You may find more details in the chart.
Trade wisely best of Luck.
Ps; Support with like and comments for better analysis Thanks for Support.
NASDAQ INDEX (US100): To the New Highs!
US100 index successfully broke and closed above a major
daily resistance cluster on Friday.
The index will likely grow more and reach new highs soon.
The next resistance is 24300
❤️Please, support my work with like, thank you!❤️
I am part of Trade Nation's Influencer program and receive a monthly fee for using their TradingView charts in my analysis.

USNAS100 Holds Below 24,115 as Fed Rate Decision LoomsUSNAS100 – Overview
Markets are awaiting the upcoming Federal Reserve rate decision, which will set the tone for the next move:
A 50 bps cut would likely trigger strong bullish momentum.
A 25 bps cut may result in a more moderate reaction.
📉 Bearish scenario: For now, the Nasdaq shows bearish momentum while trading below 24,115, with downside targets at 23,935 → 23,870 → 23,700.
📈 Bullish scenario: A confirmed 1H close above 24,115 would shift bias bullish, opening the way to 24,245 → 24,350.
Key Levels
Pivot: 24,115
Resistance: 24,245 – 24,350
Support: 23,940 – 23,870 – 23,700

Futures steady ahead of Fed cutFutures steady ahead of Fed cut
U.S. stock futures held flat on August 15 ahead of the Sept. 17–18 Fed meeting, where a 25-bps cut is widely expected. Markets price about 70 bps of easing by year-end, though Powell may highlight inflation risks to temper dovish bets. Retail sales Tuesday will be the last key data before the decision.
Global markets were subdued: oil ticked higher on Ukraine-Russia tensions, the dollar eased, and Asian stocks firmed with South Korea’s Kospi hitting records. The Bank of Canada may also cut this week, while the BoE and BoJ are likely to stay on hold.
Traders are watching today’s Empire State manufacturing survey (8:30 AM EDT), the Senate vote on Fed nominee Stephen Miran, speeches from ECB’s Lagarde and Schnabel, and EU Council President Costa’s visit to Cyprus ahead of its 2026 presidency.

US100 Bearish reversalUS100 BEARISH REVERSAL
There is a divergence at 1H TF and now big juicy red candle has confirmed it so we might see some selling pressure.
US 100 Index – Assessing a Crucial Week for Tech StocksAs a trader it can be helpful to spend some time on a Sunday afternoon sitting at your trading desk gathering your thoughts and preparing for the week ahead. Checking the Pepperstone economic calendar to assess the scheduled risk events in terms of timing and importance can be a useful part of this process. This upcoming week is quite impressive, packed with central bank meetings and economic data that could impact many, if not all, of the major markets available to trade on the Pepperstone platform.
The standout event could be the Federal Reserve (Fed) interest rate announcement on Wednesday at 1900 BST, which is followed closely by the press conference led by Chairman Powell, which starts at 1930 BST. However, Thursday’s Bank of England interest rate decision at 1200 BST, or Friday’s Bank of Japan interest rate decision due at 0400 BST, and then the press conference led by Governor Ueda may also keep traders on volatility alert.
The US 100 index is the focus of today’s commentary as it can be more sensitive than other indices to interest rate moves made by the Fed.
As can be seen on the daily Pepperstone chart above, the US 100 index has experienced a period of higher highs and higher lows since the 2025 low was hit way back at 16290 on April 7th, helped in no small part by a re-engagement of traders with the potential of artificial intelligence and what it could mean for the future earnings of the leading companies in this space. This AI driver is still in very much in play but may take a backseat this week due to the Federal Reserve rate decision.
Since the surprise weaker than expected US employment report on August 1st (Non-farm payrolls) market expectations for Fed rate cuts have increased, helping to support the latest US 100 uptrend from its August 1st lows at 22678 to print numerous record closing highs, the latest being Friday at 24096.
For the Fed interest rate decision on Wednesday, a 25bps (0.25%) cut is fully priced by traders, but there is a small outside chance of a 50bps (0.5%) cut, a decision which, if it happened, could generate equal amounts of uncertainty that policy makers feel they could be behind the curve in supporting the economy and that the labour market is weakening faster than anticipated, but also surprise that the Fed may be willing to cut rates faster, which as a general rule can be supportive of US100 index gains.
The press conference may also be a relevant consideration for US 100 price volatility. Traders will be keen to hear Chairman Powell’s stance on the possibility for further rate cuts, with economists predicting just one more 25bps cut into the end of 2025, while the market is pricing another 2 25bps reductions. Any comments he makes on the independence of the US central bank, with an appeal court ruling expected imminently on whether President Trump has the authority to sack Fed Governor Cook, as well as his thoughts on the deterioration of the US labour markets and direction of inflation could also be important.
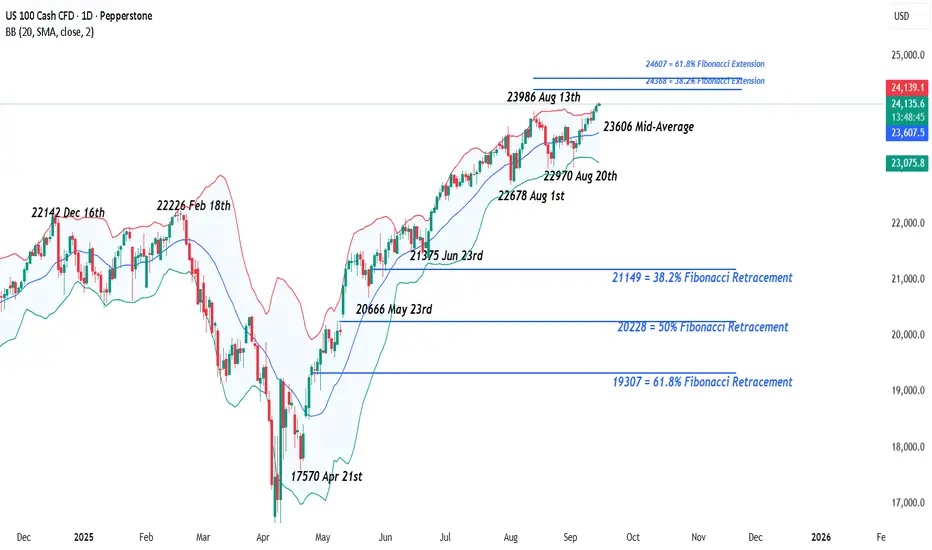
Technical Update: New All-Time Highs Posted
After reaching a new all-time high of 24142 on Friday, the market continues to show signs of a positive trend, which has been evident since the low of 16290 recorded on April 7th.
As the chart above shows, the market has formed a pattern of higher highs and higher lows. While this doesn’t guarantee that prices will continue to rise, the recent new peak suggests there might be further upward momentum ahead.
Although positive sentiment appears to remain in place, this week’s upcoming data releases and interest rate decision could significantly impact price movements.
As a result, it may be important to identify and then monitor key support and resistance levels in case an increased spell of volatility emerges.
Potential Resistance Levels:
Following the recording of the latest all-time high at 24142 on Friday, traders may be anticipating continued attempts at upward momentum to extend the current uptrend.
The outlook suggests that further attempts to push toward the next resistance levels could emerge in the coming week.
With the US 100 index now entering uncharted territory, traders may be turning their attention to Fibonacci extension levels based on the August 13th to 20th sell-off. The 38.2% extension is at 24368, and if this level is breached, the next potential resistance could be 24607, the 61.8% extension.
Potential Support Levels:
The US 100 recently closed back above the rising Bollinger mid-average, currently at 23606, and so this level could act as the first initial support for the week. If retested, it may be important to monitor whether the market can hold above it on a closing basis.
A closing break below 23606 wouldn’t necessarily signal a negative shift, but it could open the door for a test of 22970, which is the low from August 20th, and potentially lower if that level fails to hold.
The material provided here has not been prepared accordance with legal requirements designed to promote the independence of investment research and as such is considered to be a marketing communication. Whilst it is not subject to any prohibition on dealing ahead of the dissemination of investment research, we will not seek to take any advantage before providing it to our clients.
Pepperstone doesn’t represent that the material provided here is accurate, current or complete, and therefore shouldn’t be relied upon as such. The information, whether from a third party or not, isn’t to be considered as a recommendation; or an offer to buy or sell; or the solicitation of an offer to buy or sell any security, financial product or instrument; or to participate in any particular trading strategy. It does not take into account readers’ financial situation or investment objectives. We advise any readers of this content to seek their own advice. Without the approval of Pepperstone, reproduction or redistribution of this information isn’t permitted.
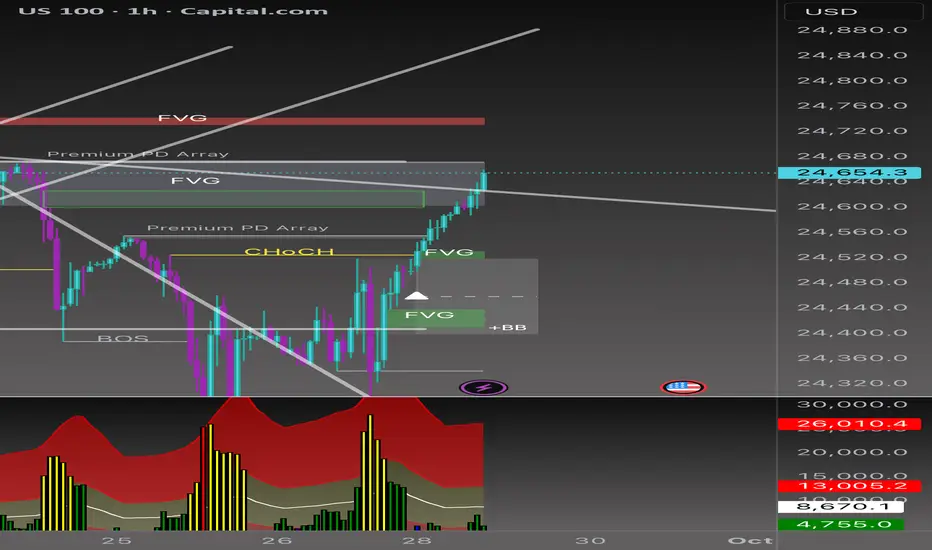
Beyond the Chart - NAS100 Through Technicals & FundamentalsThe trendline I drew last week played out perfectly. Price has carved out a fresh trend on the lower timeframe and is breaking to the upside. But the real confirmation comes only if the FVG is fully filled and we get a strong bullish close above 24,700.
NASDAQ Daily Analysis 📊
👉Hold above 24,500 – 24,520 → BUY targeting 24,700 (upper FVG). Break & hourly close above 24,700 → room to push toward 24,850 – 24,900.
👉24,700 – 24,750 → strong SELL zone (Premium PD Array + FVG overlap). First downside target: 24,400 – 24,350.
⚡️Bottom line:
• Bullish case→ If inflation comes in lower and the Fed takes a softer tone → buyers could step in and push levels higher.
• Bearish case → If data runs hot and the Fed signals more tightening → selling pressure kicks in, and your short levels become key.
NAS100 - Stock Market Awaits Employment Data!The index is above the EMA200 and EMA50 on the four-hour time frame and is in its long-term ascending channel. If the upward momentum decreases, we can expect a correction to the demand range and buy Nasdaq in that range with an appropriate reward for the risk.
According to reports released over the weekend, UBS stated that there is a 93% probability of the U.S. economy entering a recession this year. This figure implicitly suggests that the country may already be in recession, though some analysts remain skeptical of such a direct conclusion. UBS’s projection is based on indicators such as personal income, consumption, industrial production, and employment.
The bank warned that the U.S. economy has reached “historically troubling levels,” though no outright collapse has yet occurred. Analysts at UBS described the economy as “weak, soft, and fragile,” while noting that a definitive declaration of recession has not been made.
In the United States, an official declaration of recession is the responsibility of the Business Cycle Dating Committee at the National Bureau of Economic Research (NBER), which typically makes such calls with a lag of 6 to 18 months after the recession has started. Their assessment relies on revised data covering GDP, employment, income, sales, and production, and they generally avoid premature decisions.
In the meantime, policymakers and markets tend to act on real-time indicators such as GDP estimates, jobs data, yield curve signals, and credit spreads. In practice, traders react more strongly to price movements than to formal definitions of recession.
Separately, Michael Feroli, chief U.S. economist at J.P. Morgan, dismissed Fed board member Steven Miran’s call for cutting rates to 2.5% or lower. The bank has maintained its forecast for gradual 25-basis-point cuts, targeting a range of 3.25% to 3.5% by early next year.
A potential Supreme Court case involving Fed board member Lisa Cook has also emerged as a “wild card,” since a ruling against her could undermine the positions of other members as well. J.P. Morgan has warned that politicization of the Federal Reserve would leave the institution more vulnerable to pressure from a Trump administration on monetary policy.
The U.S. dollar remained relatively strong this week, as investors continued to parse the Fed’s less-dovish stance. While the latest dot plot showed policymakers aligned with the market on two additional rate cuts this year, the median dot for 2026 pointed to only one more 25-basis-point reduction. By contrast, markets still expect as many as three cuts next year.
However, following Chair Jerome Powell’s cautious tone on Tuesday—emphasizing that the Fed must continue balancing the competing risks of elevated inflation and a weakening labor market—investors scaled back some of their bets.
Inflation risks remain significant. The OECD highlighted this week that the full effects of tariff hikes are still unfolding. What supports Powell’s cautious approach is that, despite signs of labor market weakness, the Fed’s own forecasts remain relatively optimistic, with economic activity showing resilience. The Atlanta Fed’s GDPNow model projects 3.3% growth for Q3.
Although last week’s inflation data failed to dampen market optimism for rate cuts—and equities continued their rally—the focus in the coming week will shift back to labor market conditions.
The week begins Monday with pending home sales data. On Tuesday, the JOLTS job openings report and the consumer confidence index will be released. Wednesday brings private-sector employment data from ADP, followed by the ISM Manufacturing PMI. On Thursday, weekly jobless claims will be published as usual.
All of these releases will build up to Friday’s critical nonfarm payrolls (NFP) report, widely seen as the market’s ultimate test.Investors will closely monitor whether recent labor market weakness persists, and whether the Fed can move another step toward a rate cut at the October meeting. Finally, the ISM Services Index will provide a more comprehensive picture of U.S. economic health.
Ahead of the jobs data, traders may also take note of remarks from several Fed officials, including Vice Chair Jefferson, New York Fed President Williams, Atlanta Fed President Bostic, Chicago Fed President Goolsbee, and Dallas Fed President Logan. The ADP and NFP releases on Wednesday will likely provide the first snapshot of September labor market performance.

NAS100We have completed a major Wave 3, and we are now in a corrective Wave 4. The entry zone with targets has been identified, and the final target will be at the new historical highs of 25,200.

NAS100 Long Idea: Bullish Break and Retest ScenarioHello TradingView Community,
This is a technical analysis of a potential long opportunity on the US 100 Cash CFD (NAS100) on the 15-minute timeframe.
Technical Analysis:
The chart is displaying a bullish structure. We can identify a key horizontal level at approximately 24,410.03. This level previously acted as a ceiling, providing significant resistance to the price.
Recently, the market has shown strong momentum by breaking out above this resistance zone. This breakout suggests that buyers are in control. The trading idea is based on the expectation of a "break and retest" pattern, where the price pulls back to this former resistance level, confirms it as new support, and then continues its upward trajectory.
Trade Setup:
The long position tool on the chart outlines a potential trade plan based on this bullish outlook:
Entry: Approximately 24,410.03 (at the retest of the new support level).
Stop Loss: 24,117.96 (placed below the support structure to allow for some volatility and to invalidate the idea if the level fails).
Take Profit: 25,299.42 (targeting a new higher high, continuing the bullish trend).
This setup provides a structured plan with a clear risk-to-reward ratio for a potential move higher.
Disclaimer: This analysis is for educational and discussion purposes only and should not be considered as financial advice. Trading CFDs and indices involves a high level of risk. Please conduct your own research and manage your risk appropriately.

NAS100 | Pullback From All-Time Highs – Two ScenariosNASDAQ pushing new all-time highs. Watching for a short-term reversal into buying zones.
Aggressive: Tighter stop, risk around recent double bottom.
Conservative: Wider stop, allowing liquidity sweep below structure.

US100 MOVE UP AHEAD|LONG|
✅US100 price is hovering above the demand level after a sell-side sweep, hinting at ICT displacement. If the level holds, Smart Money will likely rotate price upward to rebalance inefficiency and draw liquidity toward 24,640. Time Frame 3H.
LONG🚀
✅Like and subscribe to never miss a new idea!✅


Nasdaq correction trendThe overall trend of the Nasdaq is bullish, but at the moment we can expect a bearish reaction by reacting to the MPL supply ranges until the price reaches good demand ranges.

NAS100 4H🔹 Overall Outlook and Potential Price Movements
In the charts above, we have outlined the overall outlook and possible price movement paths.
As shown, each analysis highlights a key support or resistance zone near the current market price. The market’s reaction to these zones — whether a breakout or rejection — will likely determine the next direction of the price toward the specified levels.
⚠️ Important Note:
The purpose of these trading perspectives is to identify key upcoming price levels and assess potential market reactions. The provided analyses are not trading signals in any way.
✅ Recommendation for Use:
To make effective use of these analyses, it is advised to manually draw the marked zones on your chart. Then, on the 15-minute time frame, monitor the candlestick behavior and look for valid entry triggers before making any trading decisions.
