US100 Risky Short! Sell!
Hello,Traders!
US100 made a sharp
Move up and made a
Retest of the horizontal
Resistance of 23,375
From where we will be
Expecting a local bearish
Correction and a move down
Sell!
Comment and subscribe to help us grow!
Check out other forecasts below too!
Disclosure: I am part of Trade Nation's Influencer program and receive a monthly fee for using their TradingView charts in my analysis.
USTECH100CFD trade ideas

Nasdaq 100 Holds Pivot Zone 23,280–23,360USNAS100 – Overview
The Nasdaq 100 reversed from the 23,045 support highlighted yesterday and is now trading above the pivot zone at 23,280–23,360.
Technical Outlook:
📈 Bullish scenario: As long as price holds above 23,280–23,360, upside momentum may extend toward 23,510 → 23,620 → 23,720. A confirmed breakout above 23,770 would strengthen the bullish trend and open the path to a new ATH near 24,090.
📉 Bearish scenario: On the downside, failure to hold above 23,280 would expose 23,045, with full bearish confirmation only if the index stabilizes below 22,990, targeting 22,720.
Key Levels:
Resistance: 23,510 – 23,620 – 23,720
Support: 23,280 – 23,045 – 22,720

USNAS100 Holds Above 23,690 – Bulls Eye 23,870 ATHUSNAS100 – Overview
The Nasdaq 100 remains in bullish momentum while trading above the pivot at 23,690, with the next target near the ATH at 23,870.
Technical Outlook:
📈 As long as price holds above 23,690, bullish momentum is expected toward 23,860 → 23,940 → 24,090.
📉 A confirmed 1H close below 23,690 would shift bias bearish, opening the way to 23,600 → 23,500 → 23,280.
Key Levels:
Pivot: 23,690
Resistance: 23,860 – 23,940 – 24,090
Support: 23,600 – 23,500 – 23,280

NAS100 H4 | Heading into pullback resistanceNAS100 is rising towards the sell entry at 23,720.82, which has been identified as a pullback resistance and could reverse from this level to the downside.
Stop loss is at 23,927.51, which is a swing high resistance.
Take profit is at 23,097.53, which is a multi swing low support.
High Risk Investment Warning
Trading Forex/CFDs on margin carries a high level of risk and may not be suitable for all investors. Leverage can work against you.
Stratos Markets Limited (tradu.com ):
CFDs are complex instruments and come with a high risk of losing money rapidly due to leverage. 65% of retail investor accounts lose money when trading CFDs with this provider. You should consider whether you understand how CFDs work and whether you can afford to take the high risk of losing your money.
Stratos Europe Ltd (tradu.com ):
CFDs are complex instruments and come with a high risk of losing money rapidly due to leverage. 66% of retail investor accounts lose money when trading CFDs with this provider. You should consider whether you understand how CFDs work and whether you can afford to take the high risk of losing your money.
Stratos Global LLC (tradu.com ):
Losses can exceed deposits.
Please be advised that the information presented on TradingView is provided to Tradu (‘Company’, ‘we’) by a third-party provider (‘TFA Global Pte Ltd’). Please be reminded that you are solely responsible for the trading decisions on your account. There is a very high degree of risk involved in trading. Any information and/or content is intended entirely for research, educational and informational purposes only and does not constitute investment or consultation advice or investment strategy. The information is not tailored to the investment needs of any specific person and therefore does not involve a consideration of any of the investment objectives, financial situation or needs of any viewer that may receive it. Kindly also note that past performance is not a reliable indicator of future results. Actual results may differ materially from those anticipated in forward-looking or past performance statements. We assume no liability as to the accuracy or completeness of any of the information and/or content provided herein and the Company cannot be held responsible for any omission, mistake nor for any loss or damage including without limitation to any loss of profit which may arise from reliance on any information supplied by TFA Global Pte Ltd.
The speaker(s) is neither an employee, agent nor representative of Tradu and is therefore acting independently. The opinions given are their own, constitute general market commentary, and do not constitute the opinion or advice of Tradu or any form of personal or investment advice. Tradu neither endorses nor guarantees offerings of third-party speakers, nor is Tradu responsible for the content, veracity or opinions of third-party speakers, presenters or participants.

Nasdaq Eyes 24,240 ATH as PPI LoomsUSNAS100 – Overview
The Nasdaq 100 maintained bullish momentum, retesting support at 23,695 before pushing higher again.
Technical Outlook:
📈 As long as price trades above the 23,870 pivot, bullish momentum is expected to continue toward a new ATH at 24,090 → 24,240.
📉 If the PPI release comes in hotter than expected, it may weigh on the index. A confirmed stabilization below 23,860 would open the way for a pullback toward 23,690.
Key Levels:
Pivot: 23,870
Resistance: 24,090 – 24,240
Support: 23,695 – 23,510
Bias: Bullish above 23,870; bearish correction only if price stabilizes below 23,860, with deeper downside toward 23,690

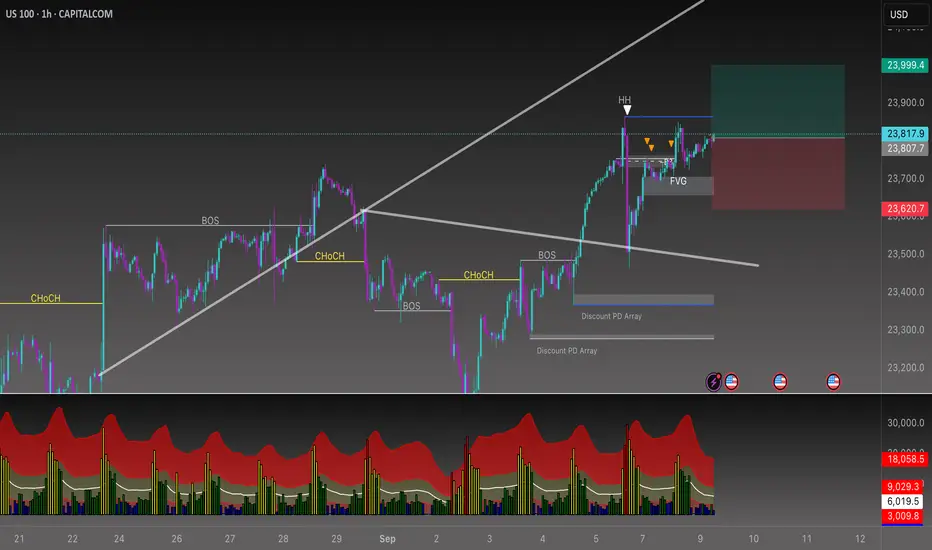
Beyond the Chart – NAS100 Through Technicals & Fundamentals📈 CAPITALCOM:US100 1H
• Strong bullish structure with HH in play.
• Liquidity grab above highs, now consolidating.
• Key support: 23,700 FVG – holds = next leg to 24K+.
• Failure = pullback into discount zones (23,400–23,200)
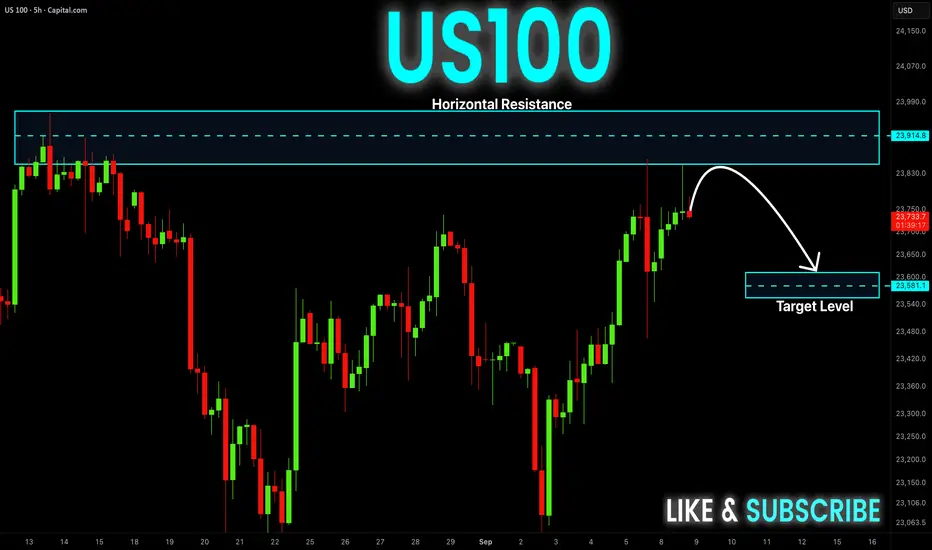
US100 Resistance Ahead! Sell!
Hello,Traders!
US100 keeps growing
In an uptrend but the
Index will soon hit the
Horizontal resistance
Of 23,970 from where
We will be expecting a
Local bearish correction
Sell!
Comment and subscribe to help us grow!
Check out other forecasts below too!
Disclosure: I am part of Trade Nation's Influencer program and receive a monthly fee for using their TradingView charts in my analysis.

Nasdaq - Preparing for another correction!🚔Nasdaq ( TVC:NDQ ) is starting to look weak:
🔎Analysis summary:
Over the course of the past couple of months, we witnessed an incredible rally on the Nasdaq. Following this previous price action, it is quite likely that we will soon see another correction. This could start with the current retest of the channel resistance trendline.
📝Levels to watch:
$23.000
SwingTraderPhil
SwingTrading.Simplified. | Investing.Simplified. | #LONGTERMVISION

Nas100 Trade Set Up Sep 5 2025FX:NAS100
www.tradingview.com
Price switched to bullish structure yesterday and is now making HH/HL so i will be looking for a pullback into 15m FVG followed by a 1m IFVG to target higher BSL

NAS100 | Bearish DivergenceNAS100 has formed bearish divergence on 1hr TF as well as on 4 hr TF which is quite a strong signal that the due correction is around.

NAS100 Bearish Reversal from Supply Zone – Short SetupThe NAS100 (1H chart) is trading within a channel structure marked by a rejection line (resistance) and a support line. Price recently broke below the EMA (70 & 200), showing bearish momentum.
Supply Zone (POI): 23,524 – 23,637, where price may retest before further decline (potential short entry zone).
Trend: Current momentum is bearish after rejection from channel resistance.
Support/Target: Main downside target is 22,979 – 22,905, aligning with previous swing low and Fibonacci extension area.
EMA Strategy: Price below both 70 & 200 EMA indicates bearish trend continuation.
Structure Break: Breakdown of channel support suggests sellers are in control.
📌 Trading Plan:
Entry (Sell Zone): 23,524 – 23,637 (POI Supply Zone)
Stop Loss: Above 23,640 (channel resistance)
Target: 22,979 – 22,905
Conclusion:
Market is in bearish structure. Wait for pullback to supply zone for a high-probability short entry, targeting the lower support zone.

short nassame strat, if price goes that order block, bullish small green candle or some red candle, looking to short this.
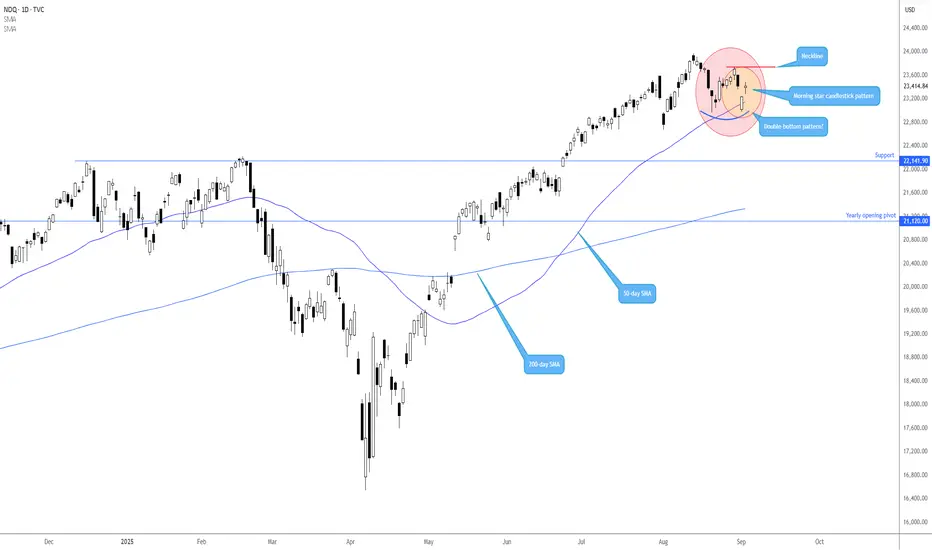
Interesting price action out of the Nasdaq 100Following the Nasdaq 100's rebound from the 50-day SMA at 23,143 on Tuesday, this has delivered two potential bullish scenarios worthy of being added to the watchlist.
First is a potential double-bottom pattern at 22,958, with a neckline calling for attention at 23,741. A breakout north of the neckline sheds light on the Stock Index potentially refreshing all-time highs beyond the current record of 23,969 (13 August).
Second is a possible morning star bullish candlestick pattern formed from the mentioned 50-day SMA. As a note, traders tend to attack this pattern’s structure by placing buy-stop orders above the pattern’s high (third candle in the formation) and positioning protective stop-loss orders beneath the pattern’s low.
Written by FP Markets Chief Market Analyst Aaron Hill
Nasdaq 100 (US100) – Short Opportunity Still AliveThe Nasdaq is still showing weakness at it's current level. There’s been more than enough time and news to push this market higher – but nothing happened. That, in itself, is a strong signal.
What we’re seeing now:
Weak jobs data: ADP and JOLTS both came in soft. Job openings hit the lowest level in nearly a year. That boosted rate-cut hopes – but the Nasdaq didn’t move.
Tech underperformance: Broader markets found some strength, but tech keeps lagging behind. Nasdaq isn’t leading like it used to – that’s bearish.
China IPO risks: New Nasdaq restrictions on Chinese listings are adding pressure to overall tech sentiment.
No follow-through: Even with dovish expectations and weak macro, bulls can’t lift the index. That says a lot.
Trade Setup (based on the chart):
Entry: between 23,480 and 23,520
Stop Loss: above 23,600 or if not high leverage even 23,720
Targets:
T1: 23,250
T2: 23,000
T3: will update depending on momentum
Why this short still makes sense:
The Nasdaq had multiple bullish triggers – weak data, Fed expectations, soft dollar – and didn’t move.
Sentiment is shaky, buyers aren’t stepping in.
Tech remains heavy while other sectors rotate.
Price is stalling right at resistance after a weak bounce.
Summary:
Plenty of chances to break out – but nothing happened. That’s a red flag.
I’m shorting between 23,480 and 23,520, with targets at 23,250 and 23,000.
Setup is invalid if we break cleanly above 23,720.
No financial advice – just how I see the chart right now.

NAS100 UPDATE - BULLS or TRAP?Dear Friends in Trading,
JOLT's Event Today - Be Safe!
Keynote:
Strong demand or strong correction?
Can price stabilize above 23550 to respect structure?
Untouched liquidity between 22900 - 22600.
I sincerely hope my point of view offers a valued insight.
Thank you for taking the time study my analysis.

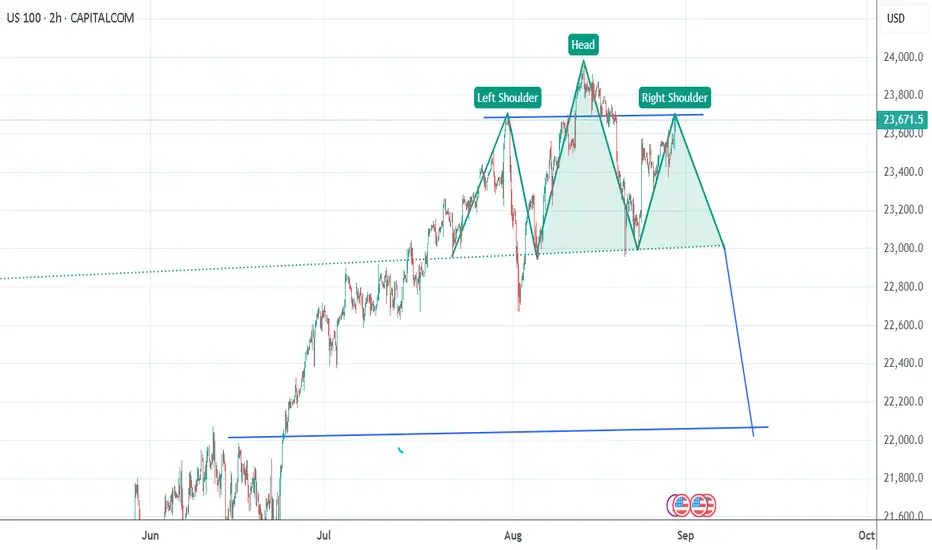
H & S patterntarget 22000
if we go down from here, i am expecting a major correction to 22k by sept end.
MIT NANDA bearish AI report
NVIDIA earning so so...
money moving to small cap
Not financial advice
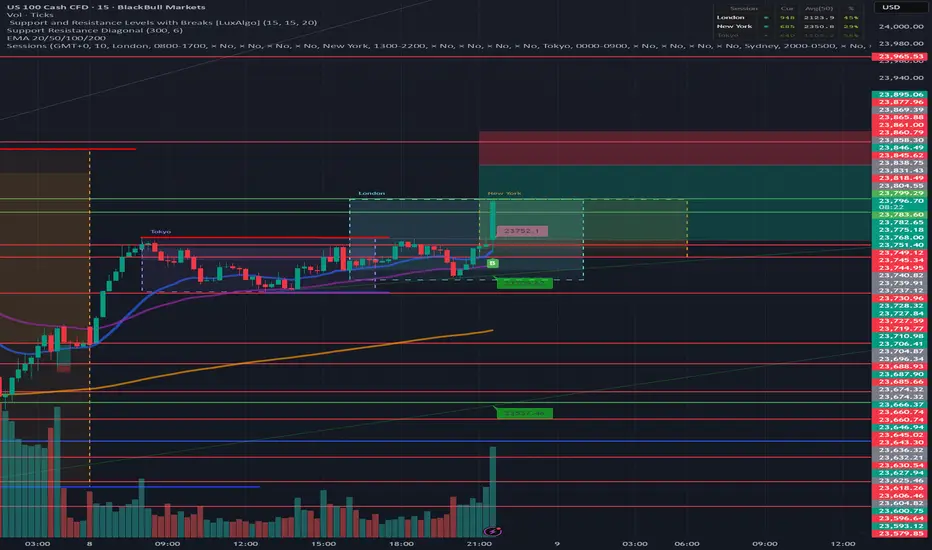
US NAS100Preferably suitable for scalping and accurate as long as you watch carefully the price action with the drawn areas.
With your likes and comments, you give me enough energy to provide the best analysis on an ongoing basis.
And if you needed any analysis that was not on the page, you can ask me with a comment or a personal message.
Enjoy Trading ;)

NAS100 OUTLOOOKPrice is within August Range, therefore it can either take the buy side liquidity/sell side liquidity before it can actually give us a significant move.
Within this August's Range, it started taking out previous weekly Buy side liquidity, therefore the price is expected to go to the relevant equal lows

NASDAQ Pullback Toward 23,160 as Index Holds UptrendHey Traders, in tomorrow's trading session we are monitoring NASDAQ for a buying opportunity around the 23,160 zone. NAS100 is trading in an uptrend, with price currently correcting toward this key support/resistance level.
Structure: The broader bias remains bullish, but price is pulling back after recent highs.
Key level in focus: 23,160 — a significant area where buyers may look to step in and resume the uptrend.
Fundamentals: Market sentiment remains supportive for equities, with U.S. data and Fed expectations keeping risk appetite intact. Any continuation of dovish Fed signals would add fuel to bullish NASDAQ momentum.
Trade safe,
Joe.

Nasdaq “Tug of war”
Nasdaq 100 has recently shown a significant shift in momentum on the 4hour chart, with bearish pressure taking hold. After a strong upward trend, the index has experienced a sharp decline, now consolidating within a critical range. The key to the next major move lies in the defence or failure of the defined support and resistance levels.
Current Market & Price Action
The price action clearly indicates a period of bearish dominance, marked by a substantial selloff from recent highs. The price is currently contained below a key resistance level at 23,515.6, which had previously acted as support. This consolidation phase is critical and suggests a tug of war between bulls and bears. The current price hovers around 23,406, leaving both a bullish reversal and a bearish continuation as plausible outcomes.
The Bearish Case : Reaching for 23,000
If the price continues to face rejection at the 23,515.6 level, the path of least resistance is to the downside. The next major target for sellers is the significant support zone between 23,000 and 22,900. This level is not only a major psychological number but also represents a strong structural support zone from previous price action.
A confirmed break below the current consolidation range, particularly the 23,331.4 level, would signal a continuation of the downtrend. A move to the 23,000-22,900 zone represents a potential drop of approximately 1.36%, as measured on the chart. Traders should watch for a decisive break of this support, which could trigger a much larger sell off.
The Bullish Case:
Reclaiming Momentum
For the bullish narrative to resume, the index must convincingly break and hold above the 23,515.6 resistance. A strong close above this level on the 4hour chart would invalidate the immediate bearish outlook and signal a potential reversal. If this occurs, the next logical target would be the higher resistance at 23,757.2, marking a potential recovery of the recent losses.
This bullish scenario would likely be fueled by a positive catalyst, such as favorable economic data or dovish comments from the Federal Reserve, which the market is currently anticipating. A successful break and retest of 23,515.6 would serve as a key entry signal for buyers aiming for higher levels.
Key Contextual Factors
Recent economic data and Federal Reserve policy expectations are likely to be major drivers for the Nasdaq's next move. As of early September, a rate cut by the Federal Reserve is heavily priced in, with some analysts predicting a move in the upcoming FOMC meeting. Any surprises to this expectation, either in a more hawkish or unexpectedly dovish direction, could trigger significant volatility. The tech heavy Nasdaq is particularly sensitive to interest rate policy, as it impacts company valuations and financing.
Summary and Outlook
Nasdaq 100 is at a pivotal point. The price is currently trapped between the 23,515 resistance and the 23,331 support.
* Bearish Trigger: A sustained break below 23,331.4 could lead to a test of the 23,000-22,900 support zone.
* Bullish Trigger: A decisive break above 23,515.6 could target the 23,757 resistance.
Given the recent price action and broader market uncertainty, the immediate risk appears to be to the downside. However, the market's direction will be confirmed by which of these critical levels is breached first.

NAS100 H4 | bullish momentum to extendNAS100 has reacted off the buy entry at 23,720.82, which is a pullback support and could bounce from this level to the take profit.
Stop loss is at 23,572.15, which is a pullback support.
Take profit is at 24,065.29, which lines up with the 61.8% Fibonacci projection and the 138.2% Fibonacci extension.
High Risk Investment Warning
Trading Forex/CFDs on margin carries a high level of risk and may not be suitable for all investors. Leverage can work against you.
Stratos Markets Limited (tradu.com ):
CFDs are complex instruments and come with a high risk of losing money rapidly due to leverage. 65% of retail investor accounts lose money when trading CFDs with this provider. You should consider whether you understand how CFDs work and whether you can afford to take the high risk of losing your money.
Stratos Europe Ltd (tradu.com ):
CFDs are complex instruments and come with a high risk of losing money rapidly due to leverage. 66% of retail investor accounts lose money when trading CFDs with this provider. You should consider whether you understand how CFDs work and whether you can afford to take the high risk of losing your money.
Stratos Global LLC (tradu.com ):
Losses can exceed deposits.
Please be advised that the information presented on TradingView is provided to Tradu (‘Company’, ‘we’) by a third-party provider (‘TFA Global Pte Ltd’). Please be reminded that you are solely responsible for the trading decisions on your account. There is a very high degree of risk involved in trading. Any information and/or content is intended entirely for research, educational and informational purposes only and does not constitute investment or consultation advice or investment strategy. The information is not tailored to the investment needs of any specific person and therefore does not involve a consideration of any of the investment objectives, financial situation or needs of any viewer that may receive it. Kindly also note that past performance is not a reliable indicator of future results. Actual results may differ materially from those anticipated in forward-looking or past performance statements. We assume no liability as to the accuracy or completeness of any of the information and/or content provided herein and the Company cannot be held responsible for any omission, mistake nor for any loss or damage including without limitation to any loss of profit which may arise from reliance on any information supplied by TFA Global Pte Ltd.
The speaker(s) is neither an employee, agent nor representative of Tradu and is therefore acting independently. The opinions given are their own, constitute general market commentary, and do not constitute the opinion or advice of Tradu or any form of personal or investment advice. Tradu neither endorses nor guarantees offerings of third-party speakers, nor is Tradu responsible for the content, veracity or opinions of third-party speakers, presenters or participants.

Nas100 Trade Set Up Sep 4 2025FX:NAS100
www.tradingview.com
price has made HH/HL with a big gap in between. It had came up and swept PDH in london session with a close below so what i want to see is either a sweep of SSL, close above, followed by 1m IFVG to go higher or a close below SSL levels to go lower towards HL/PDL
