Update (Outlook on Nas100Further to our last forecast, price continued in the expected direction and reached our identified target.
Price has now reached the daily resistance, so now we await confirmation of a retracement, or a continuation pattern in order to determine our next move.
USTECH100CFD trade ideas

Us100 /Nasdaq TP hit 180 pipsNasdaq made huge moment with our analysis 👏
Great day great job
Analysis with 100% Accuracy
1:4 TP HIT


CFDs for NASDAQ I had mentioned Monday based on the economic calender layout that we were likely to see a Tuesday internal continuation to the upside which I had written on my Substack account.
It was choppy in the New York Am but we had that really convincing run higher in the PM. I wasn't going to watch the charts during the day so I had a osok entry with a well defined stop.

Nasdaq buy Nasdaq looking for buy side breakout happened let's travel with long side 1:2 RR
GOOD MOVE GOOD ANALYSIS

CHART BREAKDOWN NASDAQ: Key Levels, Targets and Thoughts!Brief Description🖊️:
The chart provides insights into critical market levels, emphasizing an essential demand zone (low-risk buy zone) spanning from 18,264 to 18,240. Additionally, a medium-risk sell zone between 18,784 to 18,764, respectively, is highlighted.
Things I Have Seen👀:
Important Demand Zone🟢: Identified between 18,264 to 18,240, serving as a low-risk buy.
Medium-Risk Sell Zone🟠: Noted between 18,784 to 18,764, suggesting another area with moderate risk for potential buying positions.
Bullish Targets📈:
18,350: Possible retracement area.
18,470: Possible retracement area.
18,720: Possible retracement area.
18,764: Significant supply zone.
Ultimate Target: 18,950- Liquidity area.
Bearish Targets📉:
18,730: Possible retracement area.
18,650: Possible retracement area.
18,500: Possible retracement area.
18,400: Possible retracement area.
18,264: Essential Demand Zone
Ultimate Target: 18,200- Laying Low Liquidity
What's Important Now❗
Currently, the crucial approach is to wait and observe the price action at this level. We need to assess how the market reacts before considering any decisive moves. Stay observant and responsive to real-time developments in the market.

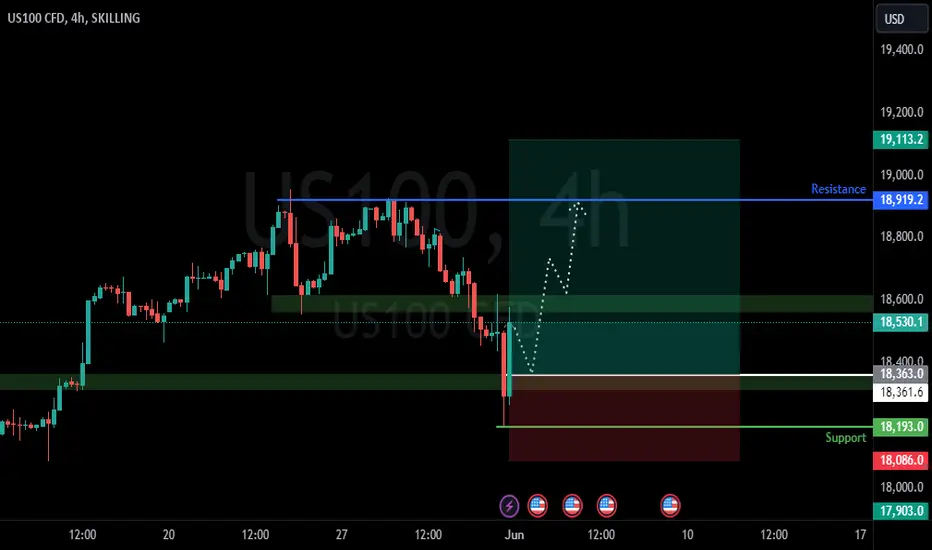
#Nazdaq #Nas US100 #stockmarketAccording to my analysis, I see the NASDAQ index rising to the range of 18,800. After reaching this level, a correction is likely. If the index breaks through the 18,800 range, we can expect it to rise further to the 19,150 level before entering a corrective phase.
Additionally, if a candle closes below the 18,500 level, the correction process is expected to start from this area. Based on these levels and the current analysis, we can anticipate potential market movements accordingly.


Nasdaq starts its vacationMixed results are expected this day as we begin a new trading month and WallStreet indices start with solid gains in the month of May. The S&P500 benchmark is up 17 points or about 0.3%. The Nasdaq Composite was up 156 points (0.9%), and the Dow Jones Industrial Average, composed of 30 top companies, fell 25 points (-0.1%). The PCE data showed a slight cooling of the U.S. economy, which has encouraged the FED to possibly cut interest rates in September. The S&P500 rose 0.8% to 5,277.51 points on Friday, while the Dow Jones rose 0.8% to 38,686.32 points and Nasdaq lagged on weakness in tech companies closing flat at 16,735.02 points.
May nonfarm payrolls are a key data point on Friday. Fed traders' consensus was 47% for a 25 basis point cut in September, in conjunction with a 45% probability that it will maintain its monetary policy according to CME Fed Watch. The central bank is expected to hold rates steady, and Fed officials continue to call for patience with rate cuts looking for evidence of a return to inflation stability on the 2% path. Already last Monday Neel Kashkari of the Minneapolis Fed echoed this by reporting that they could remain unchanged for an “extended” period of time.
If we look at the Nasdaq chart (Ticker AT: USATEC) the fact is that on Friday the first price resistance was pierced at the 18,197 area returning to the support zone of May 23rd. The price bell has generated a price control zone at 18,820 points with a dual bell marking the second lower bell around 18,626 points. The RSI is currently oversold at 41.60%, it will not be uncommon this month to see a price drop to Friday's second resistance zone. And a return to the mean. The truth is that this month can be quite weak in terms of sales in many technology sectors and Nasdaq has been practically dragged down by the Magnificent 7 and not so much by the rest that have barely experienced a palpable growth.
Ion Jauregui - ActivTrades Analyst
*******************************************************************************************
The information provided does not constitute investment research. The material has not been prepared in accordance with the legal requirements designed to promote the independence of investment research and such should be considered a marketing communication.
All information has been prepared by ActivTrades ("AT"). The information does not contain a record of AT's prices, or an offer of or solicitation for a transaction in any financial instrument. No representation or warranty is given as to the accuracy or completeness of this information.
Any material provided does not have regard to the specific investment objective and financial situation of any person who may receive it. Past performance is not reliable indicator of future performance. AT provides an execution-only service. Consequently, any person acing on the information provided does so at their own risk.

US100US100 is in bullish trend.
Potentially printing HH and HL.
No sign of reversal .
We buy at CMP.

View on NAS100 1.NAS100 broken the Trendline Liquidity and looking for new HH.
2.We take a Long from the new support around 17270.
3.If Dollar continuous the bearish movement we can see a huge upside movement in Indices.
4.Today CPI news is very important for the Dollar. Depending on the news we can see a huge a moves in the market.

US 100 SELLI want to try this sell, in my opinion probable reversal.
The real key regardless of any strategy is to have a decent risk/reward .
You win and you lose , so be cautious.
No financial advice, do your own research

bearish pressureUSNAS100
- Tendency :
the price is under bearish pressure 18,675
- Turning level :
The turning level is at 18,675 where price has now stabilized at the bottom
- resistance level :
Breaking the turning level 18,675 , the price will up to 18,795 and 18,885
- support level :
The trading stabilizing below 18,675 the price will reach the support level of 18,490 and 18,325
- corrective level :
price will attempt in 18,675 correct itself before falling

NASDAQ spread M2SL almost reached 2001 levelsNASDAQ spread between M2 supply almost reached levels we not seen since 2001. Almost like double top or sqeezed top wave5 (1.105 level of whole range as max target). Couple months may give us clue, as usually these extreme levels suppose to reached very fast if we close to real top.

GOLD SHORTGold already make breakout on daily hopefully there will be retracement on and entry area on 30M EMA

US100 SHORTMy US100 analysis is short position currently. This is just my own opinion.
Trade at your own risk!


NAS100 ShortElite Trading
Discretionary Trade
Executed trade in 5 minutes
Targeting Lower Liquidity Pools
Main Target Weekly Market Structural Liquidity

A short term analysisUs 1 year bond is showing a strength which means dollar will or might do the same thing, expenditure of dollar will go to stock etc, on the other hand, the stock VALUE will be allocated to paper money DOLLAR
Not a financial adviice

CHART BREAKDOWN NASDAQ: Key Levels, Targets and Thoughts!Trade Update: NASDAQ
We have some great news on our recent NASDAQ trade! 💲
After analyzing the market conditions and identifying a solid setup, our trade has successfully Hit Take Profit 3 (TP3). This made sure that 100% of our positions have been secured and cashed out, allowing us to lock in ALL profits.
Following this, we closed this trade fully with a Risk to Reward of 10! This strategy not only protects our capital but also gives us the opportunity to capture further potential gains.
Stay tuned for more updates and happy trading! 🚀

US100NASDAQ Poised for Continued Upswing, Eyeing 20,650 Range
In the current market landscape, NASDAQ appears primed for further ascent, targeting the 20,650 price range. Supported by robust momentum, the index is positioned to maintain its upward trajectory. Crucially, it is residing comfortably above both the exponential moving averages (EMAs) of 21 and 90 periods, indicating sustained bullish sentiment.
The NASDAQ's resilience is underpinned by several factors. Firstly, favorable economic indicators coupled with positive corporate earnings continue to bolster investor confidence. Additionally, ongoing fiscal stimulus measures and accommodative monetary policies provide further tailwinds to equity markets.
Furthermore, the index's ability to sustain levels above key EMAs, particularly the 21 and 90-day EMAs, underscores the strength of the prevailing bullish trend. This implies that the market sentiment remains buoyant, with investors exhibiting a propensity to buy on dips, further reinforcing the upward bias.
However, prudent risk management remains imperative, as market dynamics can swiftly evolve. While the current outlook suggests continued upward momentum, potential geopolitical tensions or unforeseen economic headwinds could introduce volatility.
In conclusion, NASDAQ's upward trajectory, targeting the 20,650 range, is supported by robust fundamentals and technical indicators, with the index comfortably positioned above key EMAs. Yet, vigilance and adaptability are essential amidst evolving market conditions.
