NAS100 Trade Plan: Counter-Trend Opportunity Into Friday CloseI’m currently watching the NASDAQ NAS100 📊 and looking for a potential setup as we head into the Friday close. The market has pushed into the weekly low, and I’m anticipating the possibility of a retracement, which could offer a counter-trend opportunity during the New York session. 🚀📉📈 All details are broken down clearly in the video — this is not financial advice. ⚠️
Trade ideas

NAS100 Trade Secured 1500 PipsSet up played out perfectly BOS on the 1h during London session, fail to sweep SSL, 5m engulfing/CISD, to target BSL/PDH


NAS100 - Waiting for buy setup on 4hr timeframeTimeframes Used: Monthly → Weekly → Daily → 4H
Current Market Condition:
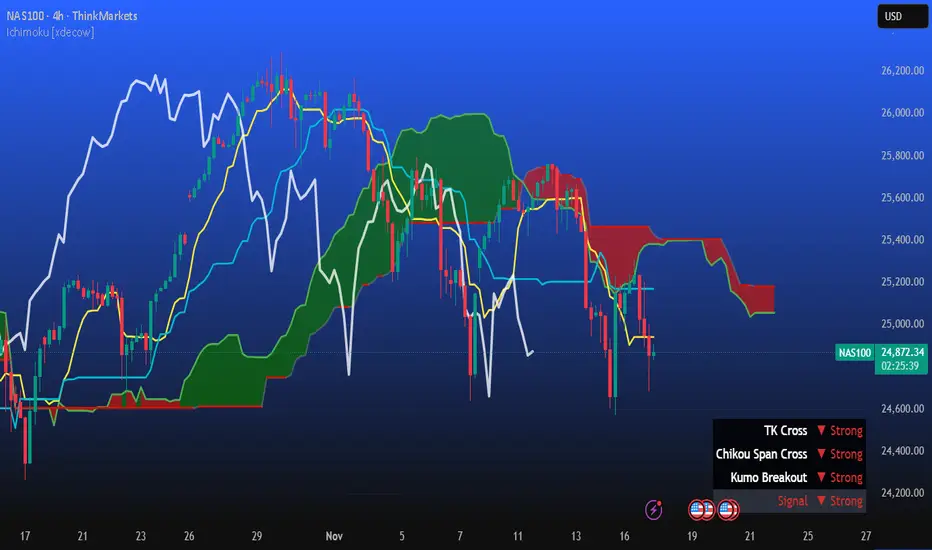
Nas 100 is a valid trade according to my system rules:
Monthly: Price is above the Cloud → Bullish
Weekly: Price is above the Cloud → Bullish
Daily: Price is above the Cloud → Bullish
----------------------------------------------------------------------------------------------------------------
What I’m Waiting For:
I’ll be watching for the next 4H breakout opportunity.
Price to break above the 4hr timeframe.
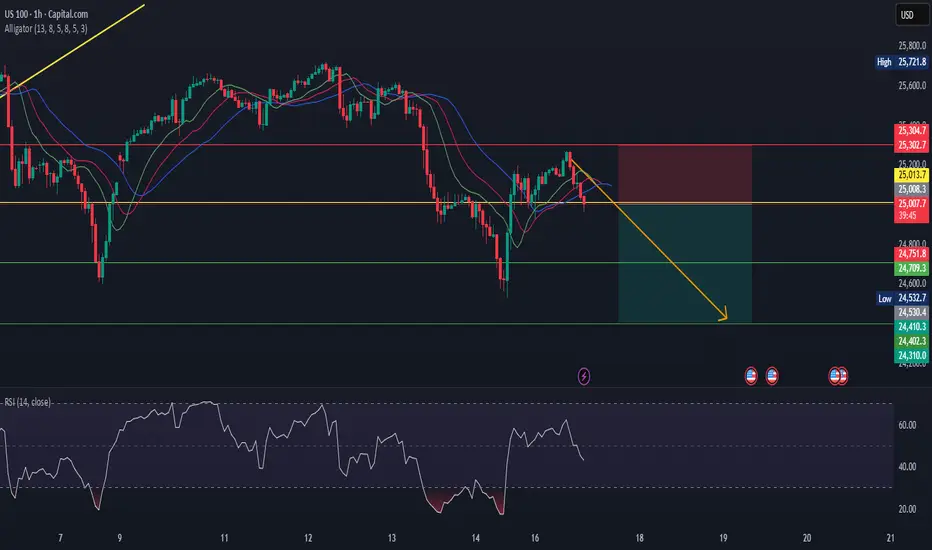
US100US100 is in bearish trend.
No sign of divergence here.
Alligator also indicates price will go down .
We sell at CMP
BULLISH ON NASThe 4HR tf had a break of the low, created a new low with a morning star that gave us a change of character toward the upside and pulled back with 2 bearish rejecting candles and now is starting to push up without a bullish engulfing candle. Details are more visible on the 2Hr tf.

The BreakDown ClubThis is a minimalistic setup that we are seeing for today, an expansion expected. We analyse we wait and see

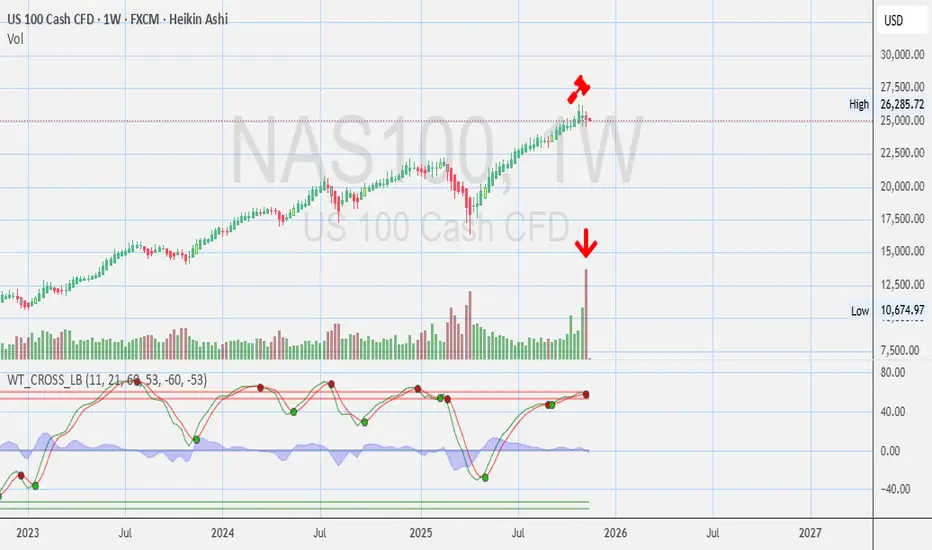
NASDAQ - Weekly Chart Opinions? Game Over ? or 🧠 Keep it on watch. Momentum shifting.
Any Opinions on HUGE VEEKLY VOLUME? Game Over? or?
⚠️ Disclosures :
This analysis is for informational purposes only and is not financial advice. It does not constitute a recommendation to buy, sell, or trade any securities, cryptocurrencies, or stocks. Trading involves significant risk, and you should consult with a qualified financial advisor before making any investment decisions. Past performance is not indicative of future results.
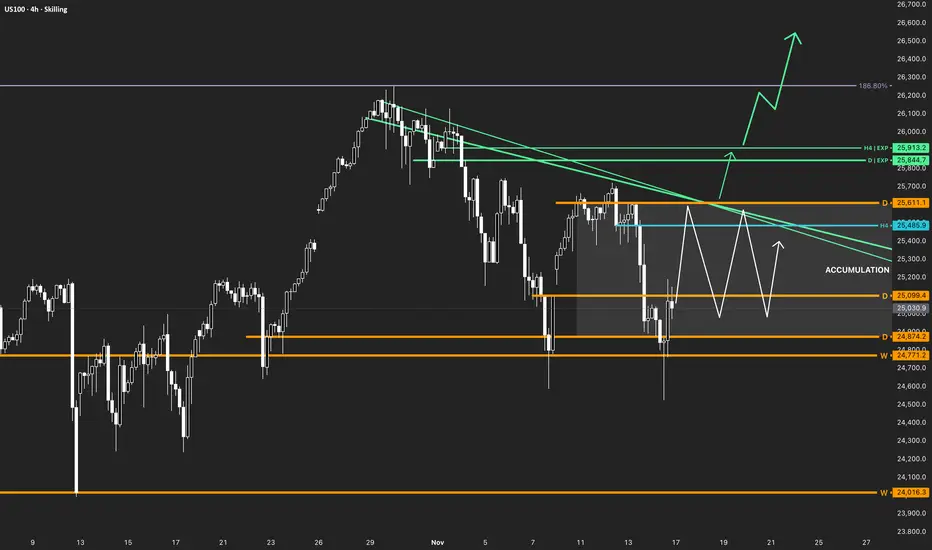
NASDAQ100 (US100) | Accumulation Phase in the Bullish trendHey Traders,
This is a zone where the market usually changes direction a lot, so be careful.
Trend: Primary Bullish
Weekly: 🟢
Daily: 🔴
H4: ⚪️
Phase: Accumulation
Bullish: D Close > 25,611.1 | → 25,844.7 → 25,913.2
Bearish: W Close < 24,016.3
Be Patient!
Peter
US NAS 100DO YOU KNOW WHATS BEHIND THIS OR OTHER IDEAS?? in bio..
Preferably suitable for scalping and accurate as long as you watch carefully the price action with the drawn areas.
With your likes and comments, you give me enough energy to provide the best analysis on an ongoing basis.
And if you needed any analysis that was not on the page, you can ask me with a comment or a personal message.
Enjoy Trading ;)

NAS100 Trade Secured 2000 Pipsprice manipulated higher tapping into the fib level and sweeping extreme BSL to then engulf on the 15m, BOS to the downside to target SSL and PDL

NAS100 Bullish Structure Break with Key Fibonacci Level in PlayThe NAS100 is now showing clear signs of strength, with a solid bullish move and a confirmed break of structure on the 4-hour timeframe 🚀. With this shift, the focus turns to how price behaves on the pullback.
The main level of interest is the 61.8% Fibonacci retracement of the current swing. A buy setup becomes valid only if price retraces and holds above the 61.8 level 🔥. Holding above this zone would indicate a shallow pullback — a strong sign that buyers are stepping in aggressively and maintaining control.
If price respects the 61.8 and then breaks structure to the upside again, that’s the confirmation needed to look for long opportunities 📊.
However, if price breaks below the 61.8 level, the idea is invalidated and should be abandoned. A deeper retracement may signal weakness, although it could also be a smart-money liquidity run before a continuation — either way, the priority is to see momentum hold above 61.8 to keep the bullish narrative intact ⚠️.
Not financial advice.

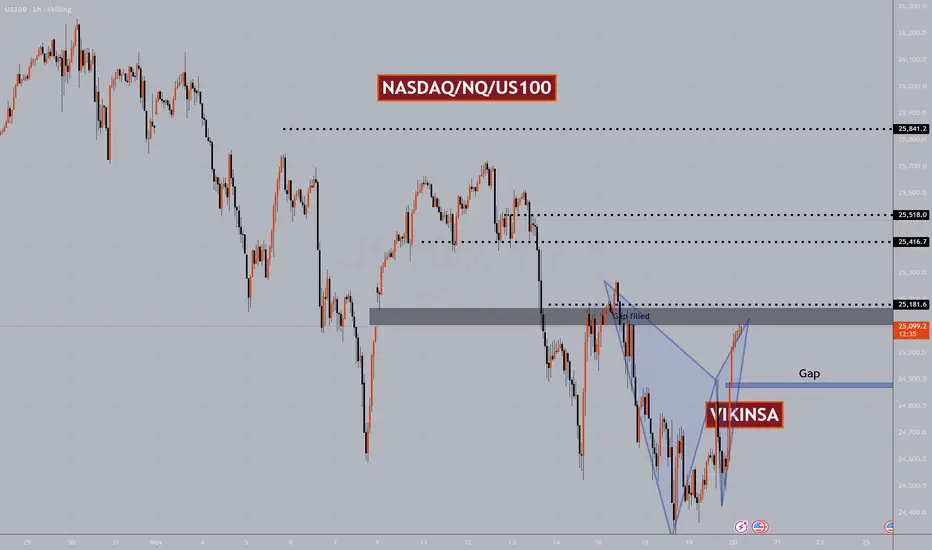
NASDAQ $NQ US100 Major Levels And PatternsNasdaq bounced yesterday heavily and completed a W pattern. I personally have been able to capture majority of this move. You can consider yesterday's W pattern a sort of double bottom which means hat more bullishness is expected in the medium term.
On a short term, now that it has completed a W pattern and reached previous important zone which had a gap, so we can expect a correction here but this may not be a big one. In a rare case there may not be any correction here at all because NASDAQ is forming a pattern which when forms usually ignores all the smaller W and M patterns.
For that reason my Bias is bullish and I will look for buying opportunities mostly.
There are certain Higher time frame levels that I am watching closely which you will find on the chart.
Trade what you see, manage the risk.
Follow for more. Please support this analysis by liking, commenting, and sharing with friends, colleagues, traders, and trading communities. Thanks👍🙂
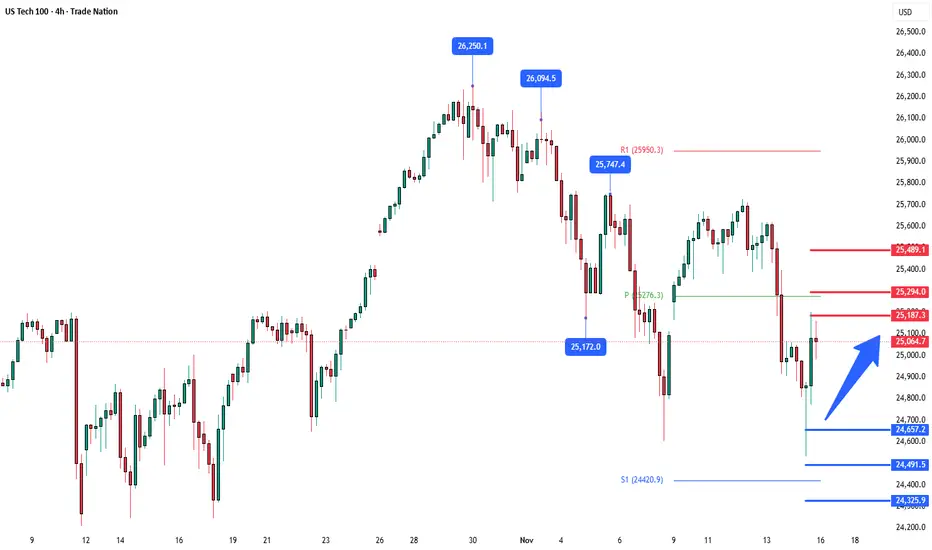
NSDQ100 The Wek Ahead, Key Trading LevelsKey Support and Resistance Levels
Resistance Level 1: 25180
Resistance Level 2: 25300
Resistance Level 3: 25500
Support Level 1: 24655
Support Level 2: 24490
Support Level 3: 24330
This communication is for informational purposes only and should not be viewed as any form of recommendation as to a particular course of action or as investment advice. It is not intended as an offer or solicitation for the purchase or sale of any financial instrument or as an official confirmation of any transaction. Opinions, estimates and assumptions expressed herein are made as of the date of this communication and are subject to change without notice. This communication has been prepared based upon information, including market prices, data and other information, believed to be reliable; however, Trade Nation does not warrant its completeness or accuracy. All market prices and market data contained in or attached to this communication are indicative and subject to change without notice.
Us100 on bullishDouble bottom has confirmed following with shooting star and a bullish engulfer on a h4 timeframe

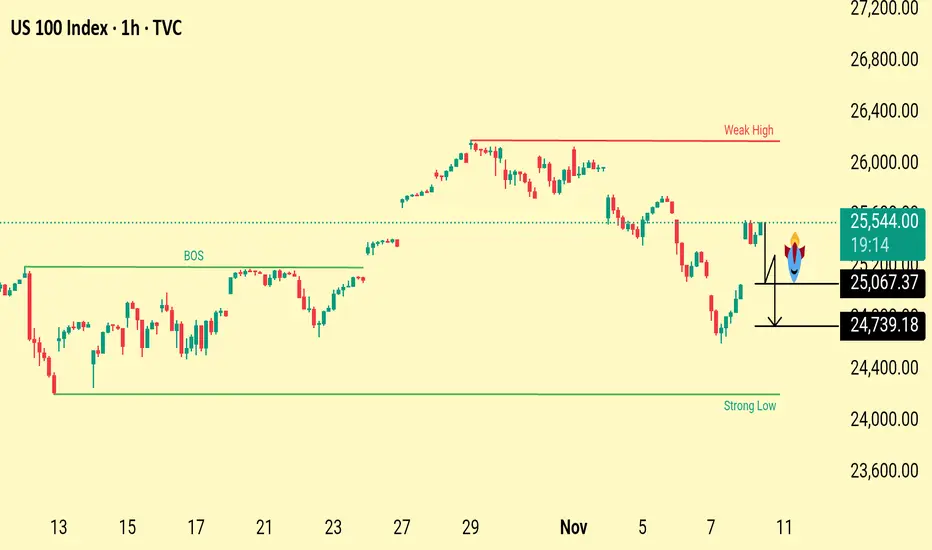
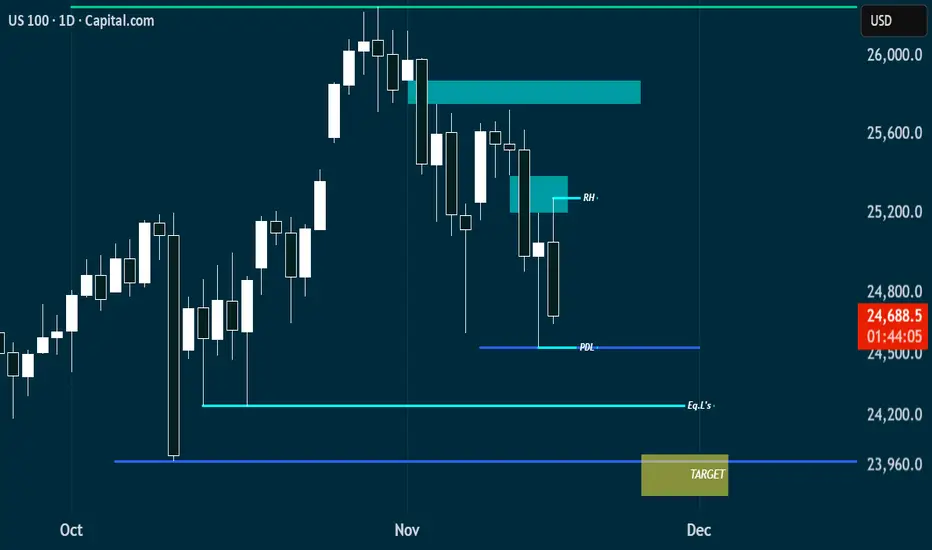
US100 Price Action Outlook Weak High Target&Liquidity SweepZonesThe chart highlights a weak high above current price action, suggesting potential upside liquidity targets. Below, key downside levels at 25,067 and 24,739 mark liquidity pools and possible retracement zones if price rejects current resistance. The structure shows a recent break of structure with both bullish and bearish scenarios in play.
Price is reacting near a resistance area after a recent bounce. The weak high above suggests liquidity may be targeted before any reversal. If price rejects this zone, the next downside levels to watch are 25,067 and 24,739, where liquidity sits and buyers may step in. Structure remains mixed, with both upward liquidity grabs and potential pullbacks likely
USNAS1OO Appear Breakout phase, with bullish pressure building.The USNAS100 (NASDAQ 100) appears to be in a consolidation-to-breakout phase, with bullish pressure building.
U.S. stock index futures are advancing on Monday following positive developments in Washington toward ending the U.S. government shutdown the prolonged shutdown had delayed key economic data releases and increased uncertainty over growth. Renewed optimism for resolution has improved risk sentiment, prompting buying momentum in equity futures.
If price sustains above 25,000 and momentum continues, bulls could “shut down” the recent NASDAQ decline by pushing toward 25,750 – 26,005 a strong breakout with volume could trigger further upside toward 26,250–26,500, aligning with the next major resistance zone.
You may find more details in the chart,
Trade wisely best of Luck Buddies.
Ps; Support with like and comments for better analysis Thanks for Supporting.

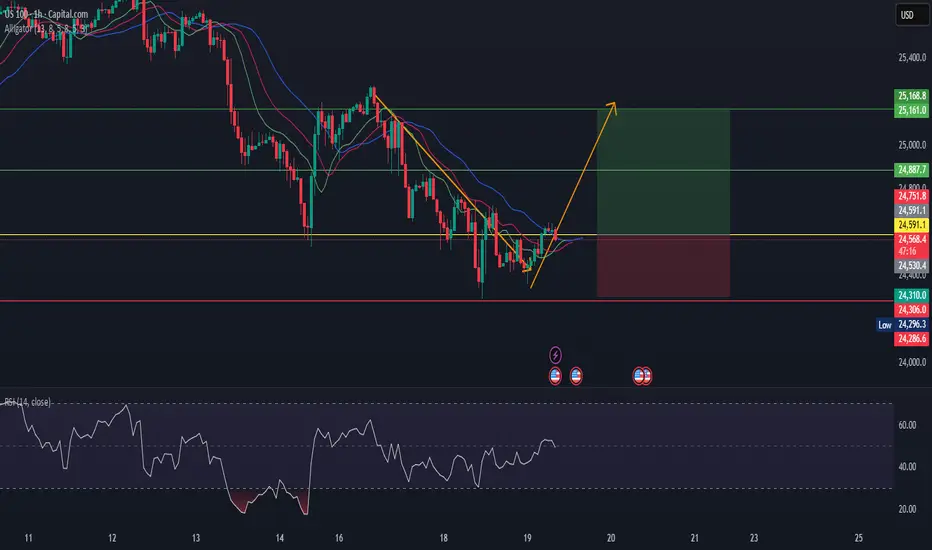
US100US100 is in reversal mode.
As per my analysis.
Alligator direction change to upward.
bullish divergence also made.
See here strong buy indicatin.
Buy at CMP.
US100 - BEARISHEvening all!
Keeping it simple and short, the dollar is undervalued, and everything (indexes, crypto, precious metals) all melting up at the same time - im anticipating an end to 2025 that see's the dollar rise, and the melt up, melt down!
For US 100 - Target/draw on liquidity is the Weekly STL overall.
november 17th trade breakdownhey guys in this video i broke down the strategy i use to trade the markets i hope it brings value to your journey . i also broke down the trade i saw this morning in new York session. keep in a look out for videos this week

US100 | Bullish Reversal From Demand Zone — Targeting 25,200 LiqUS100 has reacted strongly from the 24,400–24,900 major demand zone, showing a sharp rejection and reclaiming structure. Price is now building momentum toward the 25,200 buy-side liquidity level.
A clean consolidation + breakout pattern is forming just below liquidity, indicating potential continuation to the upside.
Market Breakdown:
HTF Bias: Bullish
Demand Zone: 24,400 – 24,900
Intraday Target: 25,201 liquidity zone
Extended Target: 25,722 (major buy-side liquidity)
Confirmation: Break & retest above 25,100
Invalidation: Clean break below 24,950

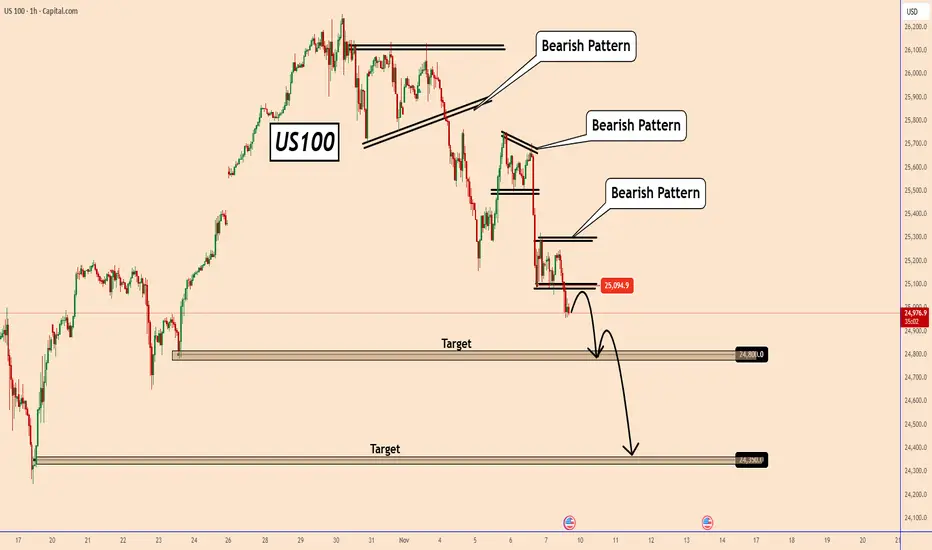
US100: Ready To Start a Downward Move?US100: Ready To Start a Downward Move?
A few days ago I posted an bullish forecast for US100.
US100 couldn't manage to break above the triangle pattern, and the price turned bearish.
Currently, we can see several bearish patterns one after the other. This sell-off started yesterday and may continue further in the coming days.
It could be related to earnings reports, AI bubble fears, etc. However, all indices were also heavily overvalued.
If the price respects this new bearish structure, we could see US100 falling to 24800 and 24350 first.
I will keep you all updated.
You may find more details in the chart!
Thank you and Good Luck!
❤️PS: Please support with a like or comment if you find this analysis useful for your trading day❤️
New Highs Before a Major Correction?The NASDAQ remains firmly within its main ascending trend channel, respecting both the upper and lower boundaries since mid-2023. After a sharp dip triggered by tariff-related headlines, the index quickly recovered, reaffirming bullish momentum and establishing a new support base along the lower trendline.
We’re now approaching the 2nd Fibonacci extension level drawn from the previous major top to the last significant bottom — a key confluence area that historically signals potential exhaustion of the current leg up.
Based on the current price trajectory, this zone could act as a probable top region, marked by the green resistance box on the chart. If the market reacts here, a technical correction or consolidation phase could unfold, retracing back toward the support zone around the mid-channel (highlighted in green).
The “500 Days Rich Man Theory” line (July 2026) may coincide with a macro cycle inflection point, suggesting a timing window for trend reversal or cooling period before the next long-term advance resumes.
